
Other information: Corporate & Investment Banking
Highlights
- Strong impetus for lending activity and stability in customer funds in the quarter
- Double-digit income growth in Spain, Turkey, Mexico and South America
- Improved efficiency ratio
- Impairment on financial assets well below March 2021
Business activity (1)
(VARIATION AT CONSTANT EXCHANGE RATES COMPARED TO 31-12-21)
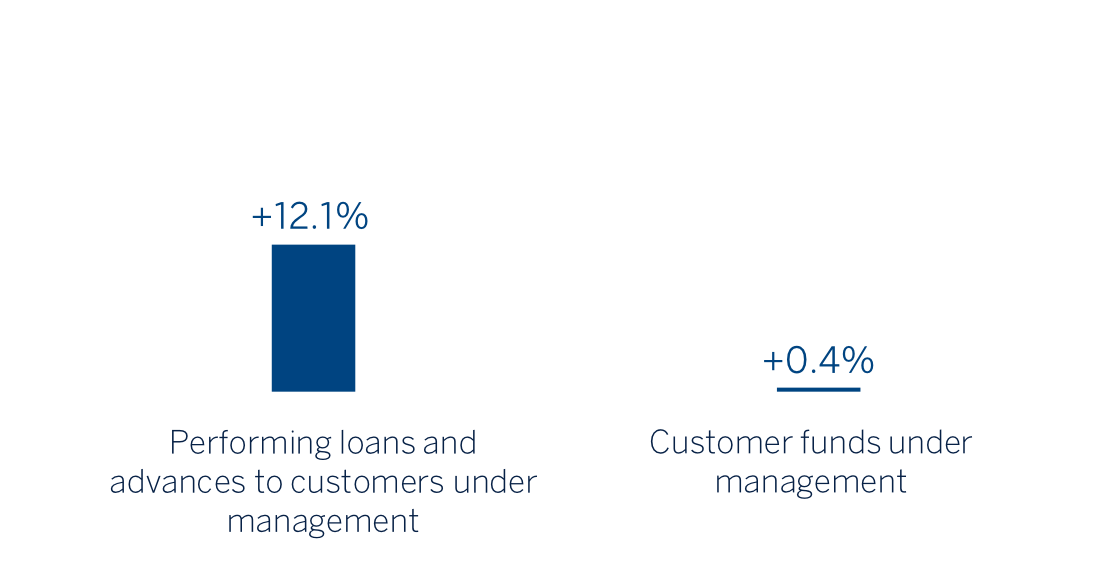
(1) Excluding repos.
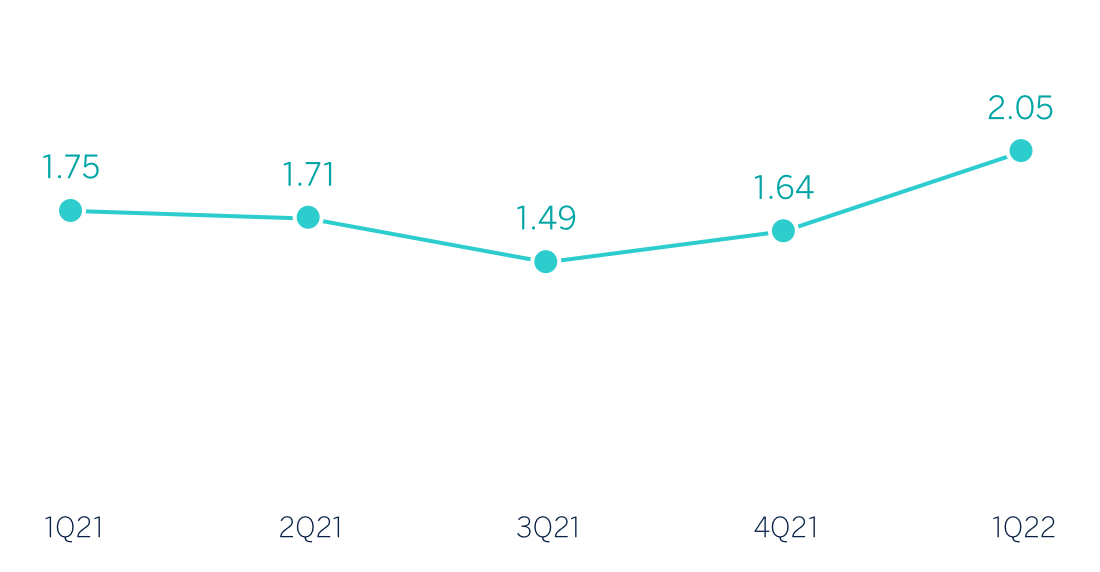
Gross income / AVERAGE TOTAL ASSETS
(Percentage. Constant exchange rates)
Operating income
(Millions of euros at constant exchange rates)
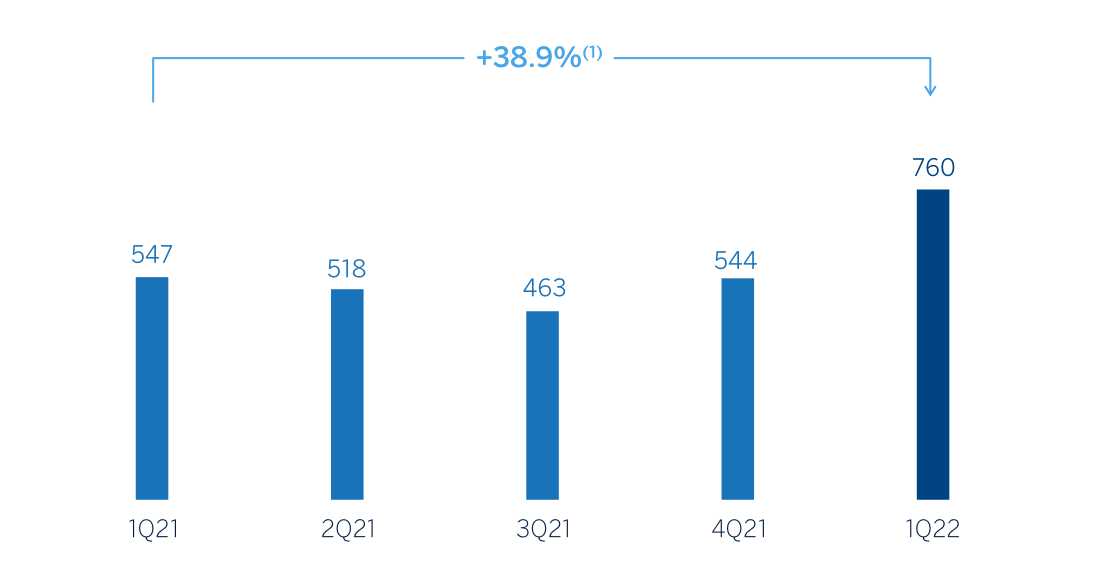
(1) At current exchange rates: +26.5%
Net attributable profit (LOSS)
(Millions of euros at constant exchange rates)
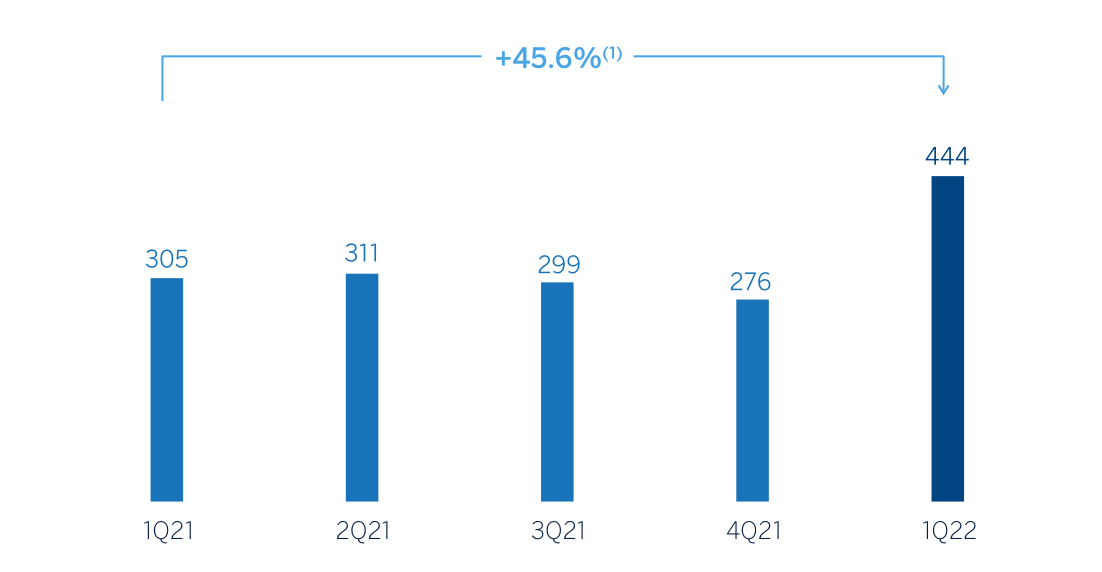
(1) At current exchange rates: +39.1%
Financial statements and relevant business indicators (Millions of euros and percentage)
| Income statement | 1Q22 | ∆% | ∆% (1) | 1Q21 (2) |
|---|---|---|---|---|
| Net interest income | 466 | 22.1 | 29.3 | 381 |
| Net fees and commissions | 198 | 3.2 | 10.9 | 192 |
| Net trading income | 363 | 33.1 | 44.4 | 273 |
| Other operating income and expenses | (8) | (27.0) | (27.1) | (11) |
| Gross income | 1,019 | 22.0 | 30.7 | 835 |
| Operating expenses | (259) | 10.3 | 11.3 | (235) |
| Personnel expenses | (119) | 12.1 | 12.8 | (106) |
| Other administrative expenses | (114) | 12.6 | 14.4 | (101) |
| Depreciation | (26) | (5.4) | (5.7) | (27) |
| Operating income | 760 | 26.5 | 38.9 | 601 |
| Impairment on financial assets not measured at fair value through profit or loss | (21) | (51.5) | (34.3) | (43) |
| Provisions or reversal of provisions and other results | 19 | n.s. | n.s. | (22) |
| Profit (loss) before tax | 758 | 41.5 | 53.8 | 536 |
| Income tax | (211) | 49.9 | 60.8 | (141) |
| Profit (loss) for the period | 548 | 38.5 | 51.3 | 395 |
| Non-controlling interests | (104) | 35.9 | 81.8 | (76) |
| Net attributable profit (loss) | 444 | 39.1 | 45.6 | 319 |
- (1) At constant exchange rates.
- (2) Restated balances. For more information, please refer to the “Business Areas” section.
| Balance sheets | 31-03-22 | ∆% | ∆% (1) | 31-12-21 |
|---|---|---|---|---|
| Cash, cash balances at central banks and other demand deposits | 6,334 | 23.6 | 19.9 | 5,125 |
| Financial assets designated at fair value | 121,982 | (7.4) | (8.0) | 131,711 |
| Of which: Loans and advances | 48,695 | (11.8) | (12.0) | 55,232 |
| Financial assets at amortized cost | 80,211 | 10.8 | 9.9 | 72,363 |
| Of which: Loans and advances to customers | 70,185 | 13.1 | 12.1 | 62,042 |
| Inter-area positions | - | - | - | - |
| Tangible assets | 54 | 24.6 | 23.2 | 43 |
| Other assets | 1,061 | n.s. | n.s. | 110 |
| Total assets/liabilities and equity | 209,641 | 0.1 | (0.7) | 209,352 |
| Financial liabilities held for trading and designated at fair value through profit or loss | 92,173 | (3.3) | (3.8) | 95,283 |
| Deposits from central banks and credit institutions | 16,255 | 26.2 | 25.4 | 12,884 |
| Deposits from customers | 38,572 | 0.6 | (1.1) | 38,360 |
| Debt certificates | 4,279 | (25.5) | (27.1) | 5,746 |
| Inter-area positions | 45,440 | 2.8 | 2.6 | 44,196 |
| Other liabilities | 2,615 | (9.8) | (9.2) | 2,901 |
| Regulatory capital allocated | 10,306 | 3.2 | 1.2 | 9,983 |
| Relevant business indicators | 31-03-22 | ∆% | ∆% (1) | 31-12-21 |
|---|---|---|---|---|
| Performing loans and advances to customers under management (2) | 69,657 | 13.1 | 12.1 | 61,588 |
| Non-performing loans | 1,373 | (3.1) | 0.6 | 1,417 |
| Customer deposits under management (2) | 38,011 | 1.5 | (0.1) | 37,445 |
| Off-balance sheet funds (3) | 1,500 | 14.2 | 14.0 | 1,314 |
| Efficiency ratio (%) | 25.4 | 30.9 |
- (1) At constant exchange rates.
- (2) Excluding repos.
- (3) Includes mutual funds, customer portfolios and other off-balance sheet funds.
Unless expressly stated otherwise, all the comments below on rates of change, for both activity and results, will be given at constant exchange rates. These rates, together with changes at current exchange rates, can be found in the attached tables of financial statements and relevant business indicators.
Activity
The most relevant aspects related to the area's activity in 2022 were:
- Lending activity (performing loans under management) recorded a double-digit increase in the first quarter of 2022 (+12.1%), after a complex year 2021 marked by the competitive environment, excess liquidity in the market and difficulties in renewing agreements. All geographical areas, excluding South America, recorded a positive evolution with Rest of Business, Turkey and Mexico leading the way. By product, the Global Transaction Banking operation stands out.
- Customer funds remained stable during the first quarter of the year, thanks to the active management of the area and closed March with a slight increase of 0.4% compared to December 2021. Deposits from the Group’s wholesale customers continue to be a relevant lever for the Group’s liquidity management. By geographical areas, the positive evolution in South America (+12.6%) and, to a lesser extent, in Spain (+2.6%) stands out.
Results
CIB generated a net attributable profit of €444m in the first quarter of 2022, which represents an increase of 45.6% on a year-on-year basis, thanks to the growth in recurring income, NTI and lower provisions, which offset the growth in operating expenses. It should also be noted that all business lines of the CIB area recorded growth compared to the first quarter of 2021, both in income and at the level of net attributable profit.
The most relevant aspects of the year-on-year evolution in the income statement of this aggregate are summarized below:
- At the end of the first quarter of the year, net interest income stood +29.3% above the same period last year, thanks to the aforementioned good performance of lending activity and the performance of the Global Markets unit. By geographical areas, double-digit growth in Turkey, Spain and South America stands out.
- Net fees and commissions recorded an increase of +10.9%, mainly due to the performance of investment banking and the performance of Project Finance, as well as transactional banking and the good global performance, particularly in cash management. Double-digit growth in South America and Mexico stands out, which offset the lower contribution of Rest of Business and Spain.
- NTI showed a good evolution (+44.4%), mainly due to the performance of the Global Markets unit, driven by the income from business activity and intraday trading in foreign exchange positions. By geographical areas, Turkey and, to a lesser extent, Mexico and Spain stand out.
- Operating expenses increased by 11.3% in the first quarter of 2022, in a year-on-year comparison affected by the cost containment plans implemented by CIB in 2021, although the area continues to focus its efforts on discretionary expenses. Despite the aforementioned, the efficiency ratio stood at 25.4%, which is a significant improvement over the same period last year (-268 basis points).
- Provisions for impairment on financial assets were significantly lower than in the previous year, due to lower impacts on individual clients in most geographical areas.
- Finally, the provision line recorded a net release at the end of the first quarter of 2022, which contrasts with the provisions made twelve months earlier, mainly in New York.