

Highlights
- The growing trend in prices and in the demand for housing continues.
- Stronger activity in mortgage lending.
- Negative contribution of the area to earnings continues to decline.
- Improved risk indicators.
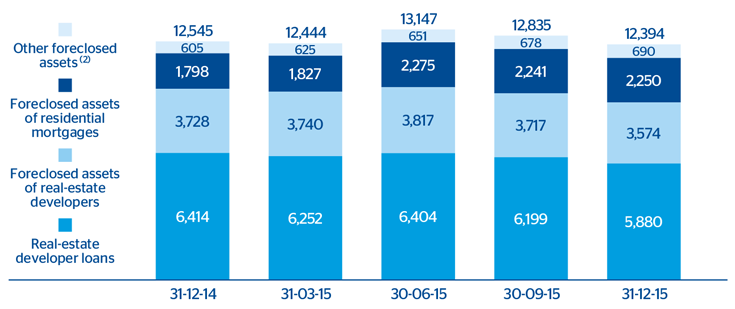
Net exposure to real estate (1)
(Million euros)
 Download Excel
|
|
Million of euros as of 31-12-15 | ||
|---|---|---|---|
| Coverage of real-estate exposure in Spain | Risk amount | Provision | % Coverage over risk |
| NPL + Substandard | 7,014 | 3,801 | 54 |
| NPL | 6,231 | 3,600 | 58 |
| Substandard | 783 | 201 | 26 |
| Foreclosed real-estate and other assets | 15,243 | 8,729 | 57 |
| From real-estate developers | 8,938 | 5,364 | 60 |
| From dwellings | 4,937 | 2,687 | 54 |
| Other | 1,368 | 678 | 50 |
| Subtotal | 22,257 | 12,530 | 56 |
| Performing | 2,667 |
|
|
| With collateral | 2,286 |
|
|
| Finished properties | 1,785 |
|
|
| Construction in progress | 263 |
|
|
| Land | 238 |
|
|
| Without collateral and other | 381 |
|
|
| Real-estate exposure | 24,924 | 12,530 | 50 |
Industry trends
In the second half of 2015, demand for residential real-estate continued to be supported by the positive fundamentals, particularly the increase in mortgage lending and the positive trend in employment. The reduction in the housing stock has boosted housing starts, in an environment of slightly rising prices. According to data from the third quarter of 2015, prices have increased, especially on the coast and in the large metropolitan areas.
The decline in the cost of finance has helped increase activity in the mortgage market. According to the cumulative figures from the Bank of Spain through November 2015, the volume of new loans granted to families to buy homes increased by 35.3% in year-on-year terms, with 15 consecutive months of growth.
The latest data published in the third quarter of 2015 by the National Institute for Statistics (INE) confirm that housing prices continue their positive trend. So far this year, with data through September, new homes have gained 4.4% in value and existing homes 4.3%.
Figures on construction activity show that housing starts are recovering strongly, although the starting point was low. Specifically, between January and October 2015, the number of construction permits granted was 29.2% up on the same period in 2014.
Exposure
BBVA continues with its strategy of reducing its net exposure to the real-estate sector in Spain. This includes both the developer segment (lending to real-estate developers plus foreclosed assets derived from these loans) and foreclosed real-estate assets from retail mortgage loans. As of 31-Dec-2015, exposure stood at €12,394m, a reduction of 1.2% since December 2014, despite the fact that 2014 figures did not include CX balances. Exposure was down 3.4% on the September figure.
In terms of total real-estate exposure, including outstanding loans to developers, foreclosed assets and other assets, the coverage ratio was 50% at the close of 2015.
Non-performing loans have fallen again over the quarter, with new additions to NPL declining over the period and recoveries progressing positively. The coverage ratio for non-performing and substandard loans remains at 54%.
Sales of real-estate assets in the fourth quarter have been affected by seasonal factors, especially in December, and numbered 3,734 units, or 7,437 including sales of developer assets on the balance sheet. In cumulative terms, this figure amounts to 21,082 units. Although it is a slight fall (9%) on 2014, profitability has risen.
Earnings
BBVA’s real-estate business in Spain registered a loss of €85m in the fourth quarter of 2015, a figure that improves on the loss of €265m in the same quarter in 2014, mainly due to the reduced need for loan-loss and real-estate provisions, as well as improved capital gains from sales. In cumulative terms, the area registered a loss of €492m (–€901m in the same period in 2014).
Financial statements
Download Excel
|
|
Million euros | ||
|---|---|---|---|
| Income statement | 2015 | Δ% | 2014 |
| Net interest income | 66 | n.s. | (38) |
| Net fees and commissions | 2 | (51,3) | 5 |
| Net trading income | 5 | n.m. | (2) |
| Other income/expenses | (89) | (51,7) | (184) |
| Gross income | (16) | (92,9) | (220) |
| Operating expenses | (135) | (11,9) | (153) |
| Personnel expenses | (66) | (18,8) | (81) |
| General and administrative expenses | (44) | (9,3) | (49) |
| Depreciation and amortization | (25) | 6,9 | (23) |
| Operating income | (150) | (59,7) | (373) |
| Impairment on financial assets (net) | (179) | (39,7) | (297) |
| Provisions (net) and other gains (losses) | (383) | (37,8) | (616) |
| Income before tax | (713) | (44,6) | (1.287) |
| Income tax | 221 | (42,1) | 382 |
| Net income | (491) | (45,7) | (904) |
| Non-controlling interests | (1) | n.m. | 3 |
| Net attributable profit | (492) | (45,4) | (901) |
Download Excel
|
|
Million euros | ||
|---|---|---|---|
| Balance sheet | 31-12-15 | Δ% | 31-12-14 |
| Cash and balances with central banks | 5 | (14.1) | 6 |
| Financial assets | 536 | 54.9 | 346 |
| Loans and receivables | 8,248 | (6.4) | 8,814 |
| Loans and advances to customers | 8,248 | (6.4) | 8,814 |
| Loans and advances to credit institutions and other | - | - | - |
| Inter-area positions | - | - | - |
| Tangible assets | 1,305 | (4.9) | 1,373 |
| Other assets | 7,215 | 5.7 | 6,826 |
| Total assets/liabilities and equity | 17,310 | (0.3) | 17,365 |
| Deposits from central banks and credit institutions | - | - | - |
| Deposits from customers | 145 | 174.6 | 53 |
| Debt certificates | - | - | - |
| Subordinated liabilities | 868 | (0.3) | 871 |
| Inter-area positions | 12,826 | (1.0) | 12,959 |
| Financial liabilities held for trading | - | - | - |
| Other liabilities | (0) | (70.0) | (0) |
| Economic capital allocated | 3,471 | (0.3) | 3,483 |