

Highlights
- Faster growth of banking activity.
- High capacity to generate recurring revenue.
- Cost affected by investment plans and high inflation in some countries.
- Risk indicators are stable.
Business activity
(Year-on-year change at constant exchange rates. Data as of 31-12-2015)

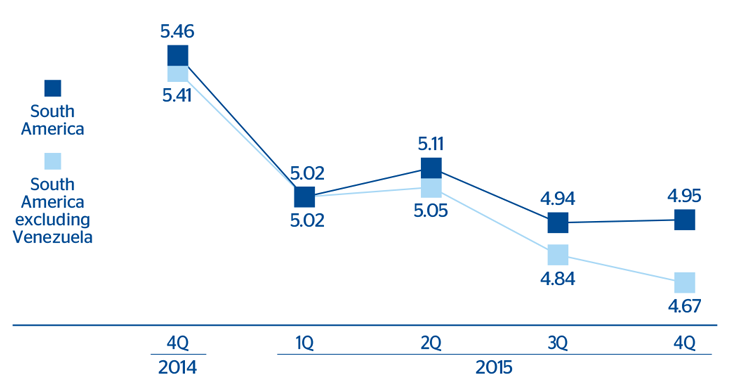
Net interest income/ATA
(Percentage. Constant exchange rate)
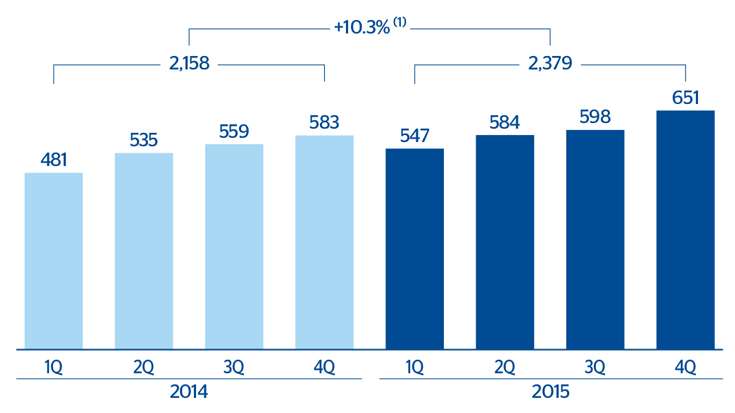
South America excluding Venezuela. Operating income
(Million euros at constant exchange rate)
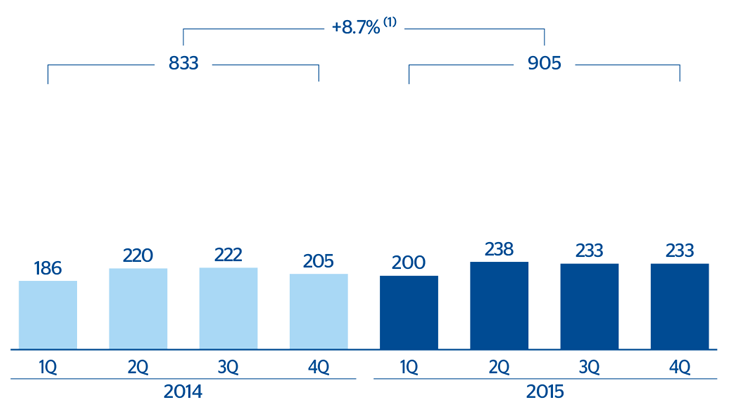
South America excluding Venezuela. Net attributable
(Million euros at constant exchange rate)
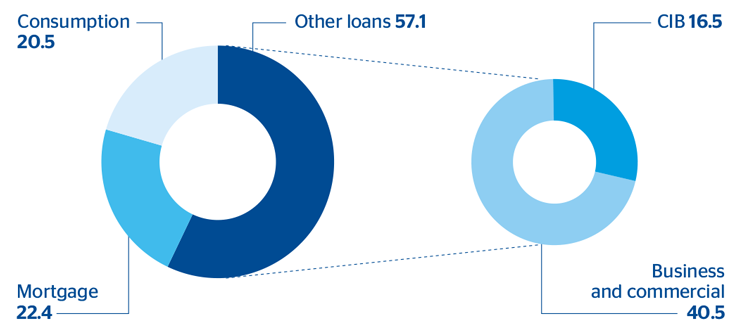
South America excluding Venezuela. Breakdown of loans and advances to customers (gross) excluding repos
(Percentage as of 31-12-2015)
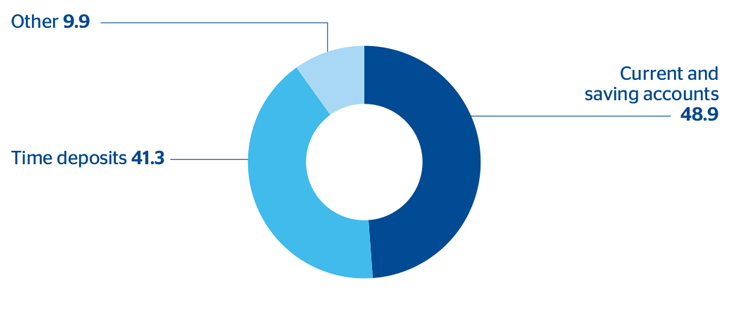
South America excluding Venezuela. Breakdown of customer deposits under management
(Percentage as of 31-12-2015)
Financial statements and relevant business indicators
 Download Excel
|
|
Million euros and percentage | ||||
|---|---|---|---|---|---|
|
|
South America | South America excluding Venezuela | |||
| Income statement | 2015 | 2015 | Δ% | Δ% (3) | 2014 |
| Net interest income | 3,202 | 3,044 | 9.8 | 9.7 | 2,774 |
| Net fees and commissions | 718 | 694 | 16.1 | 12.8 | 598 |
| Net trading income | 595 | 453 | 22.1 | 19.4 | 371 |
| Other income/expenses | (38) | 107 | 27.5 | 26.3 | 84 |
| Gross income | 4,477 | 4,299 | 12.3 | 11.5 | 3,827 |
| Operating expenses | (1,979) | (1,920) | 14.1 | 13.2 | (1,683) |
| Personnel expenses | (1,022) | (1,001) | 15.4 | 14.0 | (867) |
| General and administrative expenses | (853) | (823) | 12.7 | 12.3 | (730) |
| Depreciation and amortization | (104) | (96) | 11.8 | 11.6 | (86) |
| Operating income | 2,498 | 2,379 | 11.0 | 10.3 | 2,144 |
| Impairment on financial assets (net) | (614) | (598) | 25.5 | 26.4 | (477) |
| Provisions (net) and other gains (losses) | (71) | (37) | (67.8) | (69.3) | (114) |
| Income before tax | 1,814 | 1,745 | 12.3 | 11.4 | 1,554 |
| Income tax | (565) | (497) | 28.3 | 28.4 | (387) |
| Net income | 1,248 | 1,248 | 6.9 | 5.9 | 1,167 |
| Non-controlling interests | (343) | (343) | 4.5 | (0.8) | (328) |
| Net attributable profit | 905 | 905 | 7.9 | 8.7 | 838 |
Download Excel
|
|
Million euros and percentage | ||||
|---|---|---|---|---|---|
| Balance sheet | 31-12-15 | 31-12-15 | Δ% | Δ% (3) | 31-12-14 |
| Cash and balances with central banks | 11,447 | 11,107 | 43.1 | 57.5 | 7,761 |
| Financial assets | 9,561 | 9,354 | 4.9 | 16.1 | 8,914 |
| Loans and receivables | 47,284 | 46,120 | 6.0 | 16.5 | 43,529 |
| Loans and advances to customers | 43,596 | 42,787 | 5.0 | 15.5 | 40,742 |
| Loans and advances to credit institutions and other | 3,688 | 3,334 | 19.6 | 31.3 | 2,788 |
| Tangible assets | 718 | 664 | (3.5) | 10.1 | 688 |
| Other assets | 1,652 | 1,578 | 6.2 | 15.7 | 1,485 |
| Total assets/liabilities and equity | 70,661 | 68,823 | 10.3 | 21.5 | 62,377 |
| Deposits from central banks and credit institutions | 8,070 | 8,065 | 49.4 | 58.2 | 5,397 |
| Deposits from customers | 41,998 | 40,599 | 6.8 | 19.0 | 38,029 |
| Debt certificates | 4,806 | 4,806 | 2.8 | 8.3 | 4,677 |
| Subordinated liabilities | 1,994 | 1,994 | 20.2 | 28.6 | 1,658 |
| Financial liabilities held for trading | 3,342 | 3,342 | 26.2 | 35.6 | 2,648 |
| Other liabilities | 7,825 | 7,541 | (0.9) | 8.9 | 7,609 |
| Economic capital allocated | 2,626 | 2,478 | 5.0 | 20.5 | 2,359 |
Download Excel
|
|
Million euros and percentage | ||||
|---|---|---|---|---|---|
| Relevant business indicators | 31-12-15 | 31-12-15 | Δ% | Δ% (3) | 31-12-14 |
| Loans and advances to customers (gross) (2) | 44,970 | 44,140 | 5.2 | 15.7 | 41,966 |
| Customer deposits under management (3) | 42,032 | 40,642 | 6.1 | 18.3 | 38,287 |
| Off-balance sheet funds (4) | 9,729 | 9,729 | 14.9 | 12.6 | 8,470 |
| Efficiency ratio (%) | 44.2 | 44.7 |
|
|
44.0 |
| NPL ratio (%) | 2.3 | 2.3 |
|
|
2.2 |
| NPL coverage ratio (%) | 123 | 122 |
|
|
123 |
| Cost of risk (%) | 1.26 | 1.33 |
|
|
1.19 |
Macro and industry trends
Economic activity in South America continues its adjustment due mainly to a less favorable external environment: slowdown in China, greater financial volatility, interest rate hike in the United States and fall in the price of the main commodities exported by the region. Private domestic demand in the area is also less vigorous (both consumption and investment) in a situation where household and business confidence continues to decline.
Likewise, the depreciation of exchange rates, mainly in the first nine months of the year, has exerted upward pressure on inflation in most countries, forcing many central banks (including those in Chile, Colombia and Peru) to hike interest rates, despite the environment of economic slowdown.
The financial sector remains sound, with acceptable levels of capitalization, good profitability and NPL ratios in check. As regards banking activity, there has been a robust increase in lending, while deposits have performed strongly.
Activity
The rates of change indicated below refer to constant exchange rages, and do not include earnings and activity in Venezuela, unless expressly stated otherwise.
Gross lending to customers has maintained its positive performance throughout 2015, especially in the last quarter, when it increased its rate of growth to close the year with a balance of €44,140m, a year-on-year increase of 15.7%. Despite all portfolios performed very favorably, there has been a remarkable performance in consumer loans and credit cards (up 16.2% and 37.2% in year-on-year terms, respectively) and in corporate lending (up 17.3%).
In asset quality, the NPL ratio stands at 2.3%, a level very similar to the one registered at the end of the third quarter of 2015 and in 2014 (2.2%). The coverage ratio stood at 122% (125% as of 30-Sep-2015 and 123% at the close of 2014).
Customer deposits under management have continued to grow at a good pace, closing the year with a balance of €40,642m, a year-on-year increase of 18.3%. All the products have contributed positively to this growth, particularly current and savings accounts, which have increased year-on-year by 24.8% and led to the improved profitability of the mix, by increasing the weight of lower-cost deposits. Off-balance-sheet funds have also risen (12.6%), mainly due to the good performance of mutual funds in Argentina, Peru and Chile.
Earnings
South America closed 2015 with a net attributable profit of €905m, up 8.7% on the previous year. The main factors that explain the performance of the income statement in 2015 are:
- Year-on-year increase of 11.5% in gross income. This positive performance is due to the high capacity to generate recurring revenue, thanks to strong activity, the effort made to maintain spreads in a more complex setting than in previous years and the good performance of income from fees and commissions. Net interest income has grown by 9.7% over the year and income from fees and commissions by 12.8%. The variation in the exchange rate of the main currencies against the U.S. dollar has had a positive effect on the area’s NTI, which is up by 19.4%.
- Operating expenses show a year-on-year rate of change in line with the first nine months of 2015: 13.2%. The investments made in recent years, the high inflation in some countries and the effect of the depreciation of the region’s currencies against the U.S. dollar on dollar-denominated costs explain this trend.
- Impairment losses on financial assets rose in the last quarter, in line with stronger activity. Thus loan-loss provisions grew more year-on-year (up 26.4%) than lending volume, as a result, also, of moderation in the macroeconomic environment in the region.
By country, Argentina contributed €265m to the area’s income statement (up 16.5% year-on-year), with double-digit increases across all the lines (including expenses, in this case due to inflation), as a result of strong activity and loan-loss provisions growing at a slower pace than lending. Colombia generated €263m (up 12.2%), thanks to the good performance of net interest income and more moderate operating expenses. In Peru, although net interest income remains flat and impairment losses on financial assets are increasing significantly, the trend in income from fees and commissions and NTI has resulted in a net attributable profit of €184m (up 1.9%) at the end of 2015. In Chile, the trend in income from fees and commissions, NTI and other income/expenses has offset weaker net interest income, so the country has registered a net attributable profit of €151m (up 6.3%).
Download Excel
|
|
Million euros | |||||||||
|---|---|---|---|---|---|---|---|---|---|---|
|
|
Argentina | Chile | Colombia | Peru | Venezuela | |||||
| South America. Relevant business indicators per country | 31-12-15 | 31-12-14 | 31-12-15 | 31-12-14 | 31-12-15 | 31-12-14 | 31-12-15 | 31-12-14 | 31-12-15 | 31-12-14 |
| Loans and advances to customers (gross) (1, 2) | 4,062 | 2,973 | 12,799 | 11,794 | 10,858 | 9,181 | 13,332 | 11,713 | 830 | 339 |
| Customer deposits under management (1, 3) | 5,339 | 3,578 | 8,794 | 8,298 | 10,366 | 9,339 | 12,149 | 9,932 | 1,391 | 569 |
| Off-balance sheet funds (1, 4) | 621 | 476 | 1,329 | 1,227 | 531 | 568 | 1,311 | 1,208 | - | - |
| Efficiency ratio (%) | 51.3 | 47.5 | 47.0 | 47.3 | 38.9 | 41.4 | 34.9 | 34.9 | 33.3 | 46.4 |
| NPL ratio (%) | 0.6 | 0.9 | 2.3 | 2.4 | 2.3 | 2.2 | 2.8 | 2.6 | 0.6 | 1.4 |
| NPL coverage ratio (%) | 517 | 366 | 72 | 72 | 137 | 140 | 124 | 128 | 457 | 247 |
| Cost of risk (%) | 1.52 | 1.48 | 1.05 | 0.87 | 1.55 | 1.46 | 1.40 | 1.30 | 0.43 | 2.71 |
Download Excel
|
|
Million euros | |||||||
|---|---|---|---|---|---|---|---|---|
|
|
Operating income | Net attributable profit | ||||||
| South America. Data per country | 2015 | Δ% | Δ% at constant exchange rates |
2014 | 2015 | Δ% | Δ% at constant exchange rates |
2014 |
| Country |
|
|
|
|
|
|
|
|
| Argentina | 623 | 19.0 | 13.3 | 523 | 265 | 22.4 | 16.5 | 217 |
| Chile | 374 | 11.0 | 6.5 | 337 | 151 | 10.8 | 6.3 | 136 |
| Colombia | 554 | (1.0) | 13.8 | 560 | 263 | (2.3) | 12.2 | 269 |
| Peru | 734 | 12.6 | 5.6 | 652 | 184 | 8.7 | 1.9 | 169 |
| Venezuela | 119 | (83.8) | n.m. | 731 | 1 | (99.6) | (87.9) | 162 |
| Other countries (1) | 94 | 30.0 | 26.1 | 72 | 42 | (11.0) | (13.2) | 47 |
| Total | 2,498 | (13.1) | 14.6 | 2,875 | 905 | (9.6) | 8.1 | 1,001 |