
Group financial information
BBVA Group highlights
BBVA GROUP HIGHLIGHTS (CONSOLIDATED FIGURES)
| IFRS 9 | IAS 39 | |||
|---|---|---|---|---|
| 31-12-19 | ∆% | 31-12-18 | 31-12-17 | |
| Balance sheet (millions of euros) | ||||
| Total assets | 698,690 | 3.3 | 676,689 | 690,059 |
| Loans and advances to customers (gross) | 394,763 | 2.2 | 386,225 | 400,369 |
| Deposits from customers | 384,219 | 2.2 | 375,970 | 376,379 |
| Total customer funds | 492,022 | 3.8 | 474,120 | 473,088 |
| Total equity | 54,925 | 3.9 | 52,874 | 53,323 |
| Income statement (millions of euros) | ||||
| Net interest income | 18,202 | 3.5 | 17,591 | 17,758 |
| Gross income | 24,542 | 3.3 | 23,747 | 25,270 |
| Operating income | 12,639 | 4.9 | 12,045 | 12,770 |
| Net attributable profit | 3,512 | (35.0) | 5,400 | 3,514 |
| The BBVA share and share performance ratios | ||||
| Number of shares (million) | 6,668 | - | 6,668 | 6,668 |
| Share price (euros) | 4.98 | 7.5 | 4.64 | 7.11 |
| Earning per share (euros) (1)(2) | 0.66 | 3.4 | 0.64 | 0.63 |
| Book value per share (euros) | 7.32 | 2.8 | 7.12 | 6.96 |
| Tangible book value per share (euros) | 6.27 | 7.1 | 5.86 | 5.69 |
| Market capitalization (millions of euros) | 33,226 | 7.5 | 30,909 | 47,422 |
| Yield (dividend/price; %) | 5.2 | 5.4 | 4.2 | |
| Significant ratios (%) | ||||
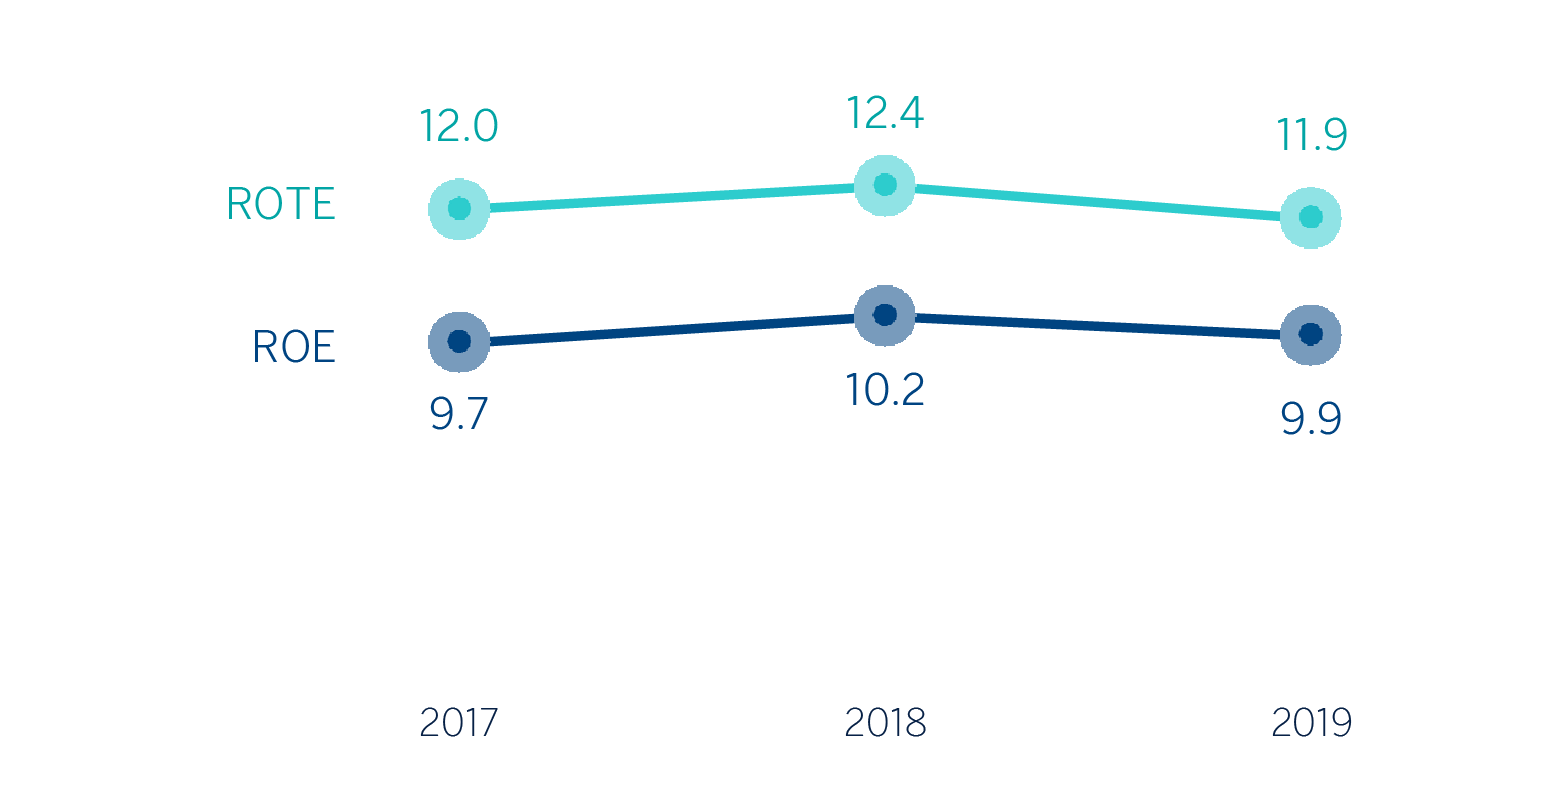
| ROE (Adjusted net attributable profit/average shareholders' funds +/- average accumulated other comprehensive income) (2) | 9.9 | 10.2 | 9.7 | |
| ROTE (Adjusted net attributable profit/average shareholders' funds excluding average intangible assets +/- average accumulated other comprehensive income) (2) | 11.9 | 12.4 | 12.0 | |
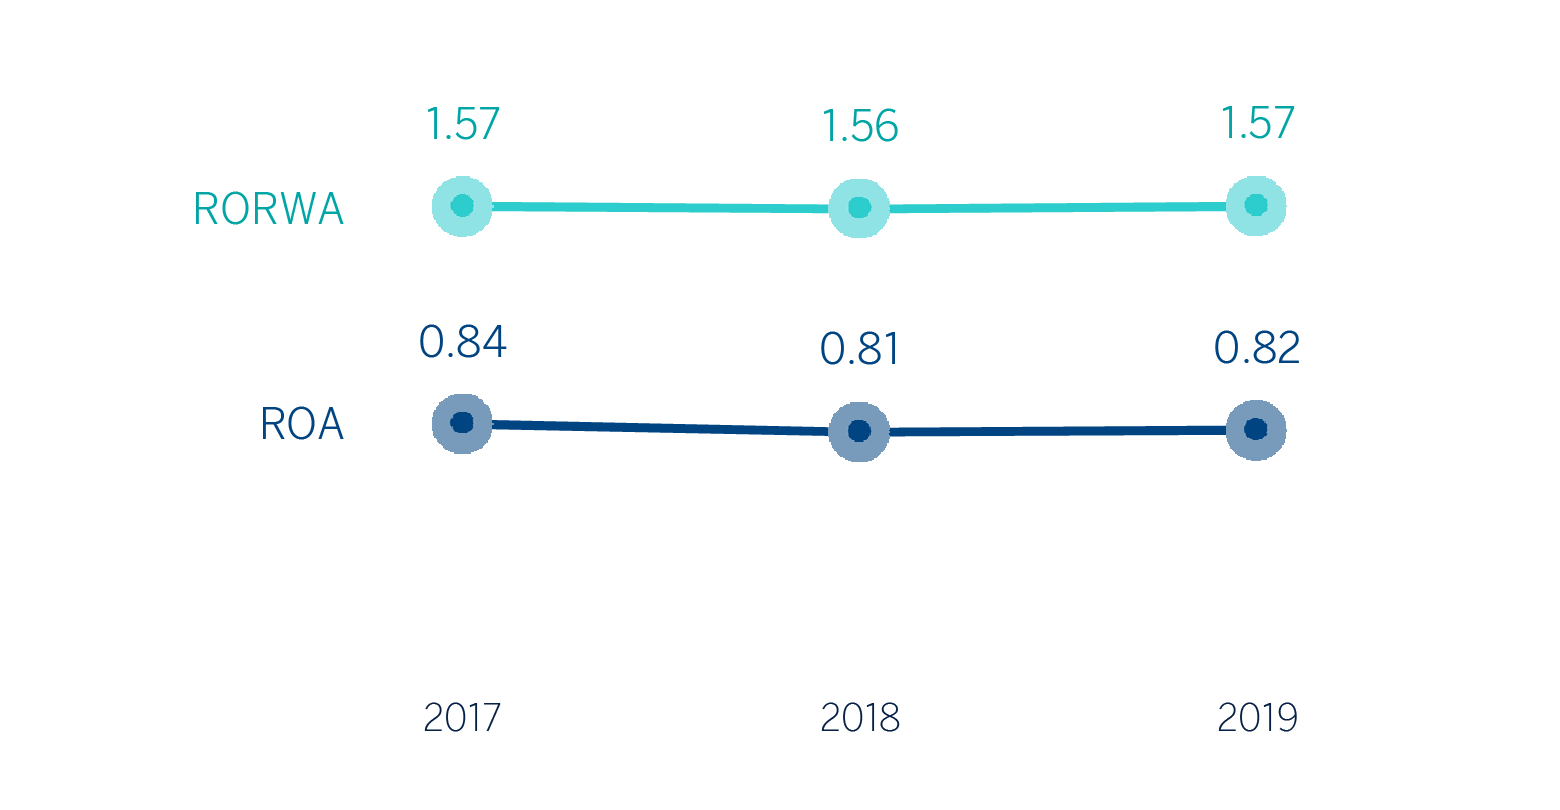
| ROA (Adjusted profit or loss for the year/average total assets(2) | 0.82 | 0.81 | 0.84 | |
| RORWA (Adjusted profit or loss for the year/average risk-weighted assets - RWA)(2) | 1.57 | 1.56 | 1.57 | |
| Efficiency ratio | 48.5 | 49.3 | 49.5 | |
| Cost of risk | 1.04 | 1.01 | 0.89 | |
| NPL ratio | 3.8 | 3.9 | 4.6 | |
| NPL coverage ratio | 77 | 73 | 65 | |
| Capital adequacy ratios (%) | ||||
| CET1 fully-loaded | 11.74 | 11.34 | 11.08 | |
| CET1 phased-in (3) | 11.98 | 11.58 | 11.71 | |
| Total ratio phase-in(3) | 15.92 | 15.71 | 15.51 | |
| Other information | ||||
| Number of clients (million) | 78.1 | 4.4 | 74.8 | 72.8 |
| Number of shareholders | 874,148 | (3.2) | 902,708 | 891,453 |
| Number of employees | 126,973 | 1.1 | 125,627 | 131,856 |
| Number of branches | 7,744 | (2.8) | 7,963 | 8,271 |
| Number of ATMs | 32,658 | 0.5 | 32,502 | 32,327 |
- General note: as a result of the amendment to IAS 12 "Income Taxes", and in order to make the information comparable, the 2018 and 2017 income statements have been restated.
- (1) Adjusted by additional Tier 1 instrument remuneration.
- (2) Excluding the goodwill impairment in the United States in 2019, BBVA Chile in 2018 and Telefónica impairment in 2017.
- (3) Phased-in ratios include the temporary treatment on the impact of IFRS 9, calculated in accordance with Article 473 bis of the Capital Requirements Regulation (CRR).
Significant ratios including the goodwill impairment in the United States in 2019, BBVA Chile in 2018 and the Telefónica impairment in 2017 (%)
| 31-12-19 | ∆% | 31-12-18 | 31-12-17 | |
|---|---|---|---|---|
| Earning per share (euros) (1) | 0.47 | (37.7) | 0.75 | 0.46 |
| ROE (net attributable profit/average shareholders' funds +/- average accumulated other comprehensive income) (2) | 7.2 | 11.7 | 7.4 | |
| ROTE (net attributable profit/average shareholders' funds excluding average intangible assets +/- average accumulated other comprehensive income) (2) | 8.6 | 14.3 | 9.1 | |
| ROA (Profit or loss for the year/average total assets) | 0.63 | 0.92 | 0.68 | |
| RORWA (Profit or loss for the year/average risk-weighted assets - RWA) | 1.20 | 1.76 | 1.27 |
(1) Adjusted by additional Tier 1 instrument remuneration.
(2) The ROE and ROTE ratios include, in the denominator, the Group’s average shareholders’ funds and take into account the item called “Accumulated other comprehensive income”, which forms part of the equity. Excluding this item, the ROE would stand at 6.3%, in 2019; 10.2%, in 2018; and 6.7%, in 2017; and the ROTE at 7.4%, 12.1% and 8.0%, respectively.
Relevant events
Results
- Generalized increase of recurring revenue items (net interest income plus net fees and commissions), which, in constant terms, grow in all business areas.
- Higher contribution from the NTI, which compensates the lower contribution of the other operating income and expenses line.
- Contained growth in the operating expenses and improvement of the efficiency ratio.
- Impairment on financial assets increased 4.3% year-on-year, mainly as a result of higher loan-loss provisions in the United States.
- Following the annual evaluation of its goodwills, BBVA has recorded a goodwill impairment in the United States of €1,318m, mainly due to the evolution of interest rates in the country and the slowdown in the economy. This impact does not affect the tangible net equity, the capital, or the liquidity of BBVA Group and is included in the Corporate Center in the line of other gains (losses) of the income statement.
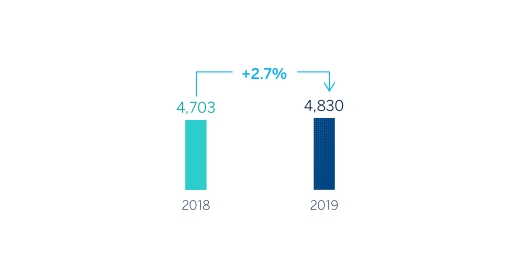
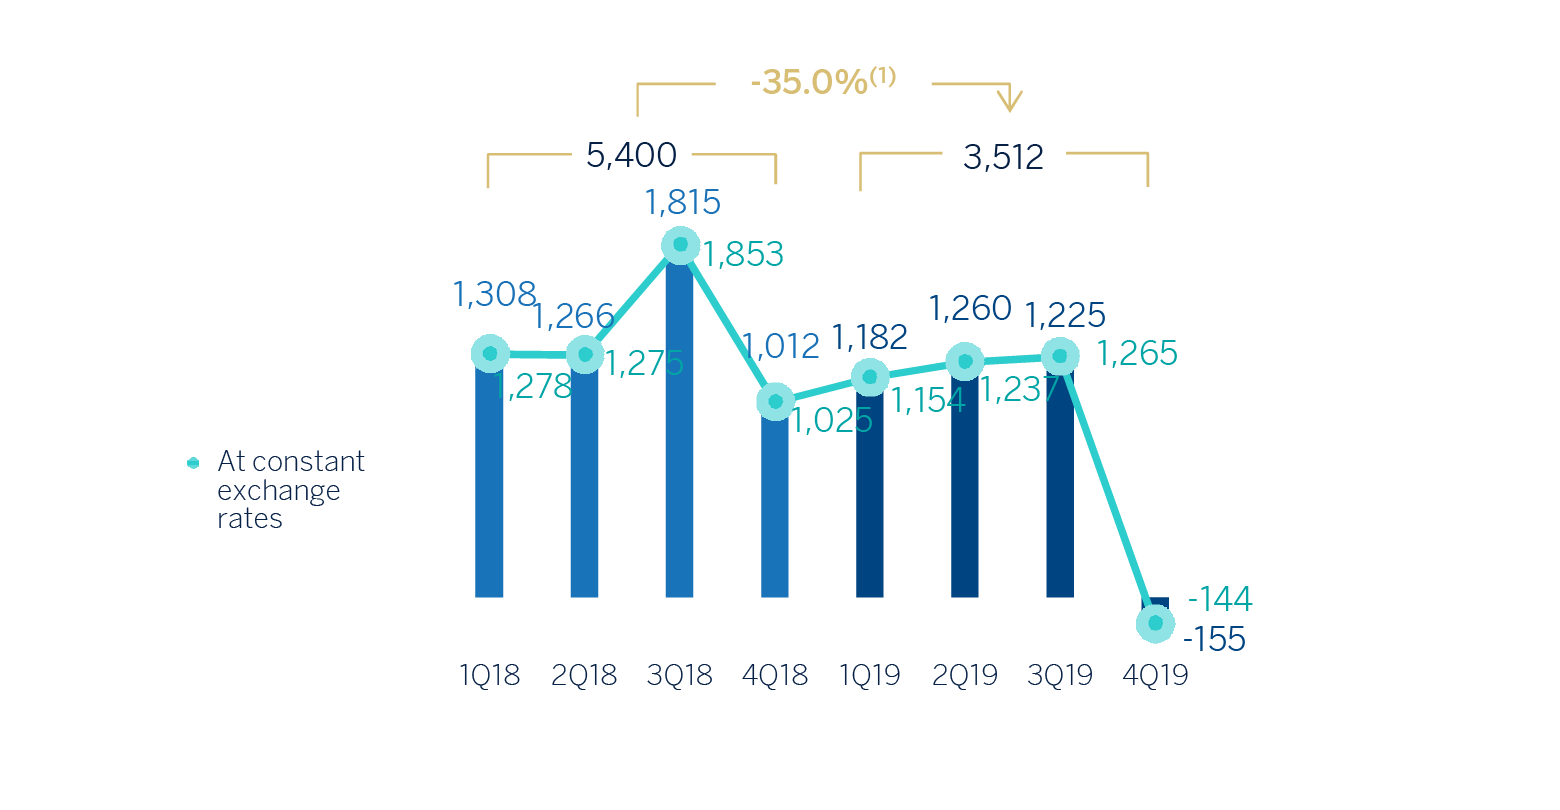
- In 2019, the net attributed profit stood at €3,512m, 35.0% less than in 2018. If BBVA Chile (the results contributed up to its sale and the capital gains generated by the operation) and the goodwill impairment in the United States are excluded from the year-on-year comparison, the Group's net attributable profit grew by 2.7% compared to 2018.
NET ATTRIBUTABLE PROFIT (1)(MILLIONS OF EUROS)
(1) Excluding BBVA Chile in 2018 and the goodwill impairment in the United States in 2019.
NET ATTRIBUTABLE PROFIT BREAKDOWN (1) (PERCENTAGE. 2019)
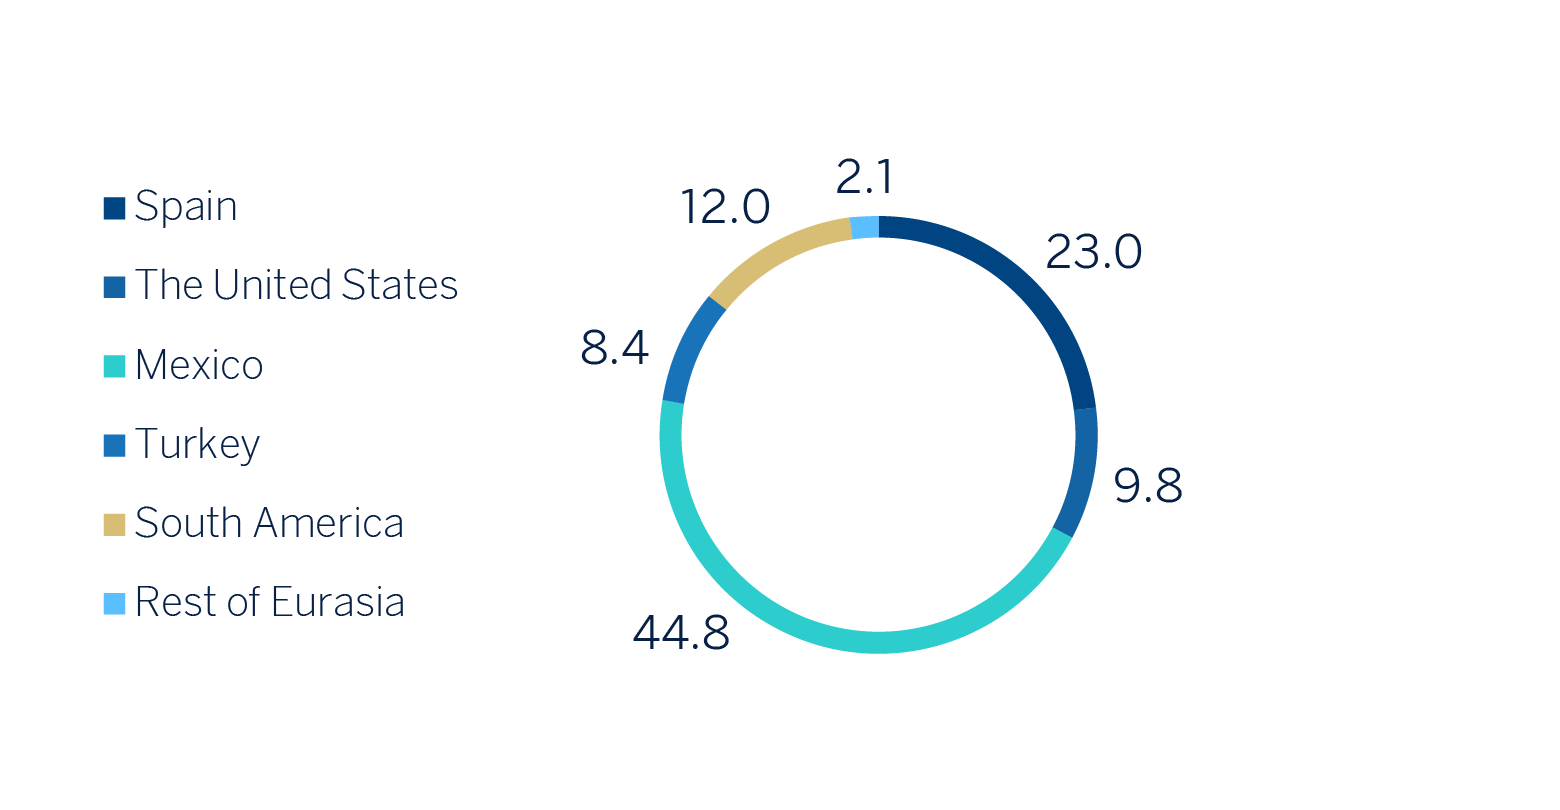
(2) Excludes the Corporate Center.
Balance sheet and business activity
- The number of loans and advances to customers (gross) registered a growth of 2.2% during 2019, with increases in the business areas of Mexico, and to a lesser extent, in the United States, South America and Rest of Eurasia.
- Good performance of customer funds (up 3.8% year-on-year) thanks to the evolution of demand deposits, mutual funds and pension funds.
Solvency
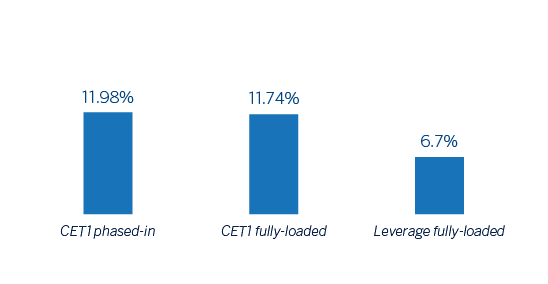
- As a result of the supervisory review and evaluation process (SREP) carried out by the European Central Bank (ECB), BBVA received a communication on December 4, that it is required to maintain, on a consolidated basis and as of January 1, 2020, a CET1 capital ratio of 9.27% and a total capital ratio of 12.77%. On December 31, 2019, the fully-loaded CET1 ratio stood at 11.74%, up 51 basis points in the year (excluding the impact of IFRS 16 standard’s implementation). Thus, BBVA's capital adequacy ratios at the end of 2019 remained above the regulatory requirements applicable as of January 1, 2020.
CAPITAL AND LEVERAGE RATIOS (PERCENTAGE AS OF 31-12-19)
Risk management
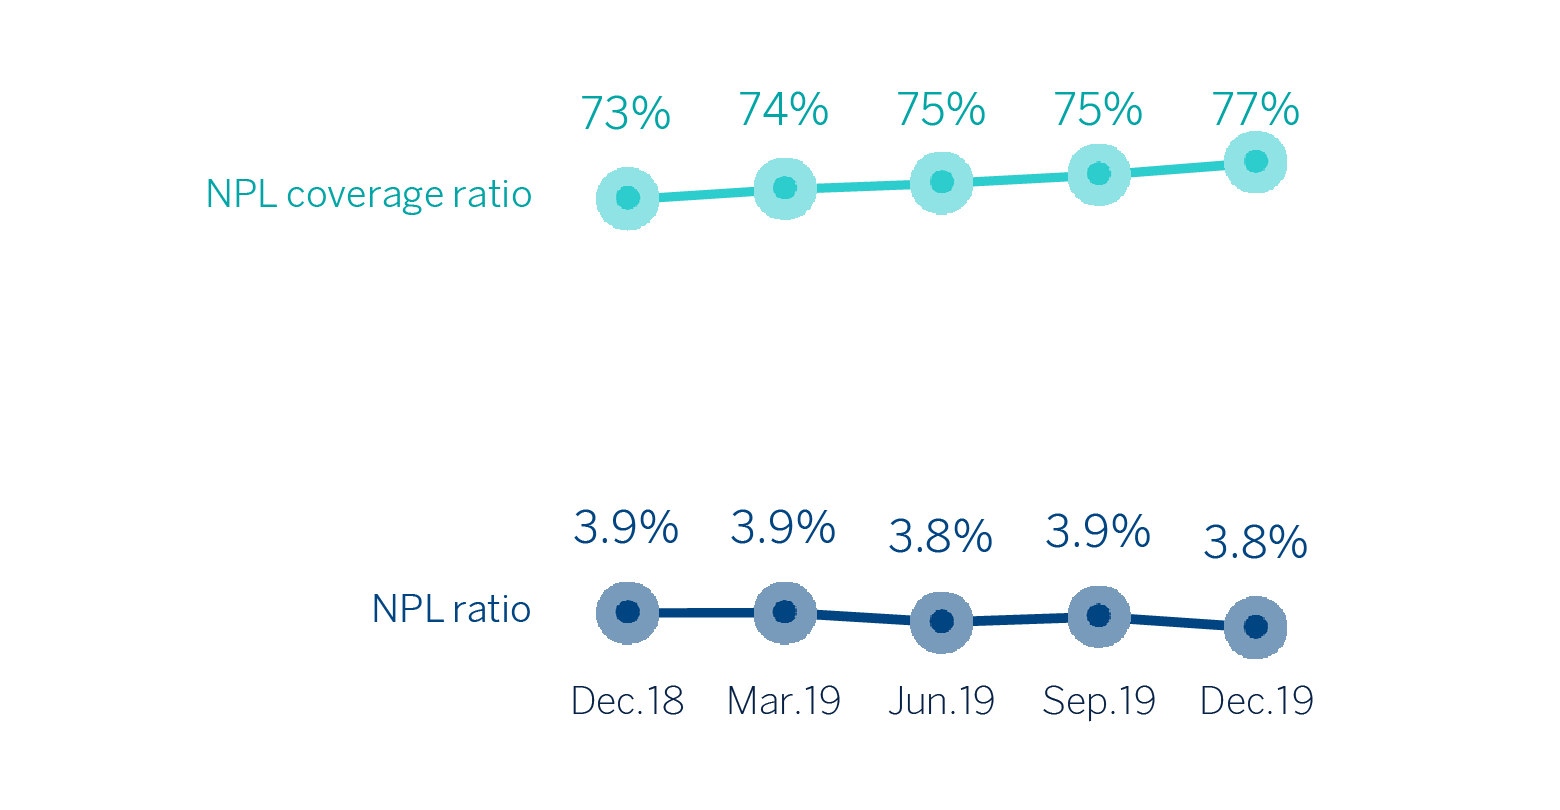
- Positive performance of the risk metrics. Non-performing loans showed a downward trend similar to previous years. The NPL ratio stood at 3.8%, the NPL coverage ratio at 77% and the cost of risk at 1.04%.
NPL AND NPL COVERAGE RATIOS (PERCENTAGE)
Transformation
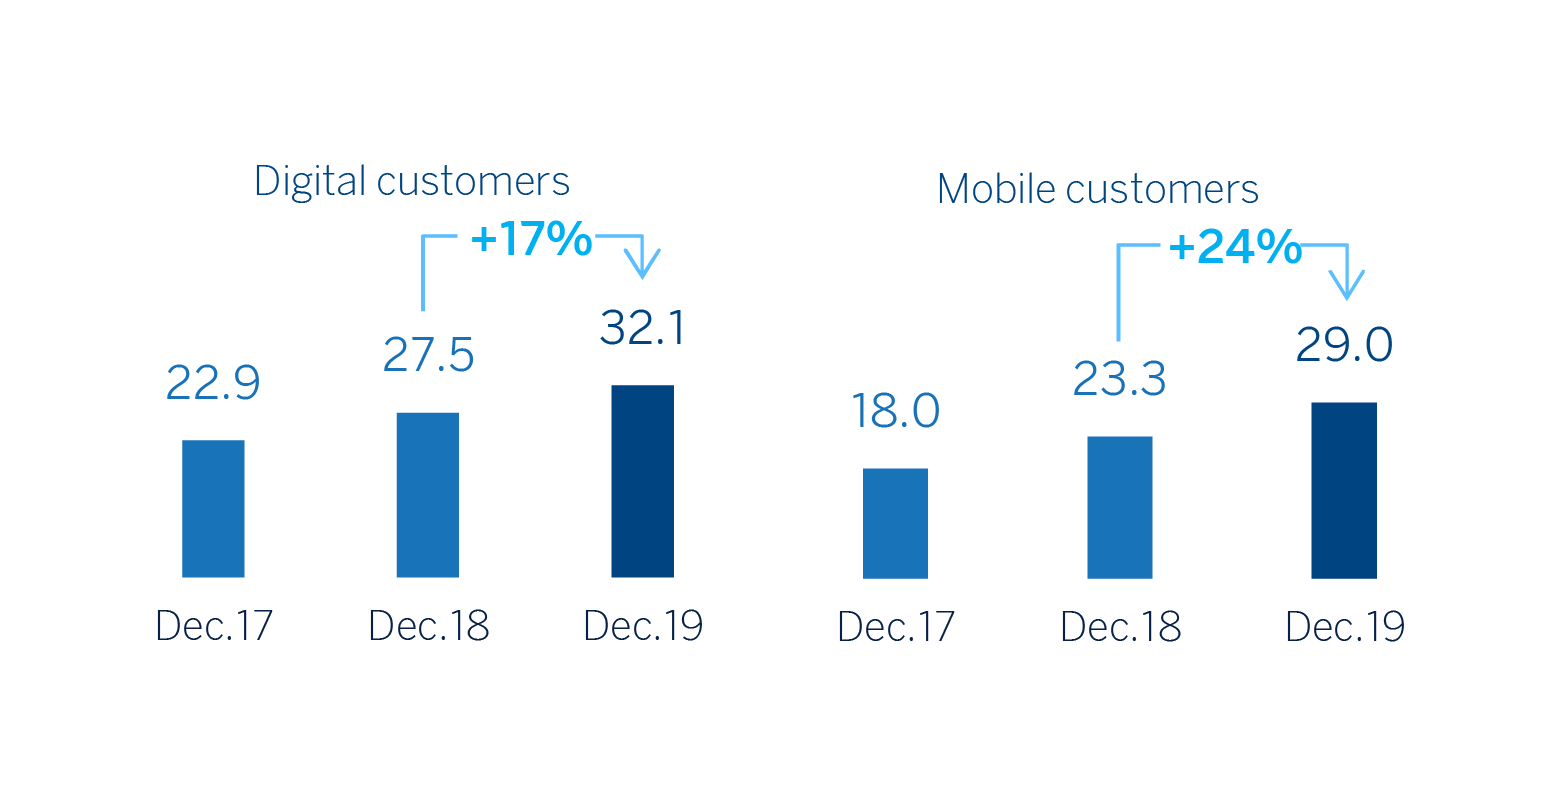
- The Group's digital and mobile customer base continues to grow, with more than 50% of customers operating through mobile channels. Digital sales also evolved positively in 2019.
DIGITAL AND MOBILE CUSTOMERS (MILLIONS)
Other matters of interest
- During the 2019 financial year, two restatements of consolidated information were made:
- As a result of the implementation of IAS 29 "Financial information in hyperinflationary economies," and in order to make the 2019 information comparable to that of 2018, the balance sheets, the income statements and ratios for the Group's first three quarters of the 2018 financial year and the South American business area, were restated to reflect the impacts of hyperinflation in Argentina in the quarter in which they were generated. This impact was recorded for the first time in the third quarter of 2018, but with accounting effects as of January 1, 2018.
- The amendment to IAS 12 "Income Tax" has meant that the tax impact of the distribution of generated benefits must be recorded in the "Expense or income for taxes on the profits of the continuing activities" of the consolidated income statement for the year, when previously recorded as "Net equity". So, in order for the information to be comparable, the information for the years shown above has been restated in such a way that a payment of €76m and a charge of €5m have been recorded in the consolidated profit and loss accounts for the years 2018 and 2017, respectively, against "Less: Interim dividends." This reclassification has no impact on the consolidated net assets.
- On August 7, 2019, BBVA reached an agreement with Banco GNB Paraguay S.A., for the sale of its stake in Banco Bilbao Vizcaya Argentaria Paraguay, S.A. (hereinafter BBVA Paraguay), which amounts to 100% of its share capital. As a result of the above, all items in BBVA Paraguay's balance sheet have been reclassified into the category of “Non-current assets (liabilities) and disposal groups held for sale”(hereinafter NCA&L).
- On January 1, 2019, IFRS 16 “Leases” entered into force, which requires the lessee to recognize the assets and liabilities arising from the rights and obligations of lease agreements. The main impacts are the recognition of an asset through the right of use and a liability based on future payment obligations. The impact of the first implementation was €3,419m and €3,472m, respectively, resulting in a decrease of 11 basis points of the CET1 capital ratio.
Results
The BBVA Group generated a net attributable profit of €3,512m in 2019. The good performance of the most recurrent revenue (net interest income plus net commissions and fees) and the net trading income (NTI), were offset by a greater adjustment for hyperinflation in Argentina, reflected in the line of other operating income and expenses, a greater amount of impairment on financial assets, greater provisions and, in particular, the goodwill impairment in the United States in December 2019 for an amount of €1,318m, reflected in the line of other gains (losses). The comparison with the previous year (down 35.0%) is influenced, on the one hand, by the above-mentioned goodwill impairment in the United States and on the other, by the positive impact generated by the capital gains (net of taxes) from the sale of BBVA Chile in 2018. In a more homogeneous comparison, without taking into account these two impacts and excluding the profit generated by BBVA Chile until its sale, the net attributable profit from 2019 was 2.7% higher than the previous year (up 2.0% at constant exchange rates).
CONSOLIDATED INCOME STATEMENT: QUARTERLY EVOLUTION (MILLIONS OF EUROS)
| 2019 | 2018 | |||||||
|---|---|---|---|---|---|---|---|---|
| 4Q | 3Q | 2Q | 1Q | 4Q | 3Q | 2Q | 1Q | |
| Net interest income | 4,727 | 4,488 | 4,566 | 4,420 | 4,692 | 4,309 | 4,302 | 4,287 |
| Net fees and commissions | 1,290 | 1,273 | 1,256 | 1,214 | 1,226 | 1,173 | 1,244 | 1,236 |
| Net trading income | 490 | 351 | 116 | 426 | 316 | 212 | 285 | 410 |
| Other operating income and expenses | (89) | 22 | (18) | 8 | (83) | 38 | 6 | 92 |
| Gross income | 6,418 | 6,135 | 5,920 | 6,069 | 6,151 | 5,733 | 5,838 | 6,026 |
| Operating expenses | (3,082) | (2,946) | (2,952) | (2,922) | (2,981) | (2,825) | (2,921) | (2,975) |
| Personnel expenses | (1,637) | (1,572) | (1,578) | (1,553) | (1,557) | (1,459) | (1,539) | (1,565) |
| Other administrative expenses | (1,039) | (971) | (976) | (977) | (1,119) | (1,062) | (1,087) | (1,106) |
| Depreciation | (406) | (403) | (398) | (392) | (305) | (304) | (295) | (304) |
| Operating income | 3,335 | 3,189 | 2,968 | 3,147 | 3,170 | 2,908 | 2,917 | 3,050 |
| Impairment on financial assets not measured at fair value through profit or loss | (1,187) | (1,187) | (753) | (1,023) | (1,353) | (1,023) | (783) | (823) |
| Provisions or reversal of provisions | (243) | (113) | (117) | (144) | (66) | (123) | (85) | (99) |
| Other gains (losses) | (1,444) | (4) | (3) | (22) | (183) | 831 | 67 | 41 |
| Profit/(loss) before tax | 460 | 1,886 | 2,095 | 1,957 | 1,568 | 2,593 | 2,116 | 2,170 |
| Income tax | (430) | (488) | (595) | (541) | (411) | (624) | (585) | (599) |
| Profit/(loss) for the year | 31 | 1,398 | 1,500 | 1,416 | 1,157 | 1,969 | 1,531 | 1,570 |
| Non-controlling interests | (186) | (173) | (241) | (234) | (145) | (154) | (265) | (262) |
| Net attributable profit | (155) | 1,225 | 1,260 | 1,182 | 1,012 | 1,815 | 1,266 | 1,308 |
| Earning per share (euros) (1) | (0.04) | 0.17 | 0.17 | 0.16 | 0.14 | 0.26 | 0.17 | 0.18 |
| Of which: | ||||||||
| Goodwill impairment in the United States | (1,318) | |||||||
| BBVA Chile (2) | 633 | 35 | 29 | |||||
| Net attributable profit excluding the goodwill impairment in the United States and BBVA Chile | 1,163 | 1,225 | 1,260 | 1,182 | 1,012 | 1,182 | 1,231 | 1,279 |
| Earning per share excluding the goodwil impairment in the United States and BBVA Chile (euros) (1) | 0.16 | 0.17 | 0.17 | 0.16 | 0.14 | 0.16 | 0.17 | 0.17 |
- General note: the application of accounting for hyperinflation in Argentina was done for the first time in September 2018 with accounting effects from January 1, 2018, recording the impact of the 9 months in the third quarter. In addition, during 2019 an amendment to IAS 12 "Income Taxes" was introduced with accounting effects from January 1, 2019. Therefore, in order to make the information comparable, the quarterly income statements for 2019 and 2018 have been restated.
- (1) Adjusted by additional Tier 1 instrument remuneration.
- (2) Earnings generated by BBVA Chile until its sale on July 6, 2018 and the capital gains from the operation.
CONSOLIDATED INCOME STATEMENT (MILLIONS OF EUROS)
| ∆ % at constant | ||||
|---|---|---|---|---|
| 2019 | ∆% | exchange rates | 2018 | |
| Net interest income | 18,202 | 3.5 | 4.3 | 17,591 |
| Net fees and commissions | 5,033 | 3.2 | 3.6 | 4,879 |
| Net trading income | 1,383 | 13.1 | 15.4 | 1,223 |
| Other operating income and expenses | (77) | n.s. | n.s. | 54 |
| Gross income | 24,542 | 3.3 | 4.2 | 23,747 |
| Operating expenses | (11,702) | 1.7 | 2.2 | (11,702) |
| Personnel expenses | (6,340) | 3.6 | 4.2 | (6,120) |
| Other administrative expenses | (3,963) | (9.4) | (8.9) | (4,374) |
| Depreciation | (1,599) | 32.4 | 32.1 | (1,208) |
| Operating income | 12,639 | 4.9 | 6.1 | 12,045 |
| Impairment on financial assets not measured at fair value through profit or loss | (4,151) | 4.3 | 6.0 | (3,981 |
| Provisions or reversal of provisions | (617) | (65.3) | (66.7) | (373) |
| Other gains (losses) | (1,473) | n.s. | n.s. | 755 |
| Profit/(loss) before tax | 6,398 | (24.2) | (23.8) | 8,446 |
| Income tax (1) | (2,053) | (7.5) | (7.4) | (2,219) |
| Profit/(loss) for the year (1) | 4,345 | (30.2) | (29.7) | 6,227 |
| Non-controlling interests | (833) | 0.8 | 11.6 | (827) |
| Net attributable profit (1) | 3,512 | (35.0) | (35.3) | 5,400 |
| Earning per share (euros) (2) | 0.47 | 0.75 | ||
| Of which: | ||||
| Goodwill impairment in the United States | (1,318) | |||
| BBVA Chile (3) | 697 | |||
| Net attributable profit excluding the goodwill impairment in the United States and BBVA Chile | 4,830 | 2.7 | 2.0 | 4,703 |
| Earning per share excluding the goodwill impairment in the United States and BBVA Chile (euros) (2) | 0.66 | 0.64 | ||
- (1) As a result of the amendment to IAS 12 "Income Taxes", and in order to make the information comparable, the 2018 income statement has been restated.
- (2) Adjusted by additional Tier 1 instrument remuneration.
- (3) Earnings generated by BBVA Chile until its sale on July 6, 2018 and the capital gains from the operation.
Unless expressly stated otherwise, for a better understanding of the evolution of the main items in the Group's income statement, the variation rates shown below are reported at constant exchange rates and the quarterly changes are from the last quarter of the year with respect to the previous quarter.
Gross income
Gross income showed a year-on-year growth of 4.2%, supported by the favorable performance of the net interest income and the NTI and, to a lesser extent, the growth in net fees and commissions.
GROSS INCOME (MILLIONS OF EUROS)
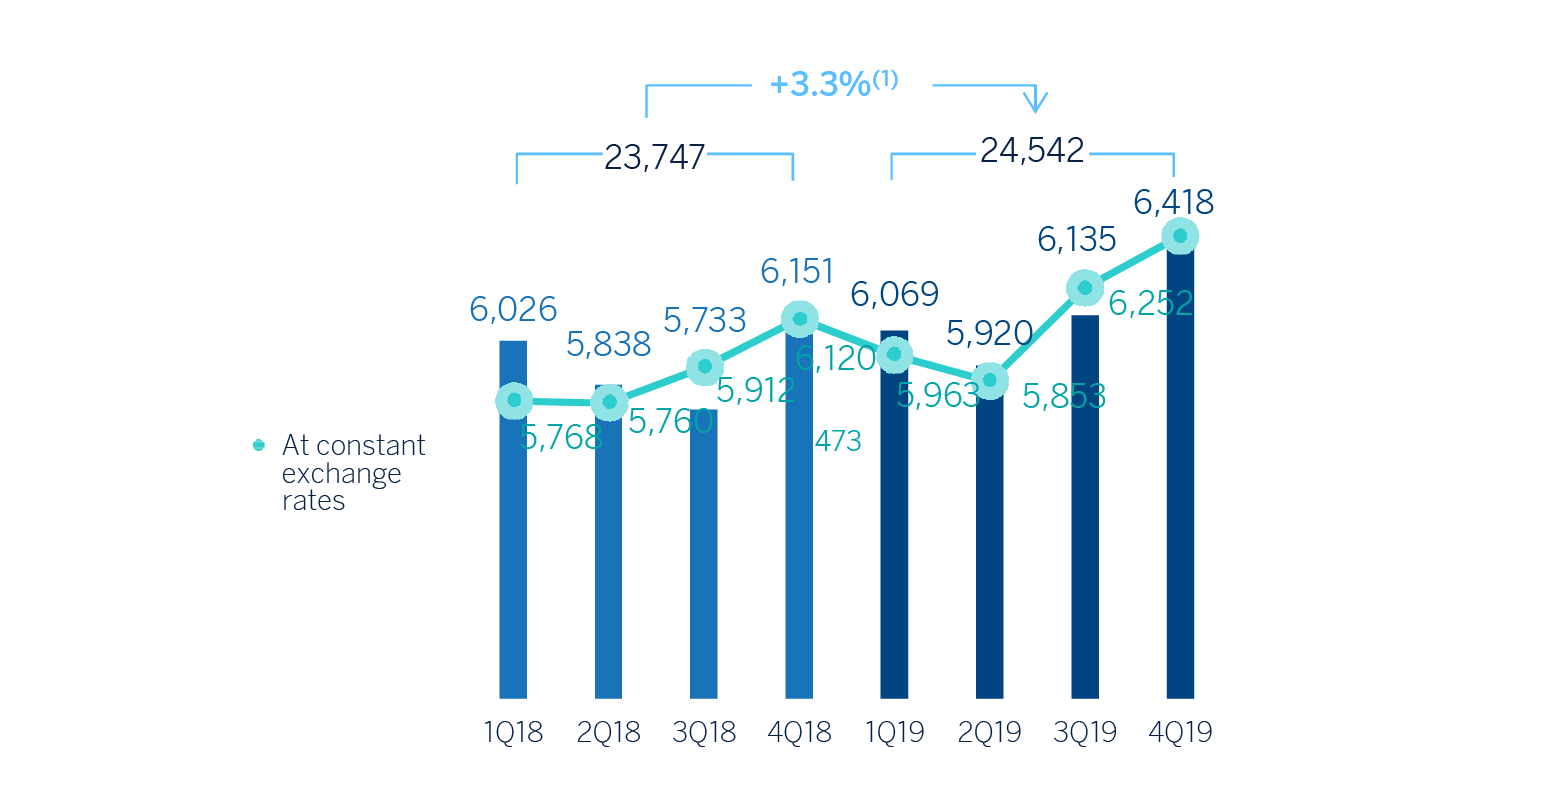
(1) At constant exchange rates: +4.2%.
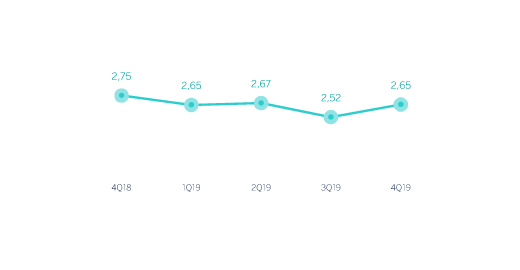
Net interest income grew by 4.3% year-on-year and 4.4% compared to the previous quarter. By business areas, Mexico and South America had notable year-on-year performance.
Net fees and commissions also recorded a positive performance showing a year-on-year growth of 3.6%, thanks to the favorable contribution from all the business areas, in particular Turkey and Spain. In the fourth quarter, they grew by 0.7%.
As a result, the most recurrent revenue items increased by a 4.1% year-on-year (up 3.6% in the quarter).
NET INTEREST INCOME/ATAS (PERCENTAGE)
NET INTEREST INCOME PLUS NET FEES AND COMMISSIONS (MILLIONS OF EUROS)
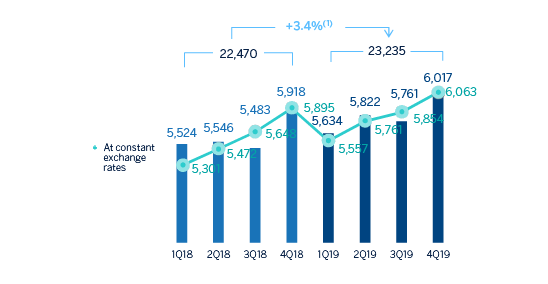
(1) At constant exchange rates: +4.1%.
NTI closed with an increase of 15.4% year-on-year and registered an excellent evolution in the last quarter of the year (up 31.8%) mainly explained by the results generated by Spain and Turkey.
The line of other operating income and expenses closed the year with a negative balance of €77m compared to the positive balance of €54m recorded in 2018, mainly due to the higher adjustment for hyperinflation in Argentina, as well as a greater contribution to the SRF (Single Resolution Fund) and the FGD (Deposit Guarantee Fund).
Operating income
Operating expenses increased 2.2% in 2019 (up 1.7% at current exchange rates) showing a lower growth compared to inflation in most of the countries where BBVA is present. Spain continued to show notable reduction in costs, resulting from the cost control plans.
OPERATING EXPENSES (MILLIONS OF EUROS)
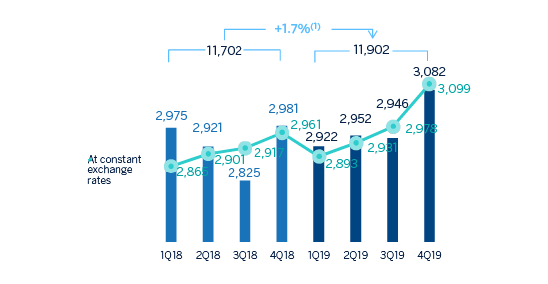
(1) At constant exchange rates: +2.2%.
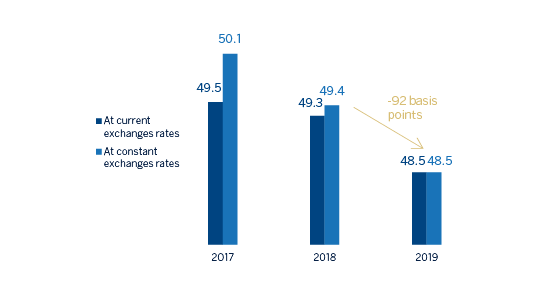
The efficiency continued to improve as a result of operating expenses growing below gross income, which stood at 48.5% at the end of the year, significantly below the level reached in 2018 (down 92 basis points at constant exchange rates). As a result of the aforementioned, the operating income registered a year-on-year growth of 6.1%.
EFFICIENCY RATIO (PERCENTAGE)
OPERATING INCOME (MILLIONS OF EUROS)
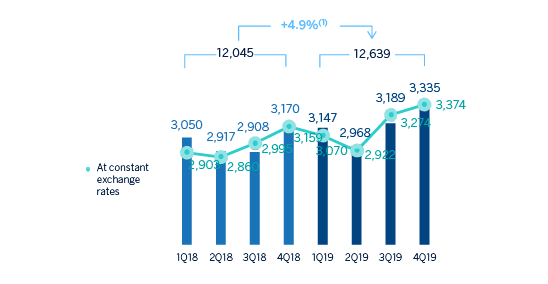
(1) At constant exchange rates: +6.1%.
Provisions and other
The impairment on financial assets not measured at fair value through profit or loss (impairment on financial assets) showed an increase of 6.0% in 2019. By business areas, it was notable the higher loan-loss provisions in the United States for specific clients of the commercial portfolio and the larger write-offs in the consumer portfolio in South America, (for Argentina and Peru), and to a lesser extent in Mexico, explained by the growth on this portfolio and the impact of the macro scenario deterioration. On the contrary, Spain recorded a 43.6% year-on-year reduction for lower provision requirements mainly due to the positive effect of non-performing and write-off portfolios sales in 2019.
IMPAIRMENT ON FINANCIAL ASSETS (Millions of Euros)
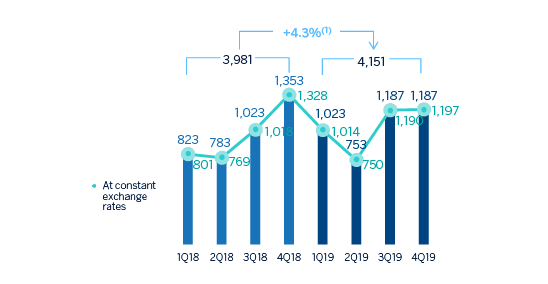
(1) (1) At constant exchange rates: +6,0%.
Provisions or reversal of provisions (hereinafter, provisions) was 66.7% above the 2018 figure, mainly due to greater endowments in Turkey and Argentina. Other gains (losses) mainly reflects the already mentioned goodwill impairment in the United States closing with a loss of €1,473m, compared with the profit of €755m in 2018, which mainly includes the capital gains from the sale of BBVA Chile.
Results
As a result of the above, the Group's net attributable profit in 2019 was €3,512m, 35.3% lower than the profit obtained the previous year (down 35.0% at current exchange rates). The comparison with respect to 2018 is influenced by the goodwill impairment in the United States and by the positive impact generated by the capital gains from the sale of BBVA Chile. In a more homogeneous comparison, without taking into account these two impacts and excluding the profit generated by the sale of BBVA Chile the net attributable profit from 2019 was 2.7% higher than the previous year (up 2.0% at constant exchange rates).
NET ATTRIBUTABLE PROFIT (Millones de euros)
(1) At constant exchange rates: -35,3%.
NET ATTRIBUTABLE PROFIT EXCLUDING BBVA CHILE AND THE UNITED STATES GOODWILL IMPAIRMENT (MILLIONS OF EUROS)
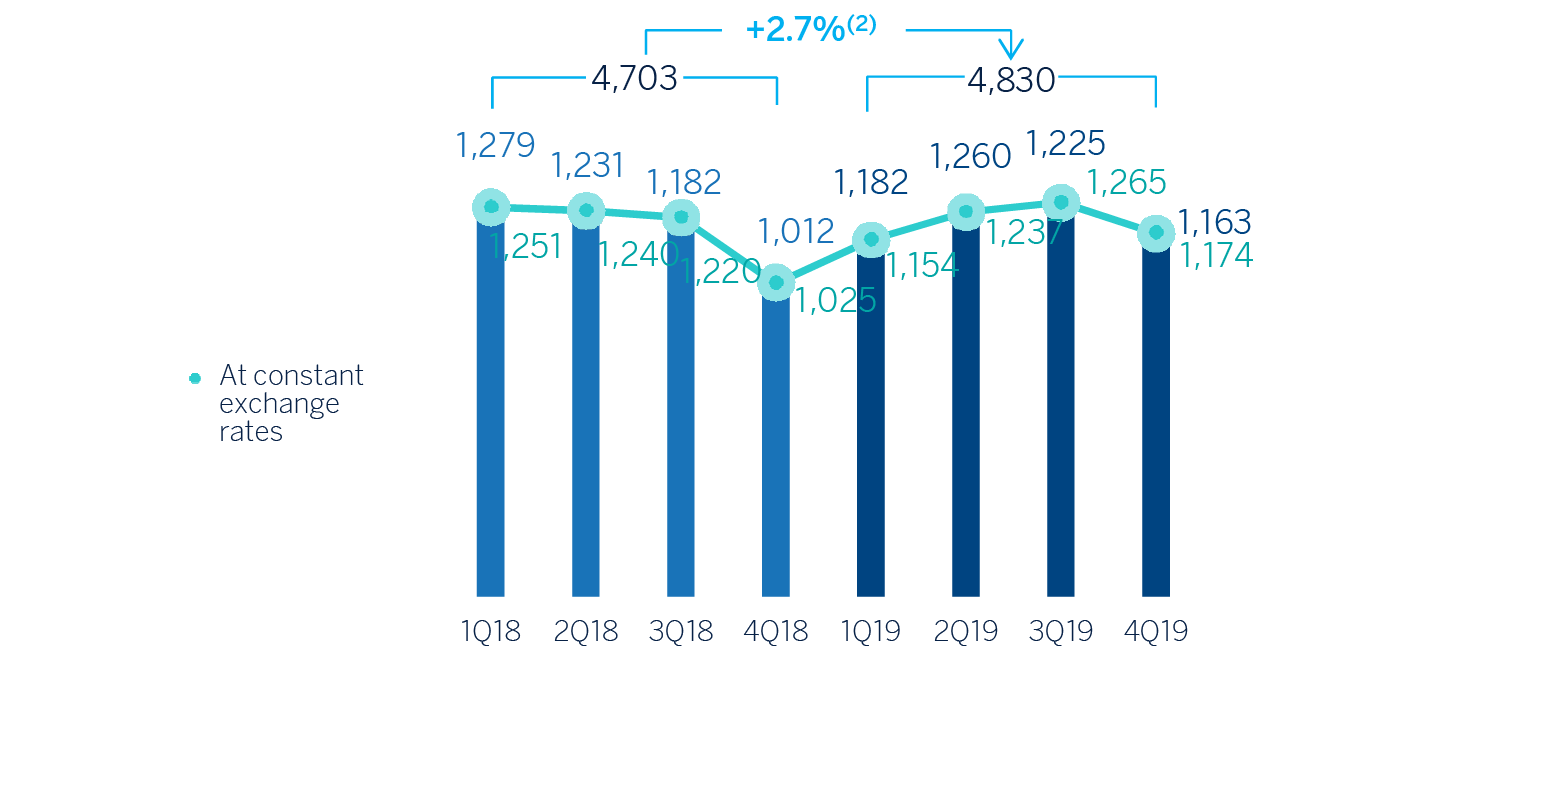
(1) At constant exchange rates: +2,0%
By business areas, and in millions of euros, Spain generated 1,386, the United States 590, Mexico recorded 2,699 in profit, Turkey 506, South America 721 and the Rest of Eurasia 127.
TANGIBLE BOOK VALUE PER SHARE AND DIVIDENDS (1) (EUROS)
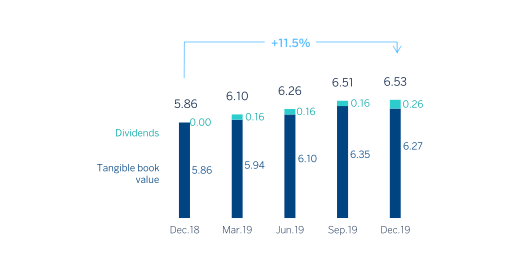
(1) Replenishing dividends paid in the period.
EARNING PER SHARE (1) (EUROS)
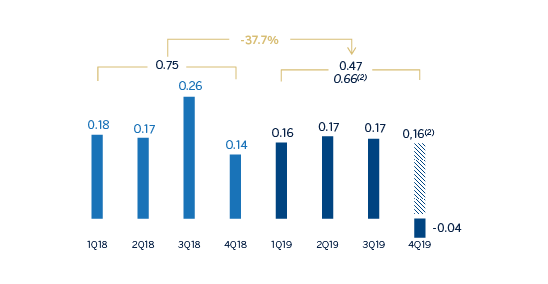
(1) Adjusted by additional Tier 1 instrument remuneration.
(2) Excluding the goodwill impairment in the United States in 2019.
ROE AND ROTE (1) (PERCENTAGE)
(1) Ratios excluding the impairment of Telefónica in 2017, BBVA Chile in 2018 and the goodwill impairment in the United States in 2019.
ROA AND RORWA (1) (PERCENTAGE)
(1) Ratios excluding the impairment of Telefónica in 2017, BBVA Chile in 2018 and the goodwill impairment in the United States in 2019.
Balance sheet and business activity
The most relevant aspects of the Group's balance sheet and business activity as of December 31, 2019 are summarized below:
- Loans and advances to customers (gross) increased by 2.2% during 2019, with increases in the business areas of Mexico, and, to a lesser extent, the United States, South America and Rest of Eurasia.
- Non-performing loans continued in a downward trend falling by 2.1% during the year, mainly due to the sales of the non-performing-loan portfolios in Spain.
- Customer deposits had a good performance along the year, with an increase of 2.2% compared to December 2018 (up 1.3% in the last quarter), mainly explained by the good evolution of demand deposits (up 7.6% year-on-year, up 2.8% in the last quarter).
- Off-balance sheet funds had an increase of 9.8% compared to December 31, 2018, thanks to the good performance of both mutual funds and pension funds.
- Regarding to tangible assets, the balance as of December 31, 2019 was affected by the implementation of IFRS 16 "Leases," which led to a growth resulting from its first implementation of €3,419m.
- Regarding the intangible assets, during the fourth quarter of 2019, the United States goodwill has been impaired by €1,318m, which does not affect the tangible net equity nor liquidity of BBVA Group.
- The figure for other assets/other liabilities at the end of December 2019 includes the assets and liabilities of BBVA Paraguay, which have been classified as non-current assets and liabilities held for sale (hereinafter NCA&L) in the consolidated public balance sheet, once the BBVA Group made public through a relevant event to the Spanish Securities Market Commission (hereinafter CNMV for its acronym in Spanish) the sales agreement, aforementioned in the relevant events section.
CONSOLIDATED BALANCE SHEET(MILLIONS OF EUROS)
| 31-12-19 | ∆% | 31-12-18 | |
|---|---|---|---|
| Cash, cash balances at central banks and other demand deposits | 44,303 | (23.9) | 58,196 |
| Financial assets held for trading | 102,688 | 14.0 | 90,117 |
| Non-trading financial assets mandatorily at fair value through profit or loss | 5,557 | 8.2 | 5,135 |
| Financial assets designated at fair value through profit or loss | 1,214 | (7.6) | 1,313 |
| Financial assets at fair value through accumulated other comprehensive income | 61,183 | 8.6 | 56,337 |
| Financial assets at amortized cost | 439,162 | 4.6 | 419,660 |
| Loans and advances to central banks and credit institutions | 17,924 | 36.8 | 13,103 |
| Loans and advances to customers | 382,360 | 2.2 | 374,027 |
| Debt securities | 38,877 | 19.5 | 32,530 |
| Investments in subsidiaries, joint ventures and associates | 1,488 | (5.7) | 1,578 |
| Tangible assets | 10,068 | 39.3 | 7,229 |
| Intangible assets | 6,966 | (16.2) | 8,314 |
| Other assets | 26,060 | (9.5) | 28,809 |
| Total assets | 698,690 | 3.3 | 676,689 |
| Financial liabilities held for trading | 89,633 | 11.0 | 80,774 |
| Other financial liabilities designated at fair value through profit or loss | 10,010 | 43.1 | 6,993 |
| Financial liabilities at amortized cost | 516,641 | 1.5 | 509,185 |
| Deposits from central banks and credit institutions | 54,700 | (7.7) | 59,259 |
| Deposits from customers | 384,219 | 2.2 | 375,970 |
| Debt certificates | 63,963 | 4.7 | 61,112 |
| Other financial liabilities | 13,758 | 7.1 | 12,844 |
| Liabilities under insurance and reinsurance contracts | 10,606 | 7.9 | 9,834 |
| Other liabilities | 16,875 | (0.9) | 17,029 |
| Total liabilities | 643,765 | 3.2 | 623,814 |
| Non-controlling interests | 6,201 | 7.6 | 5,764 |
| Accumulated other comprehensive income | (7,235) | 0.3 | (7,215) |
| Shareholders’ funds | 55,958 | 3.0 | 54,326 |
| Total equity | 54,925 | 3.9 | 52,874 |
| Total liabilities and equity | 698,690 | 3.3 | 676,689 |
| Memorandum item: | |||
| Guarantees given | 45,952 | (3.6) | 47,574 |
LOANS AND ADVANCES TO CUSTOMERS (MILLIONS OF EUROS)
| 31-12-19 | ∆% | 31-12-18 | |
|---|---|---|---|
| Public sector | 28,193 | (1.1) | 28,504 |
| Individuals | 174,608 | 2.4 | 170,501 |
| Mortgages | 110,500 | (0.9) | 111,528 |
| Consumer | 36,438 | 4.3 | 34,939 |
| Credit cards | 14,892 | 10.3 | 13,507 |
| Other loans | 12,778 | 21.4 | 10,527 |
| Business | 176,008 | 3.0 | 170,872 |
| Non-performing loans | 15,954 | (2.4) | 16,348 |
| Loans and advances to customers (gross) | 394,763 | 2.2 | 386,225 |
| Allowances (1) | (12,402) | 1.7 | (12,199) |
| Loans and advances to customers | 382,360 | 2.2 | 374,027 |
- (1) Allowances include the valuation adjustments for credit risk during the expected residual life of those financial instruments which have been acquired (mainly originated from the acquisition of Catalunya Banc, S.A., see Note 7 of the consolidated Financial Statements). As of December 31, 2019 and 2018 the remaining amount was €433m and €540m, respectively.
LOANS AND ADVANCES TO CUSTOMERS
(GROSS. BILLIONS OF EUROS)
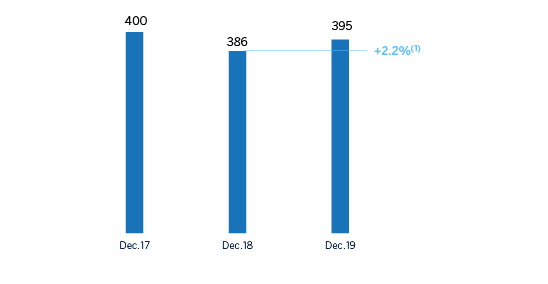
(1) At constant exchange rates: +2.5%.
CUSTOMER FUNDS
(BILLIONS OF EUROS)
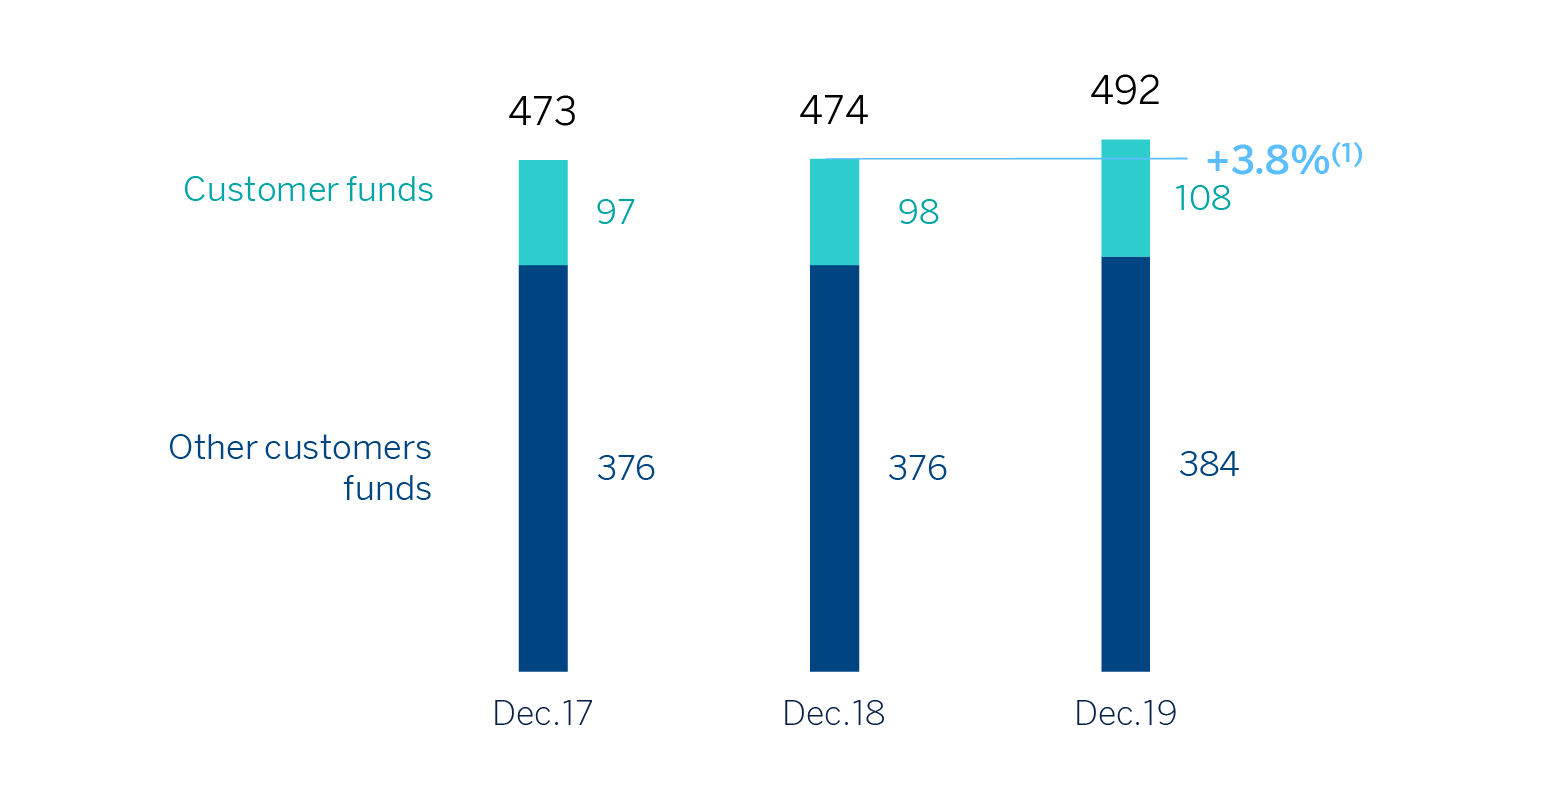
(1) At constant exchange rates: +3.8%.
CUSTOMER FUNDS (MILLIONS OF EUROS)
| 31-12-19 | ∆% | 31-12-18 | |
|---|---|---|---|
| Deposits from customers | 384,219 | 2.2 | 375,970 |
| Current accounts | 280,391 | 7.6 | 260,573 |
| Time deposits | 96,583 | (10.8) | 108,313 |
| Other deposits | 7,246 | 2.3 | 7,084 |
| Other customer funds | 107,803 | 9.8 | 98,150 |
| Mutual funds and investment companies | 68,639 | 11.8 | 61,393 |
| Pension funds | 36,630 | 8.3 | 33,807 |
| Other off-balance sheet funds | 2,534 | (14.1) | 2,949 |
| Total customer funds | 492,022 | 3.8 | 474,120 |
Solvency
Capital base
BBVA's fully loaded CET1 ratio stood at 11.74% at the end of 2019 which, excluding the impact of IFRS 16 standard’s implementation that entered into force on January 1, 2019 (down 11 basis points), the ratio increased by 51 basis points during the year. This increase is supported by the profit generation, net of dividend payments and remuneration of contingent convertible capital instruments (CoCos), notwithstanding the moderate growth of risk-weighted assets. In addition, the goodwill impairment in the United States recognized by the Group amounting to €1,318m has no impact on the regulatory capital.
Risk-weighted assets (RWA) increased by approximately €16,100m in 2019 as a result of activity growth, mainly in emerging markets and the incorporation of regulatory impacts (the application of IFRS 16 standard and TRIM - Targeted Review of Internal Models) for approximately €7,600m (impact on the CET1 ratio of -25 basis points). It should be noted that during the second quarter of the year the recognition by the European Commission of Argentina as a country whose supervisory and regulatory requirements are considered equivalent had a positive effect on the evolution of the RWAs.
The fully loaded additional tier 1 ratio (AT1) stood at 1.62% as of December 31, 2019. In this regard, BBVA S.A. carried out an issue of €1,000m CoCos, registered at the Spanish Securities Market Commission (CNMV) with an annual coupon of 6.0% and a redemption option from the fifth year, and another issue of the same type of instruments, registered in the Securities Exchange Commission (hereinafter, SEC) for USD 1,000m and a coupon of 6.5% with a redemption option after five and a half years.
On the other hand, in February 2020 the CoCos issuance of €1,500m with 6.75% coupon issued in February 2015 will be amortised. As of December 31, 2019, it is no longer included in the capital ratios.
Finally, in terms of issues eligible as Tier 2 capital, BBVA S.A. issued a € 750m subordinated debt over 10-year period and a redemption option in the fifth year, coupon of 2.575%; and carried out the early redemption of two subordinated-debt issues: one for €1,500m with a 3.5% coupon issued in April 2014 and redeemed in April 2019, and another issued in June 2009 by Caixa d'Estalvis de Sabadell with an outstanding nominal amount of €4.9m and redeemed in June 2019.
With regard to the subsidiaries of the Group, BBVA Mexico carried out a Tier 2 issuance of USD 750m over a 15-year period with an early redemption option from the tenth year and a 5.875% coupon; and partially repurchased two subordinated debt issuances (USD 250m due in 2020 and USD 500m due in 2021). Meanwhile, Garanti Bank issued another Tier 2 issuance of TRY 253m.
All of this, together with the evolution of the remaining elements eligible as Tier 2 capital, set the Tier 2 fully loaded ratio at 2.06% as of December 31, 2019.
In addition, in January 2020, BBVA, S.A. issued €1,000m of Tier 2 eligible subordinated debt over a ten-year period, with an early redemption option in the fifth year, with a coupon of 1%. This issue will be included in the capital ratios for the first quarter of 2020 with an estimated impact of approximately +27 basis points on the T2 capital ratio.
The phased-in CET1 ratio stood at 11.98% at the end of 2019, taking into account the transitional implementation of IFRS 9. The AT1 stood at 1.66% and the Tier 2 at 2.28%, resulting in a total capital ratio of 15.92%. These levels are above the requirements established by the supervisor in its SREP (Supervisory Review and Evaluation Process) letter, applicable in 2019. Starting on January 1st, 2020, at the consolidated level, this requirement has been established at 9.27% for the CET1 ratio and 12.77% for the total capital ratio. It should be noted that the Pillar 2 requirement of CET1 remains unchanged from the one included in the previous SREP decision, being the sole difference of the capital requirement, the evolution of the Countercyclical Capital buffer of approximately 0.01%. Furthermore, as of December 31, 2019, the Group’s capital ratios remain above the regulatory requirements applicable as of January 1, 2020.
2 On April 1, 2019, the Official Journal of the European Union published Commission Implementing Decision (EU) 2019/536, which includes Argentina within the list of third countries and territories whose supervisory and regulatory requirements are considered equivalent for the purposes of the treatment of exposures in accordance with Regulation (EU) No. 575/2013.
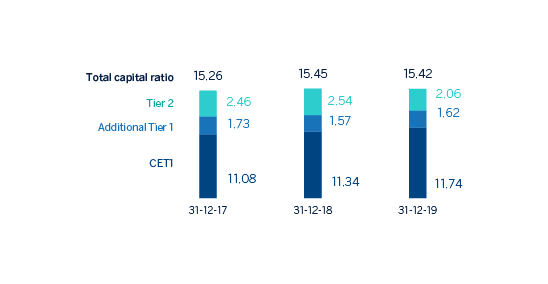
FULLY-LOADED CAPITAL RATIOS (PERCENTAGE)
CAPITAL BASE (MILLIONS OF EUROS)
| CRD IV phased-in | CRD IV fully-loaded | |||||
|---|---|---|---|---|---|---|
| 31-12-19 (1) (2) | 30-09-19 | 31-12-18 | 31-12-19 (1) (2) | 30-09-19 | 31-12-18 | |
| Common Equity Tier 1 (CET 1) | 43,653 | 43,432 | 40,313 | 42,856 | 42,635 | 39,571 |
| Tier 1 | 49,701 | 51,035 | 45,947 | 48,775 | 50,112 | 45,047 |
| Tier 2 | 8,324 | 8,696 | 8,756 | 7,505 | 7,798 | 8,861 |
| Total Capital (Tier 1 + Tier 2) | 58,025 | 59,731 | 54,703 | 56,281 | 57,910 | 53,907 |
| Risk-weighted assets | 364,448 | 368,196 | 348,264 | 364,943 | 368,690 | 348,804 |
| CET1 (%) | 11.98 | 11.80 | 11.58 | 11.74 | 11.56 | 11.34 |
| Tier 1 (%) | 13.64 | 13.86 | 13.19 | 13.37 | 13.59 | 12.91 |
| Tier 2 (%) | 2.28 | 2.36 | 2.51 | 2.06 | 2.12 | 2.54 |
| Total capital ratio (%) | 15.92 | 16.22 | 15.71 | 15.42 | 15.71 | 15.45 |
- (1) As of December 31, 2019, the difference between the phased-in and fully-loaded ratios arises from the temporary traetment of certain capital items, mainly of the impact of IFRS9, to which the BBVA Group has adhered voluntarily (in accordance with article 473bis of the CRR).
- (2) Provisional data.
In November 2019, BBVA received a new communication from the Bank of Spain regarding its minimum requirement for own funds and eligible liabilities (MREL), as determined by the Single Resolution Board, that was calculated taking into account the financial and supervisory information as of December 31, 2017.
In accordance with such communication, BBVA has to reach, by January 1, 2021, an amount of own funds and eligible liabilities equal to 15.16% of the total liabilities and own funds of its resolution group, on sub-consolidated basis (the MREL requirement). Within this MREL, an amount equal to 8.01% of the total liabilities and own funds shall be met with subordinated instruments (the subordination requirement), once the relevant allowance is applied.
This MREL requirement is equal to 28.50% in terms of risk-weighted assets (RWA), while the subordination requirement included in the MREL requirement is equal to 15.05% in terms of RWA, once the relevant allowance has been applied.
In order to comply with this requirement, BBVA has continued its issuance program during 2019 by closing three public senior non-preferred debt, for a total of €3,000m, of which one in green bonds by €1,000m. In addition, BBVA issued a senior preferred debt of €1,000m.
The Group estimates that the current own funds and eligible liabilities structure of the resolution group meets the MREL requirement, as well as with the new subordination requirement.
Finally, the Group's leverage ratio maintained a solid position, at 6.7% fully loaded (6.9% phased-in), which remains the highest among its peer group.
Ratings
In 2019, Moody's, S&P, DBRS and Scope confirmed the rating they assigned to BBVA's senior preferred debt (A3, A-, A (high) and A+, respectively). Fitch increased this rating by a notch in July 2019, considering that BBVA's loss-absorbing debt buffers (such as senior non-preferred debt) are sufficient to materially reduce the risk of default. In these actions, the agencies highlighted the Group's diversification and self-sufficient franchise model, with subsidiaries responsible for managing their own liquidity. These ratings, together with their outlooks, are shown in the following table:
Ratings
| Ratings | Long term (1) | Short term | Outlook |
|---|---|---|---|
| DBRS | A (high) | R-1 (middle) | Stable |
| Fitch | A | F-1 | Negative |
| Moody’s | A3 | P-2 | Stable |
| Scope Ratings | A+ | S-1+ | Stable |
| Standard & Poor’s | A- | A-2 | Negative |
- (1) Ratings assigned to long term senior preferred debt. Additionally, Moody’s and Fitch assign A2 and A rating respectively, to BBVA’s long term deposits.
The BBVA share
The main stock market indexes performed positively during 2019. In Europe, the Stoxx Europe 600 index increased by 23.2% in year-on-year terms, with a 5.8% increase in the fourth quarter. In Spain, the rise of the Ibex 35 during 2019 was more moderate (up 11.8% in 2019 and up 3.3% in the fourth quarter). In the United States, the growth rates remain as observed throughout the year and the S&P 500 rose 28.9% in 2019.
With regard to the banking sector indexes, particularly in Europe, its performance was worse than the general market indexes despite the good performance in the fourth quarter. The Stoxx Europe 600 Banks index, which includes banks in the United Kingdom, and the banks index for the Eurozone, the Euro Stoxx Banks, revalued by 8.6% and 11.1%, respectively in 2019. In the United States, the S&P Regional Banks Select Industry Index, on the other hand, increased 24.2% compared to the close of the 2018 financial year.
For its part, the BBVA share price increased by 7.5% during the year, up 4.2% in the fourth quarter, and closing December 2019 at €4.98.
BBVA SHARE EVOLUTION COMPARED WITH EUROPEAN INDICES (BASE INDICE 100=31-12-18)
BBVA
Stoxx Europe 600
Stoxx Banks
THE BBVA SHARE AND SHARE PERFORMANCE RATIOS
| 31-12-19 | 31-12-18 | |
|---|---|---|
| Number of shareholders | 874,148 | 902,708 |
| Number of shares issued | 6,667,886,580 | 6,667,886,580 |
| Daily average number of shares traded | 30,705,133 | 35,909,997 |
| Daily average trading (millions of euros) | 153 | 213 |
| Maximum price (euros) | 5.68 | 7.73 |
| Minimum price (euros) | 4.19 | 4.48 |
| Closing price (euros) | 4.98 | 4.64 |
| Book value per share (euros) | 7.32 | 7.12 |
| Tangible book value per share (euros) | 6.27 | 5.86 |
| Market capitalization (millions of euros) | 33,226 | 30,909 |
| Yield (dividend/price; %) (1) | 5.2 | 5.4 |
- (1) Calculated by dividing shareholder remuneration over the last twelve months by the closing price of the period.
Information about common stock and transactions with treasury stock is detailed in Notes 26 and 29 of the accompanying consolidated Financial Statements.
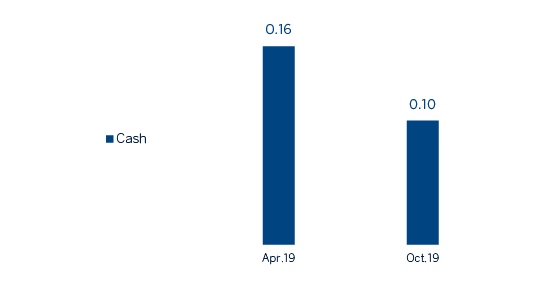
Regarding shareholder remuneration, on October 15 BBVA paid a cash interim dividend of €0.10 (gross) per share on account of the 2019 dividend. A cash payment in a gross amount of €0.16 per share, to be paid in April 2020 as final dividend for 2019, is expected to be proposed for the consideration of the competent governing bodies. Therefore, total shareholder remuneration in 2019 stands at €0.26 (gross) per share. This payment is consistent with the shareholder remuneration policy announced by Relevant Event of February 1, 2017.
SHAREHOLDER REMUNERATION (EUROS PER SHARE)
As of December 31, 2019, the number of BBVA shares remained at 6.668 billion, held by 874,148 shareholders, of which 43.40% are Spanish residents and the remaining 56.60% are non-residents.
SHAREHOLDER STRUCTURE (31-12-2019)
| Numbers of shares | Shareholders | Shares | ||
|---|---|---|---|---|
| Number | % | Number | % | |
| Up to 150 | 172,992 | 19.8 | 12,164,060 | 0.2 |
| 151 to 450 | 174,299 | 19.9 | 47,783,471 | 0.7 |
| 451 to 1,800 | 274,137 | 31.4 | 268,797,845 | 4.0 |
| 1,801 to 4,500 | 133,283 | 15.2 | 379,651,861 | 5.7 |
| 4,501 to 9,000 | 61,967 | 7.1 | 390,206,201 | 5.9 |
| 9,001 to 45,000 | 51,300 | 5.9 | 888,557,789 | 13.3 |
| More than 45,001 | 6,170 | 0.7 | 4,680,725,353 | 70.2 |
| Total | 874,148 | 100.0 | 6,667,886,580 | 100.0 |
BBVA shares are included on the main stock market indexes, including the Ibex 35, and the Stoxx Europe 600 index, with a weighting of 6.7% and 0.4%, respectively at the closing of December of 2019. They are also included on several sector indexes, including Stoxx Europe 600 Banks, which includes the United Kingdom, with a weighting of 3.8% and the Euro Stoxx Banks index for the eurozone with a weighting of 7.9%.
Finally, BBVA maintains a significant presence on a number of international sustainability indexes or Environmental, Social and Governance (ESG) indexes, which evaluates companies' performance in these areas. In September, BBVA continued to be included in the Dow Jones Sustainability Index (DJSI), the markets leading benchmark index, which measures the economic, environmental and social performance of the most valuables companies by market capitalization of the world (in the DJSI World and DJSI Europe), achieving the highest score in financial inclusion and occupational health and safety and the highest score in climate strategy, environmental reporting and corporate citizenship and philanthropy.
MAIN SUSTAINABILITY INDICES ON WHICH BBVA IS LISTED AS OF 31-12-19
Listed on the FTSE4Good Global Index Series
Listed on the Euronext Vigeo Eurozone 120 and Europe 120 indices
Listed on the Ethibel Sustainability Excellence Europe and Eithebel Sustainability Excellence Global indices
Listed on the Bloomberg Gender-Equality Index
In 2019, BBVA obtained a “A-” rating
(1) The inclusion of BBVA in any MSCI index, and the use of MSCI logos, trademarks, service marks or index names herein, do not constitute a sponsorship, endorsement or promotion of BBVA by MSCI or any of its affiliates. The MSCI indices are the exclusive property of MSCI. MSCI and the MSCI index names and logos are trademarks or service marks of MSCI or its affiliates.