
3. Financial information
3.1 BBVA Group
3.1.1 Main data
BBVA GROUP MAIN DATA (CONSOLIDATED FIGURES)
| 31-12-22 | ∆% | 31-12-21 | 31-12-20 | |
|---|---|---|---|---|
| Balance sheet (millions of euros) | ||||
| Total assets | 713,140 | 7.6 | 662,885 | 733,797 |
| Loans and advances to customers (gross) (1) | 369,260 | 11.9 | 330,055 | 323,252 |
| Deposits from customers (1) | 393,856 | 12.6 | 349,761 | 342,661 |
| Total customer funds (1) | 544,028 | 9.5 | 496,954 | 471,928 |
| Total equity | 50,615 | 3.8 | 48,760 | 50,020 |
| Income statement (millions of euros) | ||||
| Net interest income | 19,153 | 30.4 | 14,686 | 14,592 |
| Gross income | 24,890 | 18.2 | 21,066 | 20,166 |
| Operating income | 14,130 | 22.5 | 11,536 | 11,079 |
| Net attributable profit (loss) | 6,420 | 38.0 | 4,653 | 1,305 |
| Adjusted net attributable profit (loss) (2) | 6,621 | 30.6 | 5,069 | 2,729 |
| The BBVA share and share performance ratios | ||||
| Number of shares issued (million) | 6,030 | (9.6) | 6,668 | 6,668 |
| Share price (euros) | 5.63 | 7.3 | 5.25 | 4.04 |
| Adjusted earning (loss) per share (euros) (2) | 1.05 | 48.1 | 0.71 | 0.35 |
| Earning (loss) per share (euros) (2) | 0.99 | 47.1 | 0.67 | 0.14 |
| Book value per share (euros) (2) | 7.80 | 13.7 | 6.86 | 6.70 |
| Tangible book value per share (euros) (2) | 7.44 | 14.1 | 6.52 | 6.05 |
| Market capitalization (millions of euros) | 33,974 | (3.0) | 35,006 | 26,905 |
| Dividend yield (dividend/price; %) (2)(3) | 6.2 | 2.6 | 4.0 | |
| Significant ratios (%) | ||||
| Adjusted ROE (net attributable profit (loss)/average shareholders' funds +/- average accumulated other comprehensive income) (2) | 14.6 | 11.4 | 6.1 | |
| Adjusted ROTE (net attributable profit (loss)/average shareholders' funds excluding average intangible assets +/- average accumulated other comprehensive income) (2) | 15.3 | 12.0 | 6.5 | |
| Adjusted ROA (Profit (loss) for the period / average total assets - ATA) (2) | 1.00 | 0.94 | 0.54 | |
| Adjusted RORWA (Profit (loss) for the period / average risk-weighted assets - RWA) (2) | 2.14 | 2.01 | 1.16 | |
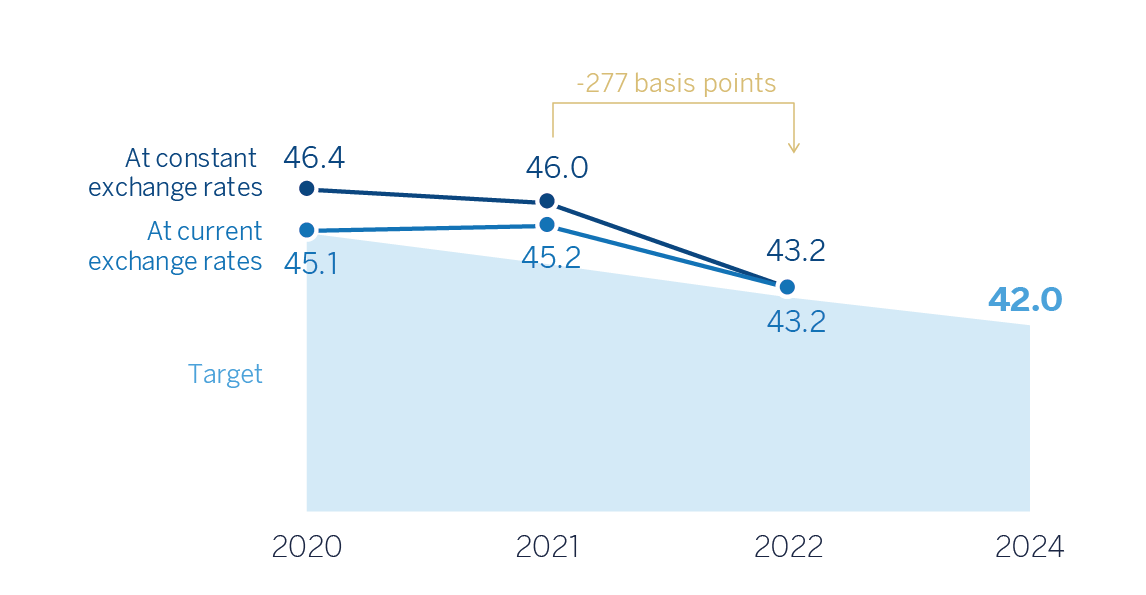
| Efficiency ratio (2) | 43.2 | 45.2 | 45.1 | |
| Cost of risk (2) | 0.91 | 0.93 | 1.55 | |
| NPL ratio (2) | 3.4 | 4.1 | 4.2 | |
| NPL coverage ratio (2) | 81 | 75 | 82 | |
| Capital adequacy ratios (%) | ||||
| CET1 fully-loaded | 12.61 | 12.75 | 11.73 | |
| CET1 phased-in (4) | 12.68 | 12.98 | 12.15 | |
| Total ratio phased-in (4) | 15.98 | 17.24 | 16.46 | |
| Other information | ||||
| Number of customers (million) (1) | 89.3 | 8.6 | 82.2 | 78.8 |
| Number of shareholders | 801,216 | (3.1) | 826,835 | 879,226 |
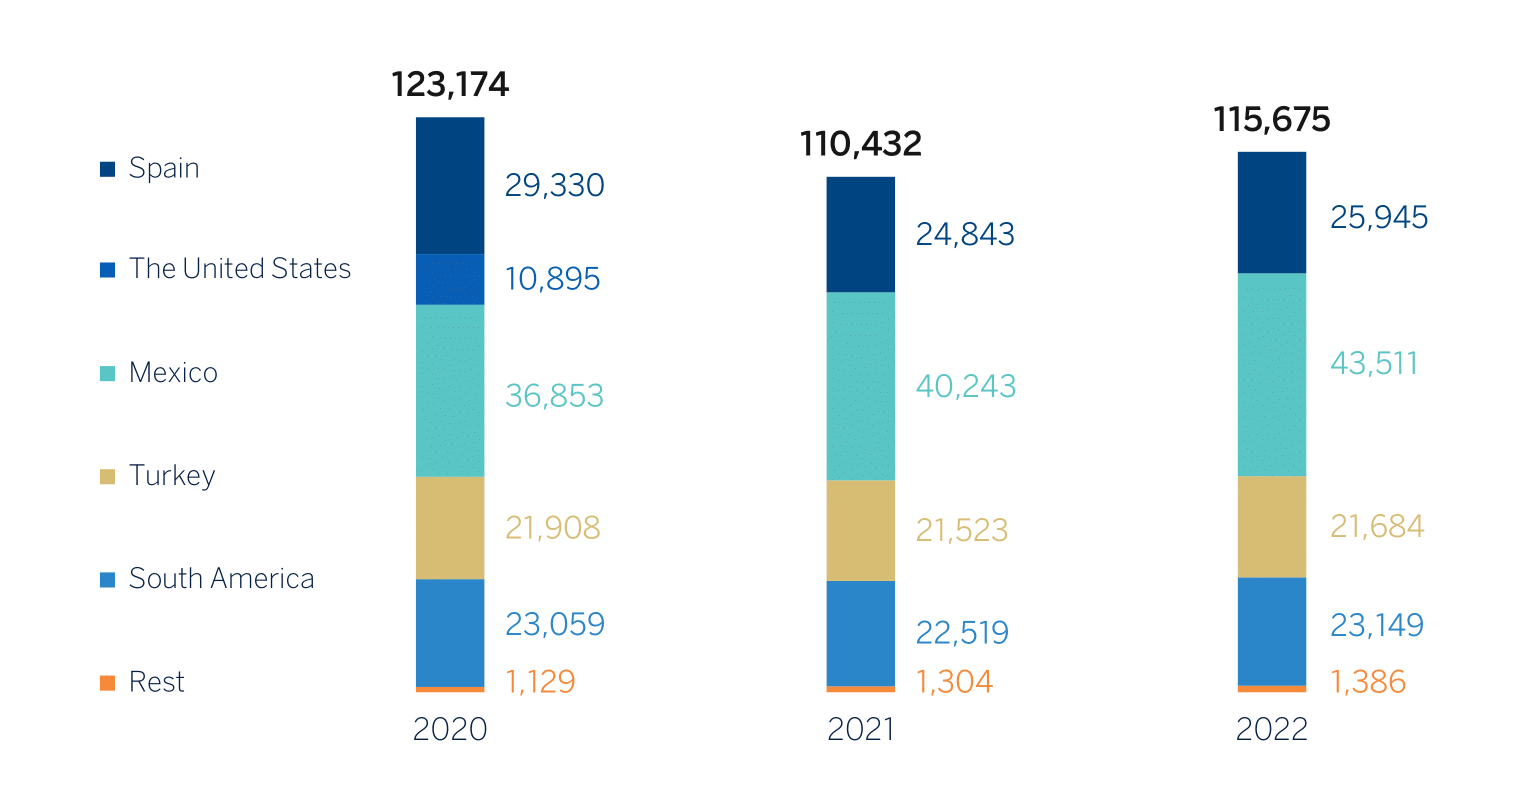
| Number of employees | 115,675 | 4.7 | 110,432 | 123,174 |
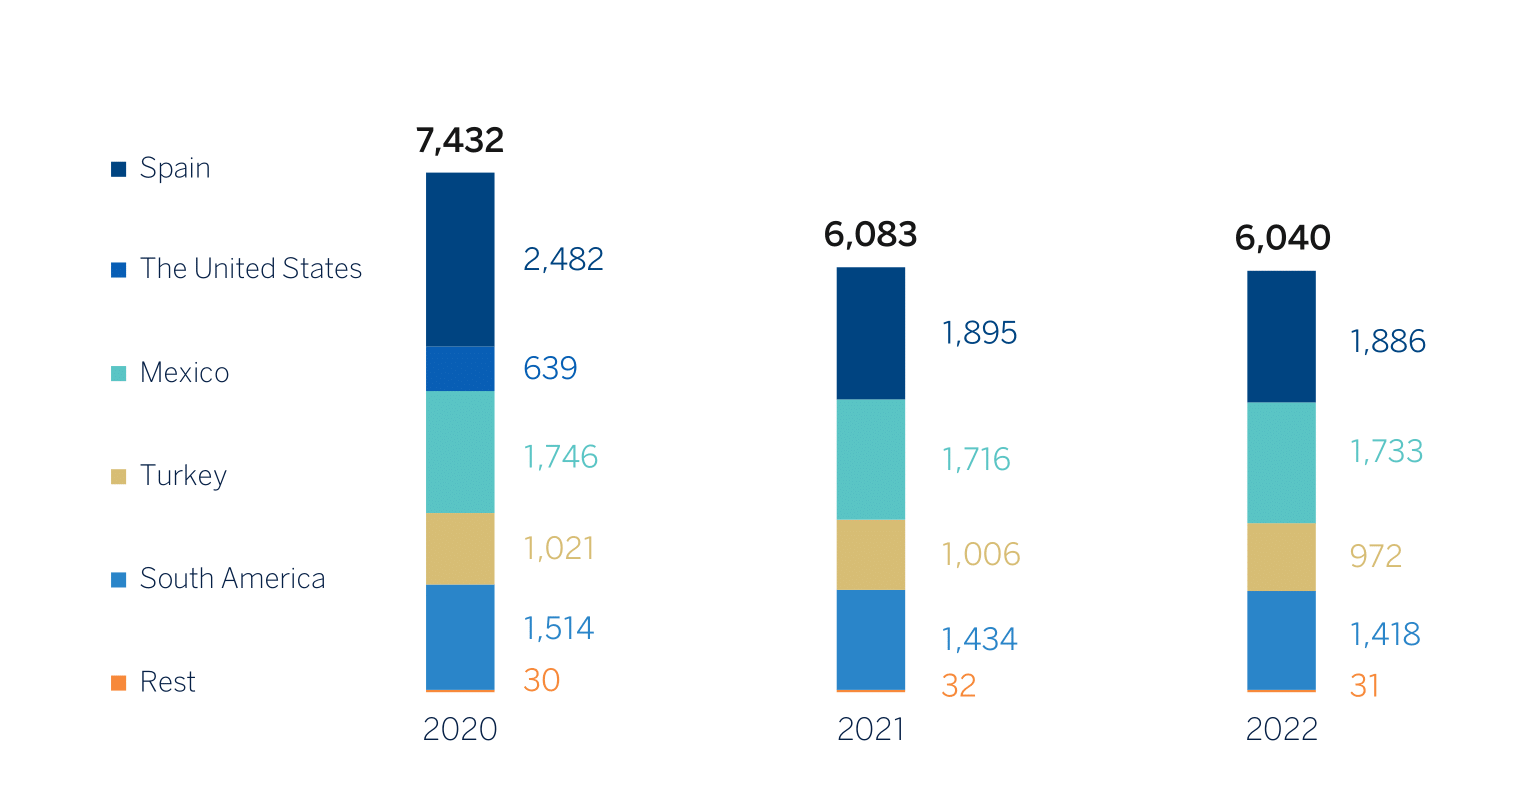
| Number of branches | 6,040 | (0.7) | 6,083 | 7,432 |
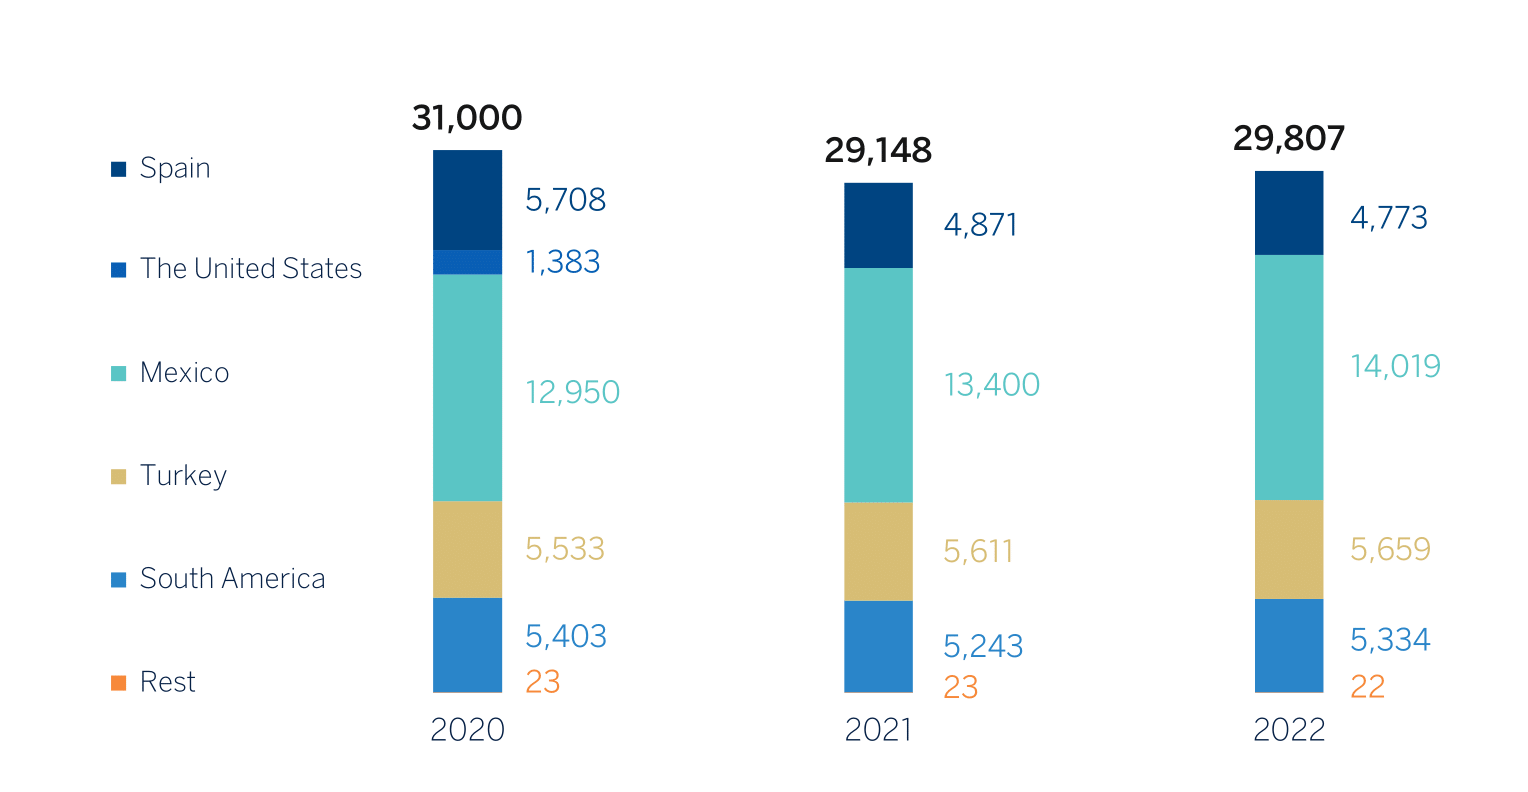
| Number of ATMs | 29,807 | 2.3 | 29,148 | 31,000 |
- (1) Excludes BBVA USA and the rest of the companies in the United States sold to PNC on June 1, 2021 and BBVA Paraguay as of 31-12-20.
- (2) For more information, see Alternative Performance Measures at the end of this report.
- (3) Calculated by dividing the dividends paid in the last twelve months by the closing price of the period.
- (4) Phased-in ratios include the temporary treatment on the impact of IFRS 9, calculated in accordance with Article 473 bis amendments of the Capital Requirements Regulation (CRR), introduced by the Regulation (EU) 2020/873.
3.1.2 Macroeconomic and regulatory environment
Macroeconomic environment
The global economy has decelerated throughout the course 2022, in an environment marked by strong inflationary pressures, an aggressive tightening of monetary conditions, the adverse impact of the war in Ukraine and slower growth in China.
Despite the slowing trend, economic growth showed some resilience and was generally higher than expected by most analysts. This was due to previously accumulated savings, the process of normalization of activity after the restrictions and disruptions generated by the COVID-19 pandemic, and the dynamism of the labor markets, which contributed to an improvement in private consumption and the service sector.
Inflation remained at elevated levels in 2022. However, after surprising on the upside for most of the year, it started to moderate in recent months. This is in line with the slowing trend in aggregate demand, the recent moderation in energy prices and normalization in global supply chains. At year-end, annual inflation stood at 6.5% in the United States and 9.2% in the Eurozone.
Against this backdrop of still elevated inflationary pressures, central banks continued to tighten monetary policy. The U.S. Federal Reserve ("the Fed") raised benchmark interest rates to 4.5% in December (a level 425 basis points higher than at the beginning of 2022) and kept up asset sales to reduce the size of its balance sheet. Further, the Fed indicated that interest rate hikes will continue in the coming months, albeit at a slower pace. In the Eurozone, the ECB has raised interest rates for its refinancing operations to 2.5% in December (a level 250 basis points higher than at the start of 2022). In addition, the central bank has tightened the conditions of its liquidity supply to banks through the TLTRO operations (targeted long-term refinancing operations) and has indicated that it will soon initiate a program to sell its assets. Regarding benchmark interest rates in 2023, additional increases are expected (such as the rise in the Fed's 0.25 basis points and the ECB's 0.5 basis points, announced on February 1 and February 2, 2023, respectively), since inflation remains at high levels. In a context of high uncertainty, BBVA Research's central scenario estimates that the global economy will continue to slow down in the near future, with possible episodes of recession in the Eurozone and the United States. This slowdown in growth will be mainly due to the significant tightening of monetary conditions (interest rates are expected to reach close to 5.0% in the United States and 3.75% in the Eurozone in the coming months; these are clearly contractionary levels, which will remain unchanged until at least the final months of the year 2023) and inflationary pressures are still significant, despite the prospects for moderation.
According to BBVA Research, after growing by 6.3% in 2021 and around 3.3% in 2022, global GDP will grow by only 2.3% in 2023. In the United States, growth would slow to 1.9% in 2022 and 0.5% in 2023, as strong monetary tightening is expected to cause a downward adjustment on growth. In the Eurozone, GDP is expected to slightly fall in the coming quarters, primarily due to the disruptions created by the war in Ukraine, including still high gas prices. The annual growth in the region would be 3.2% in 2022 and -0.1% in 2023. In China, the growth would reach 3,0% in 2022 and 5,0% in 2023, but the wider spread of COVID-19 infections following the financial strains caused by imbalances in real estate markets could trigger slower-than-expected economic growth.
The uncertainty remains at high levels and the risks could have a downward bias on growth. Specifically, sustainable inflation could trigger even stronger interest rate hikes and therefore, a deeper and more widespread recession, as well as higher financial volatility.
REAL GDP GROWTH AND INFLATION (REAL PERCENTAGE GROWTH)
| 2022 | 2023 | |||
|---|---|---|---|---|
| GDP | INFLATION | GDP | INFLATION | |
| Global | 3.30 | 7.20 | 2.30 | 4.70 |
| Eurozone | 3.20 | 9.20 | -0.10 | 2.90 |
| Spain | 5.50 | 5.70 | 1.40 | 4.00 |
| The United States | 1.90 | 6.50 | 0.50 | 3.20 |
| Mexico | 3.0 | 7.80 | 0.60 | 4.00 |
| South America (1) | 3.60 | 22.60 | 0.30 | 21.70 |
| Turkey | 5.50 | 64.30 | 3.00 | 42.00 |
| China | 3.00 | 1.80 | 5.00 | 2.50 |
- Source: BBVA Research estimates. Inflation end of period.
- (1) Argentina, Brazil, Chile, Colombia, Paraguay, Peru and Uruguay.
Exchange rate evolution
In the year 2022, foreign exchange markets have been influenced by the central banks' actions to control inflation -aggravated by the war in Ukraine- and the political uncertainties in some countries. This context has benefited the U.S. dollar, which has appreciated 6.2% against a euro, which was particularly penalized until October. The currencies of Latin America have presented an uneven performance in the year 2022. The Mexican peso and the Peruvian sol appreciated by 11.0% against the euro, and the Chilean peso by 4.4%. For its part, the Argentine peso accumulated a depreciation of 38.3% and the Colombian peso of 12.1%. With regard to the Turkish lira, the high inflation environment and the very lax monetary policies continue to negatively affect the currency, losing a 23.7% against the euro during the year.
For information on the BBVA Group's exchange rate risk management policies, see the "Risk Management" chapter of this report.
EXCHANGE RATES (EXPRESSED IN CURRENCY/EURO)
| Year-end exchange rates | Average exchange rates | ||||
|---|---|---|---|---|---|
31-12-22 |
∆% on 31-12-21 |
∆% on 30-09-22 |
2022 |
∆% on 2021 |
|
| U.S. dollar | 1.0666 | 6.2 | (8.6) | 1.0532 | 12.3 |
| Mexican peso | 20.8560 | 11.0 | (5.8) | 21.1889 | 13.2 |
| Turkish lira (1) | 19.9649 | (23.7) | (9.4) | — | — |
| Peruvian sol | 4.0572 | 11.0 | (4.6) | 4.0309 | 13.8 |
| Argentine peso (1) | 188.51 | (38.3) | (23.9) | — | — |
| Chilean peso | 916.75 | 4.4 | 2.7 | 917.69 | (2.2) |
| Colombian peso | 5,130.56 | (12.1) | (13.9) | 4,469.08 | (0.9) |
- (1) According to IAS 21 "The effects of changes in foreign exchange rates", the year-end exchange rate is used for the conversion of the Turkey and Argentina income statement.
Regulatory environment
Regulatory environment 2022: focus on ESG, data and cryptoassets and ESG
During 2022, the regulatory environment for the financial industry has been shaped by a new geopolitical framework caused by the war between Russia and Ukraine and its repercussions. This has shaken up the markets and the financial system and has materialized in a range of economic sanctions imposed on Russia, which have, in turn, prompted a focus on issues related to money laundering and terrorist financing, and the role of cryptoassets.
All this took place alongside the implementation of work plans already stipulated by the regulatory bodies, which focused on three lines of action: (I) climate change; (II) strengthen the prudential framework of the financial system; and (III) digitalization of the banking sector. Another highlight of 2022 were the new data regulations and agreements and the intensification of the global regulatory debate around cryptoassets. Solutions are being sought that address the regulation, supervision and oversight of cryptoassets with a focus on financial stability.
1. ESG: consolidation of taxonomy and itemized disclosures
In 2022, ESG regulatory activity for the European banking system became firmly established and regulation in the United States took off.
At the global level, the BCBS published a statement of principles for effective management and monitoring of climate change-related risks. The principles are designed to be adaptable to different banking systems, in a proportionate manner, depending on the size, complexity and risk profile of the sector. The document lays down 18 principles: 12 for banks (covering corporate governance, internal control, risk management and reporting) and 6 for supervisors (who must ensure that they have adequate resources and capabilities to assess the management of banks).
There are other initiatives driven by global institutions that are advancing swiftly. These include the new International Sustainability Standards Board (ISSB), created in November 2021 by the International Financial Reporting Standards Foundation (IFRS), which in 2022 published two climate and general issues papers for comment, and draft sector-specific standards. The ISSB relied on the Task Force on Climate-related Financial Disclosures (TCFD) and the sector-specific standards of the Sustainability Accounting Standards Board (SASB). The ISSB aims to be a comprehensive global standard-setter. It is therefore partnering with other international organizations and jurisdictions to ensure the development of a robust, internationally applicable framework that will form the basis for the requirements of the various jurisdictions. In addition to the frameworks mentioned so far, we especially highlight the initiatives of the Global Reporting Initiative (GRI), the Value Reporting Foundation, and the WEF (IBC's stakeholder capitalism metrics), with which the ISSB actively collaborates to achieve a global metrics model.
The EU has continued to integrate ESG concepts into prudential regulation, supervision and reporting requirements. In prudential regulation, discussions continued in the legislative negotiation of the CRR III and CRD VI, which introduce the definitions of the different types of ESG risks. In terms of reporting, the European Commission published the Regulatory Technical Standards (RTS), which supplement the Sustainable Finance Disclosure Regulation (SFDR). For its part, the EC has adopted the Implementing Technical Standards (ITS) on Pillar 3 reporting of ESG risks with the aim of integrating all relevant reporting requirements. The ITS provide the tables, templates and instructions that banks should use to disclose relevant qualitative information on ESG risks and quantitative data on climate change-related risks, including transitional and physical risks and mitigation measures. Banks must make the first disclosure in March 2023, releasing data as of December 2022. The first disclosure will be annual and thereafter will be six-monthly.
Regarding taxonomy, the complementary delegated act on climate (mitigation and adaptation) was approved through Delegated Regulation 2021/2139 of June 4, 2021, in order to accelerate decarbonization, and was subsequently modified by Delegated Regulation (EU) 2022/1214 of the Commission of March 9, 2022, which introduces specific information requirements that companies must comply with in relation to their activities in the gas and nuclear energy sectors.
In addition, the European Commission has published a proposal for a Directive on Corporate Sustainability Due Diligence. During 2022, this proposal was under negotiation in the Parliament and the Council. The Directive aims to ensure that companies operating in the internal market contribute to the transition to sustainability through the identification, prevention and mitigation, cessation and minimization of potential or actual adverse human rights and environmental impacts related to the company's own activity or the activities of its subsidiaries or of its value chain. Once adopted, Member States will have two years to transpose the Directive into their national legislation.
Europe has continued to integrate ESG concepts into prudential regulation, supervision, and reporting requirements. Several sustainability reporting standards have been created: one in Europe, following the enactment of the Corporate Sustainability Reporting Directive (CSRD), for the implementation of which the first set of 'European Sustainability Reporting Standards,' prepared by the European Financial Reporting Advisory Group (EFRAG) to the European Commission; and another in the United States, after the Securities and Exchange Commission (SEC) published in March 2022 the paper 'The Enhancement and Standardization of Climate-Related Disclosures for Investors.'
Reflecting the rising importance of ESG issues in supervision, the ECB has launched the first bottom-up stress test exercise for climate change risk supervision to identify vulnerabilities, best practices and challenges faced by banks in managing climate change risk. This was not a pass/fail exercise, nor does it have direct implications for capital requirements, as the results will feed into the Supervisory Review and Evaluation Process (SREP) from a qualitative standpoint only. Participating banks received individual feedback on the results so that they can act accordingly, in line with the best practices to be published by the ECB in the closing quarter of 2022.
2. Prudential environment and scope: strengthening the industry
In the global prudential arena, the Basel Committee on Banking Supervision (BCBS) has addressed new issues. Among other forward steps, the BCBS has adopted a set of principles for the effective management and supervision of financial climate change risks and has advanced the implementation of the prudential treatment of cryptoassets with the publication of its final standard. Moreover, the BCBS has agreed on a roadmap to reflect the development of the European banking union based on the assessment method for global systemically important banks (hereinafter G-SIBs). The Committee has continued to assess risks and vulnerabilities in the global banking system, including those arising from the conflict in Ukraine. The body also addressed the post-crisis regulatory framework, with a focus on the effectiveness of the Basel III reforms, on which a report was published in December 2022.
In the European prudential field, intense negotiations have taken place in the Council and Parliament on the implementation in EU law of the international capital adequacy rules known as Basel III. The proposal presented at the end of 2021 by the European Commission, the "2021 Banking Package", seeks to make EU banks more resilient to potential future economic crises, while contributing to Europe's recovery from the COVID-19 pandemic and the transition to climate neutrality. The package comprises three proposals: (I) the proposed capital requirements directive (CRD VI, amending the previous CRD V); (II) the proposed capital requirements regulation (CRR III, amending CRR II); and (III) a separate legislative proposal around bank resolution (the "Daisy Chain proposal"), which also amends CRR V.
The entry into force of the changes will be gradual and is expected to come into effect from 2025. The Daisy Chain-related changes, which came into effect on November 14, 2022, are a raft of reforms related to the bank resolution framework, with special impact on Multiple Point of Entry ("MPE") banks, where capital and liquidity are managed separately in each subsidiary.
Furthermore, the European Banking Authority (EBA) has published final draft Regulatory Technical Standards (RTS) for the probability of default (PD) and loss given default (LGD) risk model for banks using the new internal models-based approach under the Fundamental Review of the Trading Book (FRTB). Regarding non-performing loans (NPLs), the EBA has published several consultation papers on the reporting templates that banks must file. The result is expected to be published in the first half of 2023, and has published the standard on the information required for the sale of NPL loans.
In Spain, the Bank of Spain (Spanish 'BdE') published Circular 1/2022 on liquidity, prudential rules and reporting obligations for financial institutions, which amends Circular 1/2009 and Circular 3/2019. The document sets out the liquidity regulations applicable to financial credit institutions and adapts the reporting obligations of credit institutions regarding solvency and shareholder structure to the activity, business model, size and relative importance of each institution. Moreover, in the context of global economic uncertainty, Royal Decree-Law 6/2022, on urgent measures in response to the economic and social consequences of the war in Ukraine, was adopted to address the economic and social consequences of the war, with short-term measures and steps to accelerate medium- and long-term action on the energy transition. Finally, we highlight the enactment of Law 18/2022, on company formation and growth. The statute includes measures ranging from regulatory streamlining to reduction of the minimum share capital to form private limited companies. It also includes the promotion of collective investment and venture capital, and improved access to finance.
In 2022, the regulatory debate continued on the macroprudential framework and capital buffers. The European Central Bank (ECB) confirmed that it will not extend the loosening of Pillar 2 capital requirements and capital conservation buffer allowed during the COVID pandemic. As of January 1, 2023, banks will return to operating at pre-crisis levels.
Furthermore, the consultation launched by the European Commission in November 2021 on the review of the macroprudential framework, including the design and functioning of capital buffers, was completed. The EBA, the ECB and the European Systemic Risk Board (ESRB) published their respective opinions. The Commission's legislative proposal is expected during the first quarter of 2023.
A relevant novelty is the recognition of the progress of the Banking Union in the method of identification of G-SIBs. In May 2022, the BCBS allowed the calculation of parallel scoring for G-SIBs where 66% of cross-border exposures within the Banking Union for European G-SIBs can be characterized as domestic. This parallel scoring will allow, according to the expert judgment of the national authorities (NCAs), an adjustment of the assignment of the banks to the different levels of required capital (the 'buckets').
Environmental, Social and Governance (ESG) or sustainability criteria are also included in the macroprudential framework, as they were one of the topics addressed in the EuropeanCommission's consultation, which asked whether they should be accorded specific treatment. In July 2022, the ECB and the ESRB published a joint report, "The Macroprudential Challenge of Climate Change," which discusses the adequacy of macroprudential tools to address climate-related risks. The Financial Stability Board (FSB) also commented on this possibility in its final report on supervisory and regulatory approaches to climate-related risks, assessing the pros and cons.
However, at the Eurogroup meeting, the Eurogroup President's proposal to unblock progress on the Banking Union by setting up a European Deposit Insurance Scheme (EDIS) was rejected. The consensus reached was that certain aspects of the bank crisis management and guarantee fund framework need to be reviewed. A legislative proposal is expected by early 2023.
The EBA published its final guidelines for enhancing the resolution capabilities of banks and resolution authorities, which will be applicable as from January 1, 2024. The Single Resolution Board (SRB) published its operational guidance on the identification and mobilization of collateral in resolution, which supplements the 'Expectations for Banks' paper and helps stakeholders understand the operational and legal requirements that banks should anticipate maximizing the amount of assets that could be mobilized as collateral during and after resolution. For its part, the European Commission published a consultation paper to assess the framework for State aid in the banking system, which is linked to the crisis management framework. Finally, the EBA published a consultation paper to revise its guidance on the method for calculating contributions to the Deposit Guarantee Fund (DGF).
3. Financial markets and conduct
During 2022, Europe tried to move forward with small steps in firming up the Capital Markets Union (CMU) project. The European Parliament and the Council reached an agreement on the regulation of European Long Term Investment Funds (ELTIFs). ELTIFs will now be more attractive to investors and strengthen their role as a supplementary source of finance for EU companies. This represents progress towards meeting the milestones of the European Commission's CMU plan by helping to finance the green and digital transitions.
Regulatory efforts on the reform of interest rate benchmarks (interbank offered rates or 'IBORs') have now moved onto the operational implementation phase. The European Securities and Markets Authority (ESMA) replaced the Belgian Financial Services and Markets Authority (FSMA) as supervisor of the EURIBOR administrator as of January 1, 2022. ESMA also chairs the EURIBOR college of supervisors, which brings together all the national supervisors of the banks within the index contributor panel. In addition, ESMA is the supervisor of third country administrators recognized by the EU under the European Benchmarks Regulation. The European Commission published initiatives to designate legal replacements for certain yen LIBOR rates and sterling LIBOR rates. These were not completed, however, and the Commission is expected to publish the final paper by the end of the year. For its part, the EURIBOR administrator, EMMI, officially began publishing the EFTERM (euro forward-looking term rate) index in November. The new index is designed to serve as a substitute for EURIBOR, in compliance with the European Benchmarks Regulation. ESMA issued a recommendation to market makers to start (if they have not already done so) active trading of derivatives with €STR as underlying. Finally, the UK delayed the withdrawal of GBP LIBOR in the 1 and 6 month maturities until March 2023 to give the market more time to make the necessary transitions. In the United States, work continues to designate replacement rates for IBOR US in SOFR (Secured Overnight Financing Rate).
Regarding securitizations, the EBA has published its final draft of the RTS. The standards specify requirements for originators, sponsors and originating lenders in relation to risk retention. In Spain, on July 8, 2022, the new law on bonds came into force, which implements the European directive and affects both existing bonds and future issues.
In relation to the provision of investment services, after the European Commission published its proposals for amendments to MiFIR43 and MiFID II44 in November 2021, discussions on these amendments continued during 2022 within the European Parliament and in the Council. Discussions have deviated from the Commission's original proposal. The European framework is now moving closer to the reform underway in the UK, with a reduction in the operational burden. At the national level, the transposition of the changes introduced by the MiFID II Quick Fix was integrated into the draft law on securities markets and investment services, which is currently in the process of being approved by parliament.
Regarding MiFID II regulations, ESMA has published a consultation paper on the perimeter of trading venues. ESMA has also published a supervisory report to ensure EU-wide convergence of supervision of banks using tied agents, in particular those based outside the EU.
In the derivatives market, the European Supervisory Authorities (ESAs) have launched a proposal to extend intra-group exemptions from margining and centralized settlement obligations to transactions with third-country subsidiaries. It has also been proposed to widen the scope of eligible collateral for energy derivatives settled in clearing houses. Finally, the European Commission published a new proposal to amend the European Market Infrastructure Regulation (EMIR) with the main goal of promoting centralized settlement within the EU.
For its part, the EU continues to work along three lines of action that it considers key: (I) shadow banking; (II) protection of retail investors; and (III) Anti-Money Laundering (AML)/Combating the Financing of Terrorism (CFT).
Regarding the first point, the EBA has published its final draft of the Regulatory Technical Standards (RTS). The standards set out the criteria for identifying shadow banking entities for large exposure reporting purposes. Entities that conduct banking activities or services authorized and supervised in accordance with the EU prudential framework will not be considered to be shadow banks.
On the second point, the ESAs published a paper containing their technical advice to the European Commission on the revision of the Packaged Retail and Insurance-based Investment products Regulation (PRIIPs). The paper, which will feed into the Commission's strategy for retail investors, addresses issues such as how to better adapt the Key Investor Information Document (KIID) to the digital age, and whether to extend the scope of the Regulation to other financial products.
On the third point, AML/CFT, the EBA published its guidelines on policies and procedures relating to compliance management and the role and powers of the AML/CFT compliance officer. The guidelines comprehensively address, for the first time at EU level, the AML/CFT governance structure. In addition, in 2022, negotiations have continued in the Parliament and the Council on the AML/CFT package published by the European Commission. Among other proposals, the Commission launched the idea of creating a European anti-money laundering authority. The EU Council agreed in December its position on the texts of the new AML Directive and the new AML Regulation.
Finally, in the United Kingdom, the Financial Services and Markets Bill was published. The Bill is designed to update part of the UK's regulatory framework following its exit from the EU. The new rules deviate from European standards to promote investment by including specific regulation for cryptocurrency activities.
4. Regulation in the field of digital transformation of the financial sector: data, cryptoassets and the digital euro
In 2022, digitization continued to be a priority for European authorities, which have continued to make progress in implementing the digital strategy laid down in 2020. The key pillars of the initiative are strengthening the use of data and the development and regulation of artificial intelligence. In relation to the first point, in 2022 the European Commission published a proposal for a regulation on harmonized rules for fair access and use of data (a 'Data Act'). The aim is to ensure fairness in the allocation of value arising from the use of data among the different actors in the data economy and to promote access to and use of data. To this end, new rights are established in the proposed regulation for individuals and companies to access and share data generated in the use of connected objects. In addition, the proposed statute sets down some general conditions that will also apply to data-sharing obligations in future regulations. The draft regulation further includes other measures related to making it easier for users to switch cloud service providers.
In 2022, the EU continued its negotiation of legislative initiatives launched in 2021, such as the Artificial Intelligence Regulation or the amendment of the electronic identification and trust services for electronic transactions in the internal market (eIDAS) Regulation, which provided for the creation of digital identity wallets.
Regarding international data exchange, in 2020 the Court of Justice of the European Union invalidated the previous agreement ('Privacy Shield'), which allowed transfers of personal data between the EU and the United States. A preliminary agreement between the EU and the United States on a new framework for transatlantic data flows was reached in 2022.
This year, the entry of large digital platforms or 'Big Tech' into the financial sector continued to be a subject of debate for financial authorities around the world. At the global level, the BIS led a discussion on the need to introduce comprehensive regulation for these new providers and to strengthen coordination between authorities across sectors and countries. At the European level, the European Supervisory Authorities issued a report with recommendations to the Commission on how to approach the review of the regulatory and supervisory framework for the financial sector to ensure that it complies with the "same activity, same risk, same regulation" principle. For instance, it is recommended to review prudential consolidation requirements and consider the need for additional supervisory structures to ensure effective regulation and supervision of the new providers, which constitute mixed activity groups.
In 2022, the new European Digital Markets Act (DMA) was introduced. The statute establishes obligations for Big Tech platforms to prevent unfair or anti-competitive practices. Among other obligations, Big Tech must allow access and interoperability with software or hardware functions and provide effective portability of data generated by users.
In relation to the regulation of open banking or open finance, in Colombia the Unidad de Regulación Financiera has proposed new rules that will allow the implementation of a broad framework for the sharing of financial data, to be adopted on a voluntary basis. The regulator's work will focus on establishing security standards and requirements and setting the responsibilities of the actors.
At the European level, during 2022 the Commission held several consultations on the future open finance framework, for which a legislative proposal is expected in 2023.
The year 2022 has also been significant for the payments sector. The retail payments strategy published by the European Commission in 2020 aims to promote instant payments. To this end, the Commission proposed in October a new regulation that will allow users to initiate instant transfers from the same interfaces at the same cost as standard transfers. The Commission also consulted in 2022 on the future modification of the PSD2 payment services directive, which is expected in 2023.
Another area that attracted great attention from international bodies and national regulators in 2022 was that of crypto-assets. At the global level, the Basel Committee on Banking Supervision published in December the final standard on the prudential treatment of banks' exposures to cryptoassets. These were classified into two groups, with a specific regulatory treatment for each of them. In addition, a limit is imposed on the holding of certain cryptoassets. The FSB has proposed a framework for international regulation of cryptoasset activities, with broad recommendations for the regulation, supervision and oversight of their activities and markets and a review of the high-level recommendations specific to "global stablecoins". The objective is to address the associated financial stability risks more effectively.
At the European level, co-legislators reached a policy agreement on the regulation of cryptoassets (MiCA) on June 30, 2022. The final text is now in the process of being formally approved and will start to be implemented in 2024. The discussion covers the issuance of previously unregulated cryptoassets, in particular stablecoins, and the provision of cryptoasset-related services (e.g., custody or exchange).
As progress is made on the regulation of private virtual assets, central banks have intensified their analysis of central bank digital currencies (CBDCs). The European Central Bank initiated in October 2021 a two-year research program on a potential "digital euro", a CBDC for retail payments. In 2022, the ECB published a report confirming the first design options for the digital euro. The report covers the use cases the digital currency will need to satisfy, transfer mechanisms, online/offline availability, privacy, and tools to limit individual holdings of digital euros.
In parallel, the Commission conducted a consultation on the digital euro this year. It will present a legislative proposal in the second quarter of 2023 that will serve as the legal basis for the ECB's project.
Finally, a milestone this year in the world of cybersecurity in Europe has been the consensus among co-legislators on the text of the future Digital Operational Resilience Act (DORA). The statute will establish comprehensive control of providers, as well as a review of their risks, while setting the basis for the exchange of information related to cyber threats.
43 The EU Regulation 600/2014 on financial instrument markets regulates pre- and post-trade transparency in relation to competent authorities and investors, the requirements and obligations of data service providers, establishes the obligation to trade derivatives in trading venues and certain supervisory actions.
44 The Directive 2014/65/EU on markets in financial instruments, based on the improvement of the rules already adopted by MiFID, regulates the conditions of authorization and operation of Investment Services Companies (ISC), including the freedom of establishment and provision of services in the EU, as well as the activity of the companies from third countries; the conditions of authorization and operation of the regulated markets; the limitation of the positions and controls of the management of positions in derivatives on raw materials; the rules of conduct and investor protection to be followed by the ISCs; data provision services, and organizational and conduct requirements for market participants with the aim of improving investor protection.
3.1.3 Results
The BBVA Group generated a net attributable profit excluding non-recurring impacts of €6,621m in the year 2022, which represents an increase of 30.6% compared to the previous year, and the highest result ever. Including the non-recurring impacts, i.e. the net impact for an amount of €-201m from the purchase of offices in Spain from Merlin in June 2022 and €-416m from the results of discontinued operations corresponding to BBVA USA and the rest of the companies sold to PNC on June 1, 2021, together with the net cost related to the restructuring process of the same year, the net attributable profit increased by 38.0% in year-on-year terms to €6,420m.
CONSOLIDATED INCOME STATEMENT: QUARTERLY EVOLUTION (MILLIONS OF EUROS)
| 2022 | 2021 | |||||||
|---|---|---|---|---|---|---|---|---|
| 4Q | 3Q | 2Q | 1Q | 4Q | 3Q | 2Q | 1Q | |
| Net interest income | 5,342 | 5,261 | 4,602 | 3,949 | 3,978 | 3,753 | 3,504 | 3,451 |
| Net fees and commissions | 1,323 | 1,380 | 1,409 | 1,242 | 1,247 | 1,203 | 1,182 | 1,133 |
| Net trading income | 269 | 573 | 516 | 580 | 438 | 387 | 503 | 581 |
| Other operating income and expenses | (410) | (358) | (432) | (355) | (187) | (13) | (85) | (11) |
| Gross income | 6,524 | 6,857 | 6,094 | 5,416 | 5,477 | 5,330 | 5,104 | 5,155 |
| Operating expenses | (2,889) | (2,818) | (2,630) | (2,424) | (2,554) | (2,378) | (2,294) | (2,304) |
| Personnel expenses | (1,550) | (1,475) | (1,346) | (1,241) | (1,399) | (1,276) | (1,187) | (1,184) |
| Other administrative expenses | (1,001) | (1,005) | (944) | (870) | (850) | (788) | (800) | (812) |
| Depreciation | (338) | (338) | (340) | (313) | (305) | (314) | (307) | (309) |
| Operating income | 3,636 | 4,038 | 3,464 | 2,992 | 2,923 | 2,953 | 2,810 | 2,850 |
| Impairment on financial assets not measured at fair value through profit or loss | (998) | (940) | (704) | (737) | (832) | (622) | (656) | (923) |
| Provisions or reversal of provisions | (50) | (129) | (64) | (48) | (40) | (50) | (23) | (151) |
| Other gains (losses) | (6) | 19 | (3) | 20 | 7 | 19 | (7) | (17) |
| Profit (loss) before tax | 2,581 | 2,988 | 2,694 | 2,227 | 2,058 | 2,299 | 2,124 | 1,759 |
| Income tax | (856) | (1,004) | (697) | (904) | (487) | (640) | (591) | (489) |
| Profit (loss) for the period | 1,724 | 1,984 | 1,997 | 1,324 | 1,571 | 1,659 | 1,533 | 1,270 |
| Non-controlling interests | (147) | (143) | (120) | 3 | (230) | (259) | (239) | (237) |
| Net attributable profit (loss) excluding non-recurring impacts | 1,578 | 1,841 | 1,877 | 1,326 | 1,341 | 1,400 | 1,294 | 1,033 |
| Discontinued operations and Other (1) | — | — | (201) | — | — | — | (593) | 177 |
| Net attributable profit (loss) | 1,578 | 1,841 | 1,675 | 1,326 | 1,341 | 1,400 | 701 | 1,210 |
| Adjusted earning per share (euros) (2) | 0.25 | 0.29 | 0.30 | 0.21 | 0.19 | 0.20 | 0.18 | 0.14 |
| Earning (loss) per share (euros) (2) | 0.24 | 0.28 | 0.25 | 0.19 | 0.20 | 0.20 | 0.09 | 0.17 |
- (1) Include: (I) the net impact arisen from the purchase of offices in Spain in 2022 for €-201m; (II) the net costs related to the restructuring process in 2021 for €-696m; and (III) the profit (loss) generated by BBVA USA and the rest of the companies in the United States sold to PNC on June 1, 2021 for €+280m.
- (2) Adjusted by additional Tier 1 instrument remuneration. For more information, see Alternative Performance Measures at the end of this report.
CONSOLIDATED INCOME STATEMENT (MILLIONS OF EUROS)
| 2022 |
∆% |
∆% at constant exchange rates |
2021 |
|
|---|---|---|---|---|
| Net interest income | 19,153 | 30.4 | 35.8 | 14,686 |
| Net fees and commissions | 5,353 | 12.3 | 15.3 | 4,765 |
| Net trading income | 1,938 | 1.5 | 9.4 | 1,910 |
| Other operating income and expenses | (1,555) | n.s. | n.s. | (295) |
| Gross income | 24,890 | 18.2 | 22.9 | 21,066 |
| Operating expenses | (10,760) | 12.9 | 15.5 | (9,530) |
| Personnel expenses | (5,612) | 11.2 | 14.8 | (5,046) |
| Other administrative expenses | (3,820) | 17.6 | 19.1 | (3,249) |
| Depreciation | (1,328) | 7.6 | 8.4 | (1,234) |
| Operating income | 14,130 | 22.5 | 29.2 | 11,536 |
| Impairment on financial assets not measured at fair value through profit or loss | (3,379) | 11.4 | 12.9 | (3,034) |
| Provisions or reversal of provisions | (291) | 10.2 | 7.5 | (264) |
| Other gains (losses) | 30 | n.s. | n.s. | 2 |
| Profit (loss) before tax | 10,490 | 27.3 | 36.7 | 8,240 |
| Income tax | (3,462) | 56.9 | 66.0 | (2,207) |
| Profit (loss) for the period | 7,028 | 16.5 | 25.7 | 6,034 |
| Non-controlling interests | (407) | (57.8) | (30.3) | (965) |
| Net attributable profit (loss) excluding non-recurring impacts | 6,621 | 30.6 | 32.3 | 5,069 |
| Discontinued operations and Other (1) | (201) | (51.6) | (47.7) | (416) |
| Net attributable profit (loss) | 6,420 | 38.0 | 39.0 | 4,653 |
| Adjusted earning per share (euros) (2) | 1.05 | 0.71 | ||
| Earning (loss) per share (euros) (2) | 0.99 | 0.67 |
- (1) Include: (I) the net impact arisen from the purchase of offices in Spain in 2022 for €-201m; (II) the net costs related to the restructuring process in 2021 for €-696m; and (III) the profit (loss) generated by BBVA USA and the rest of the companies in the United States sold to PNC on June 1, 2021 for €+280m.
- (2) Adjusted by additional Tier 1 instrument remuneration. For more information, see Alternative Performance Measures at the end of this report.
The result attributed to the Group in the year 2022 includes the application to the Group's entities in Turkey of IAS 29, "Financial Reporting in Hyperinflationary Economies".45
Unless expressly indicated otherwise, to better understand the changes under the main headings of the Group's income statement, the year-on-year rates of change provided below refer to constant exchange rates. When comparing two dates or periods in this report, the impact of changes in the exchange rates against the euro of the currencies of the countries in which BBVA operates is sometimes excluded, assuming that exchange rates remain constant. For this purpose, the average exchange rate of the currency of each geographical area of the most recent period is used for both periods, except for those countries whose economies have been considered hyperinflationary, for which the closing exchange rate of the most recent period is used.
The accumulated net interest income as of December 31, 2022 was higher than the previous year (+35.8%), with increase in all business areas due to the improvement in customer spread and higher managed loan portfolio volumes. Particularly noteworthy was the good evolution in Mexico -especially- and, to a lesser extent, in South America and Turkey.
Positive evolution in the net fees and commissions line, which increased by 15.3% in the year due to favorable performance in payment systems and demand deposits.
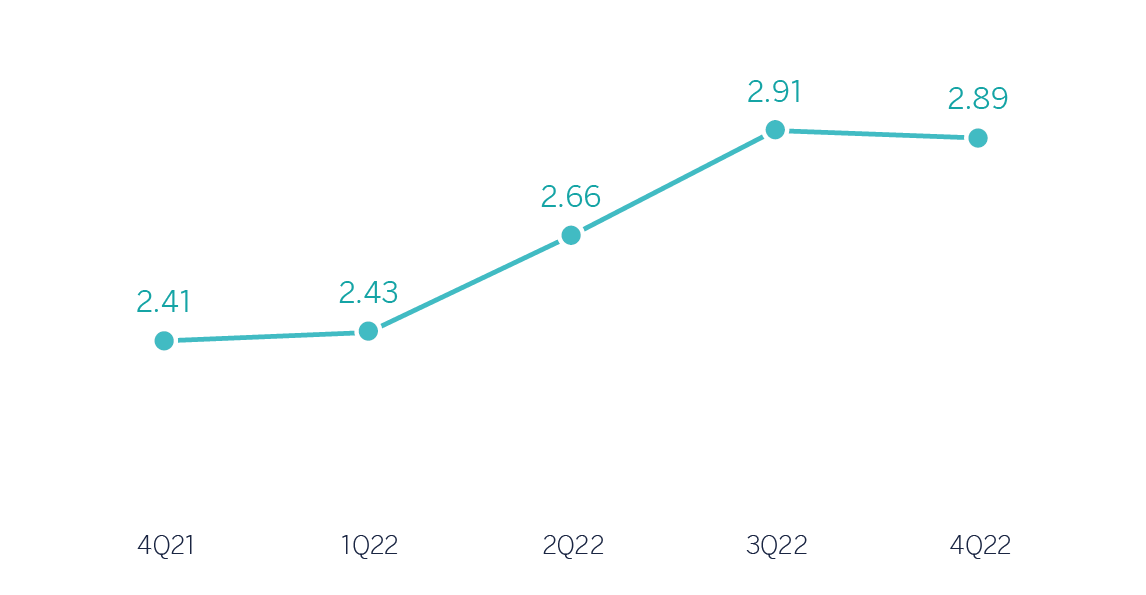
NET INTEREST INCOME / AVERAGE TOTAL ASSETS (PERCENTAGE)
NET INTEREST INCOME PLUS NET FEES AND COMMISSIONS (MILLIONS OF EUROS AT CONSTANT EXCHANGE RATES)
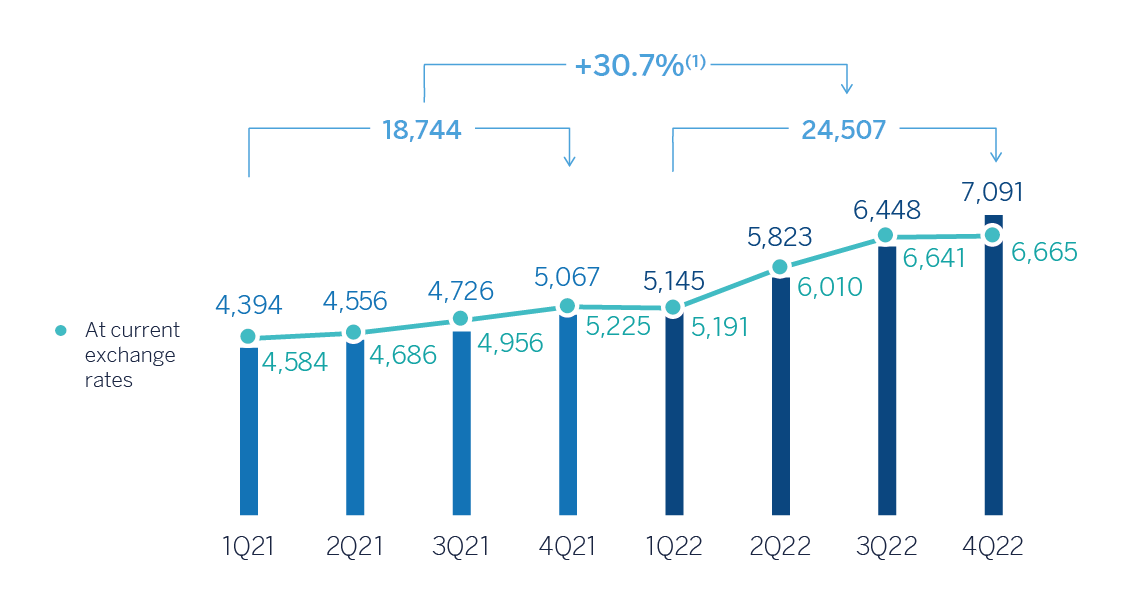
(1) At current exchange rates: +20.8%.
NTI recorded a year-on-year variation of +9.4% at the end of December 2022, with a positive trend in Turkey, South America, Spain and Mexico, which offset the lower results recorded in the Corporate Center due to the negative contribution of the foreign exchange hedging.
The other operating income and expenses line accumulated a result of €-1,555m as of December 31, 2022, compared to €-295m in the previous year, mainly due to the more negative adjustment for inflation in Argentina, the recording of this adjustment in the Group's entities in Turkey in 2022 and BBVA's higher contribution to the public deposit guarantee schemes, mainly in Spain.
GROSS INCOME (MILLIONS OF EUROS AT CONSTANT EXCHANGE RATES)
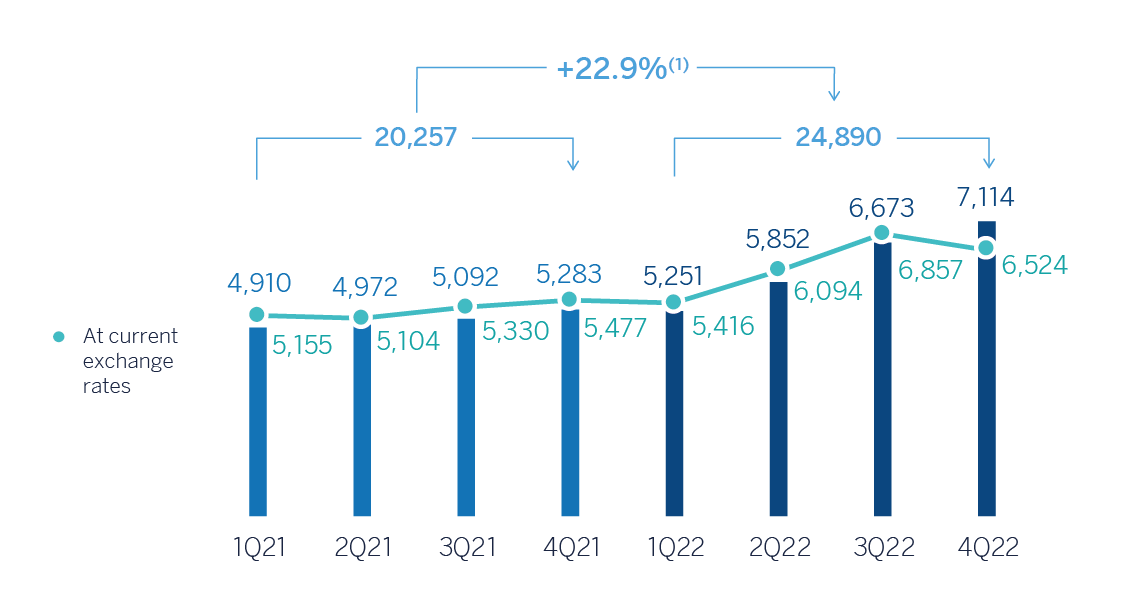
(1) At current exchange rates: +18.2%.
Year-on-year terms operating expenses increased at a pace of 15.5% at the Group level, below the average inflation rate in all countries in which BBVA operates. By areas, only Spain registered a year-on-year decrease as a result of the restructuring process in 2021.
Notwithstanding the above, thanks to the remarkable growth in gross income (+22.9%), the efficiency ratio stood at 43.2% as of December 31, 2022, with an improvement of 277 basis points compared to the ratio recorded 12 months earlier. By areas, Spain, Mexico and, to a lesser extent, South America recorded a favorable performance in terms of efficiency.
OPERATING EXPENSES (MILLIONS OF EUROS AT CONSTANT EXCHANGE RATES)
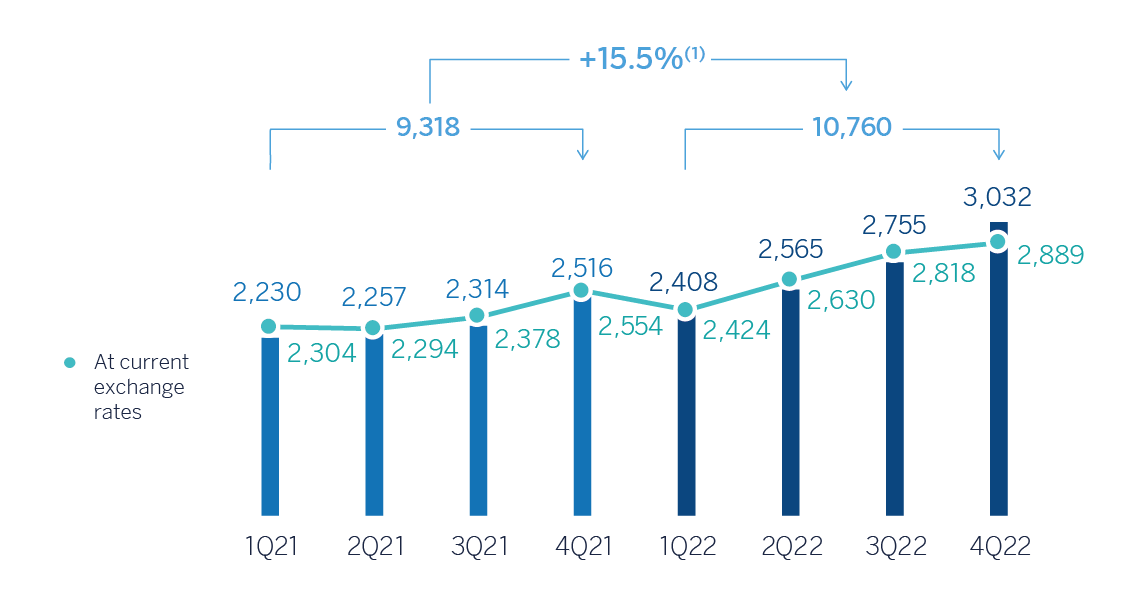
(1) At current exchange rates: +12.9%.
EFFICIENCY RATIO (PERCENTAGE)
Impairment on financial assets not measured at fair value through profit or loss (impairment on financial assets) was 12.9% higher at the end of December 2022 than in the previous year, with higher credit impairments especially in South America and Turkey.
OPERATING INCOME (MILLIONS OF EUROS AT CONSTANT EXCHANGE RATES)
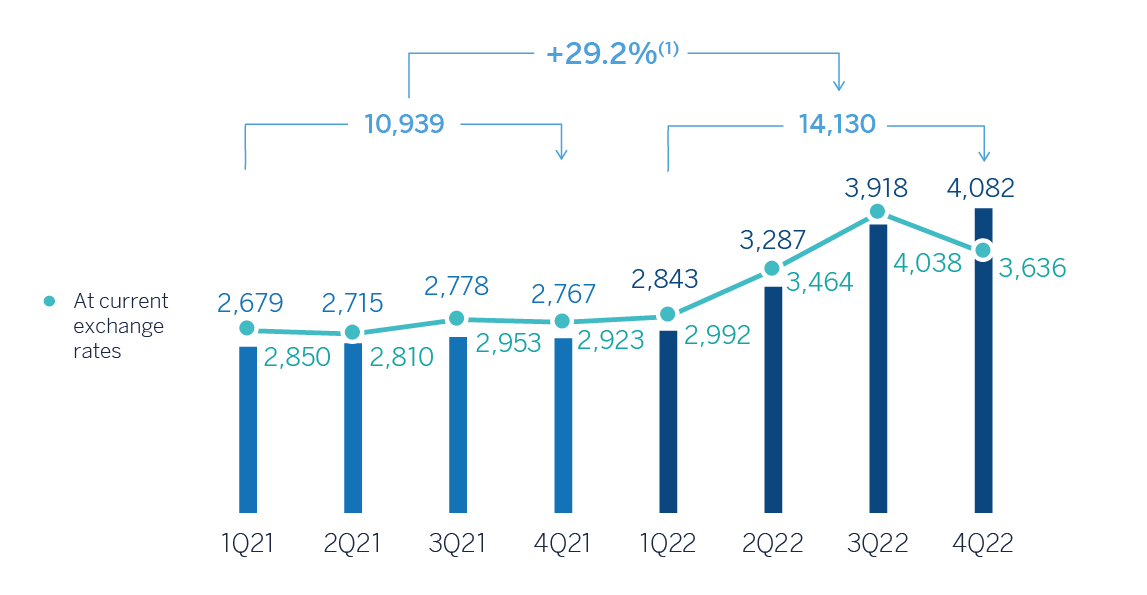
(1) At current exchange rates: +22.5%.
IMPAIRMENT ON FINANCIAL ASSETS (MILLIONS OF EUROS AT CONSTANT EXCHANGE RATES)
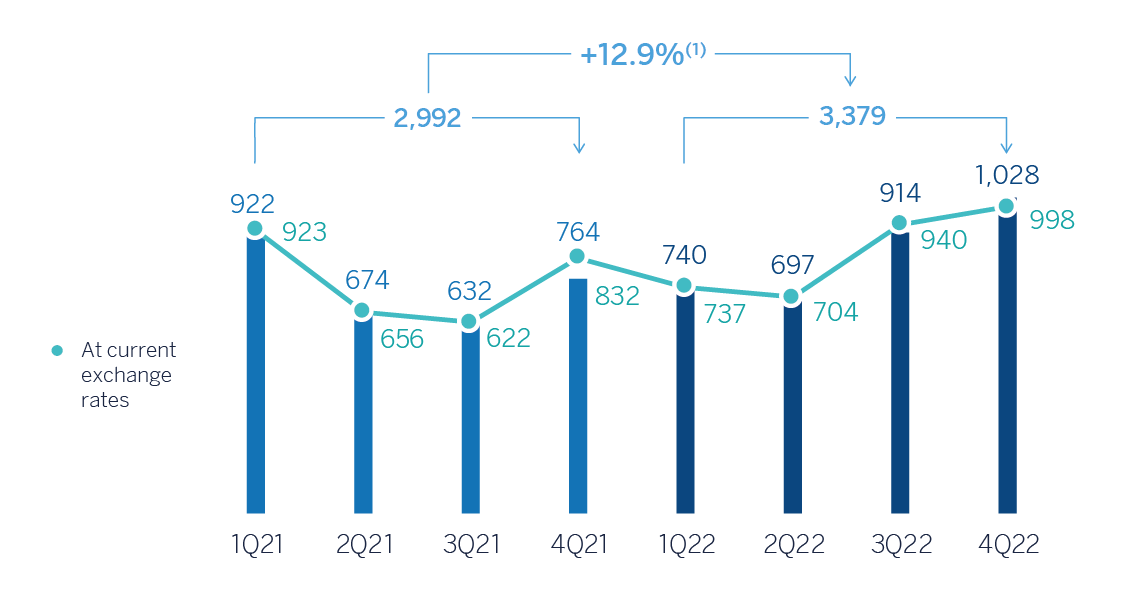
(1) At current exchange rates: +11.4%.
The provisions or reversal of provisions line (hereinafter, provisions) accumulated a negative balance of €291m as of December 31, 2022, 7.5% above the accumulated figure in the previous year mainly due to provisions for risks and contingent commitments in Turkey.
For its part, the other gains (losses) line closed December 2022 with a balance of €30m, which compares positively to the figure reached the previous year (€2m), mainly in Spain and Turkey.
As a result of the above, the BBVA Group generated a net attributable profit, excluding non-recurring impacts, of €6,621m in the year 2022, representing a year-on-year increase of +32.3%. Taking into account the non-recurring impacts, registered within the line "Discontinued operations and Other," that is: (I) €-201m recorded in the second quarter of 2022 for the purchase of offices in Spain; (II) €+280m for the results generated by BBVA USA and the rest of the companies sold to PNC on June 1, 2021; and (III) €-696m of the net costs associated with the restructuring process recorded in the second quarter of 2021, the cumulative net attributable profit of the Group at the end of December 2022 stood at €6,420m, 39.0% higher than that achieved in the year 2021.
The cumulative net attributable profits, in millions of euros, at the end of December 2022 for the business areas that compose the Group were as follows: €1,678m in Spain, €4,182m in Mexico, €509m in Turkey, €734m in South America and €240m in Rest of Business.
NET ATTRIBUTABLE PROFIT (LOSS) (MILLIONS OF EUROS AT CONSTANT EXCHANGE RATES)
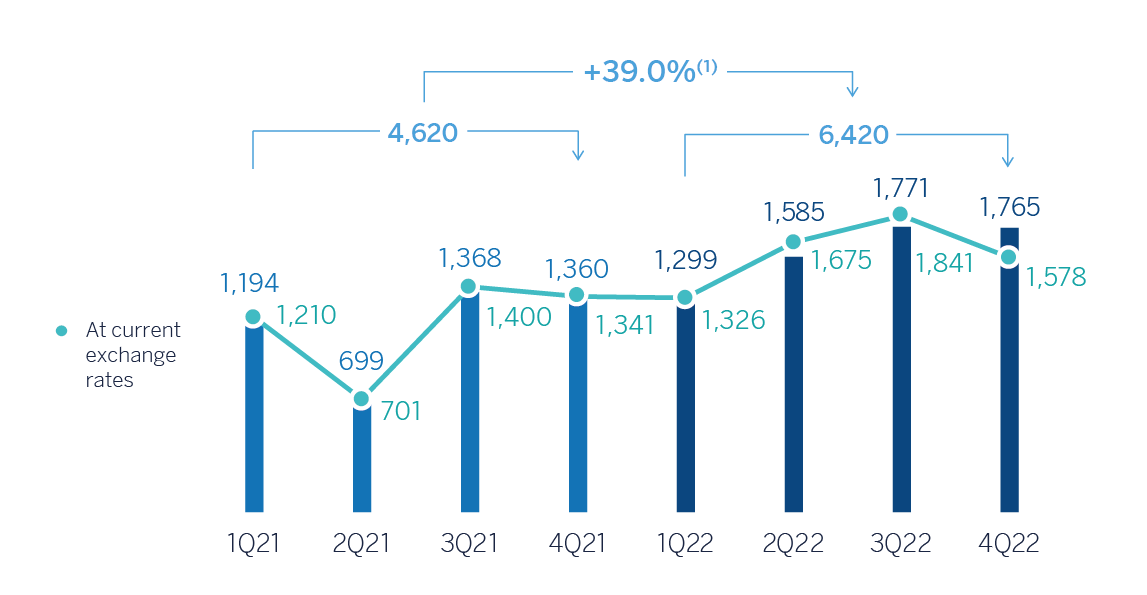
At current exchange rates: +38.0%.
NET ATTRIBUTABLE PROFIT (LOSS) EXCLUDING NONRECURRING IMPACTS (MILLIONS OF EUROS AT CONSTANT EXCHANGE RATES)
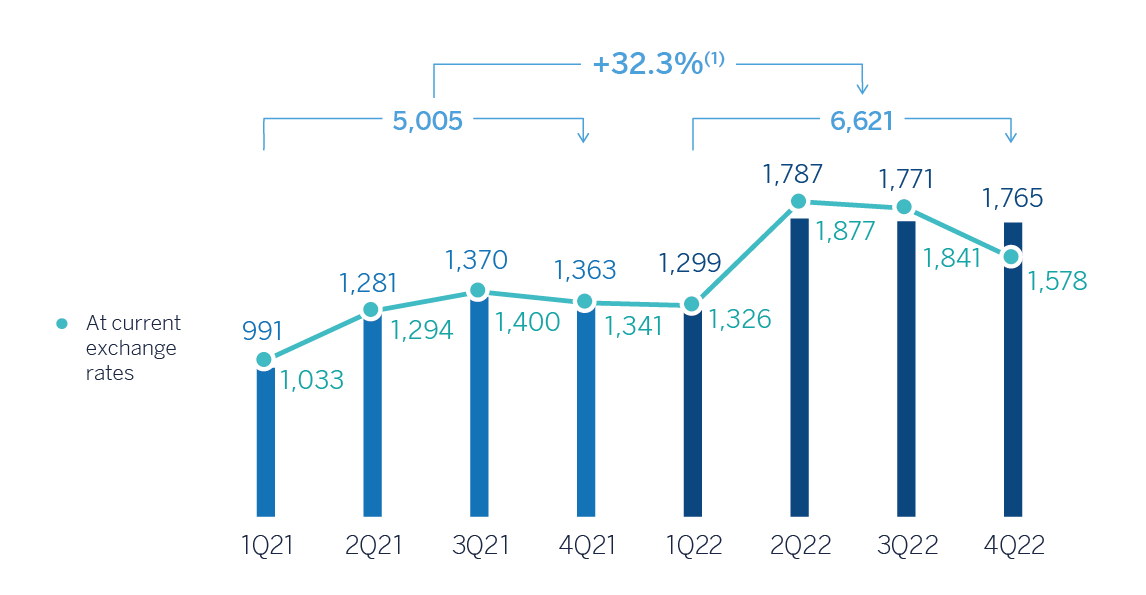
General note: non-recurring impacts include the net impact arisen from the purchase of offices in Spain in 2Q22, BBVA USA and the rest of the companies in the United States sold to PNC on June 1, 2021 for the periods 1Q21 and 2Q21 and the net cost related to the restructuring process in 2Q21.
(1) At current exchange rates: +30.6%.
The Group's excellent performance in 2022 has also allowed it to accelerate value creation, as reflected in the growth of the tangible book value and dividends, which at year-end 2022 was 19.5% above the previous year.
TANGIBLE BOOK VALUE PER SHARE (1) AND DIVIDENDS (EUROS)
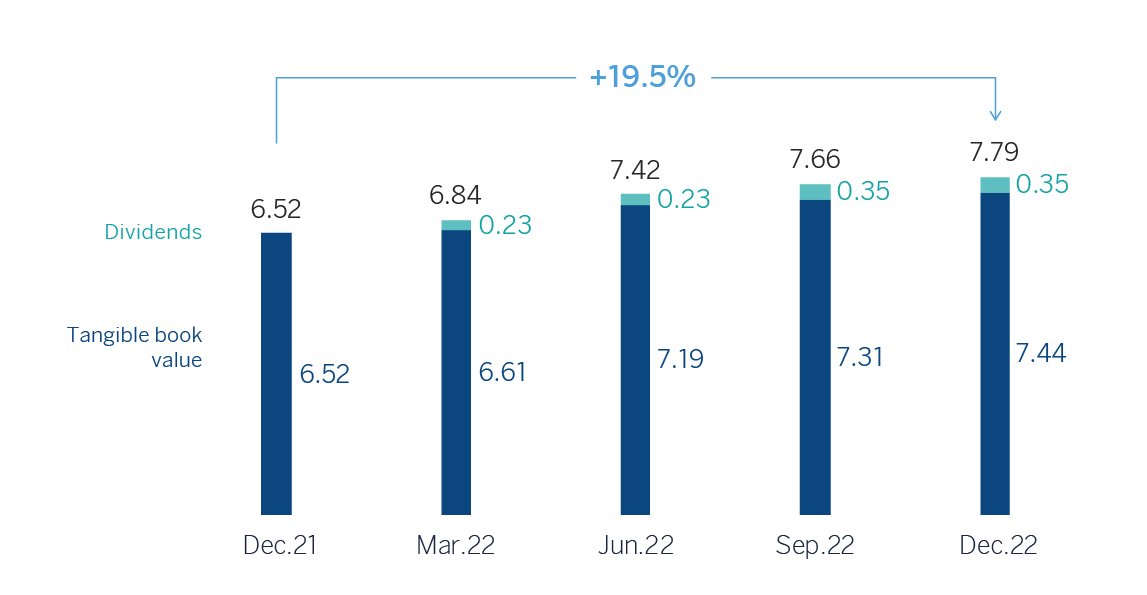
General note: replenishing dividends paid in the period.
ADJUSTED EARNING (LOSS) PER SHARE (2) AND EARNING (LOSS) PER SHARE (2) (EUROS)
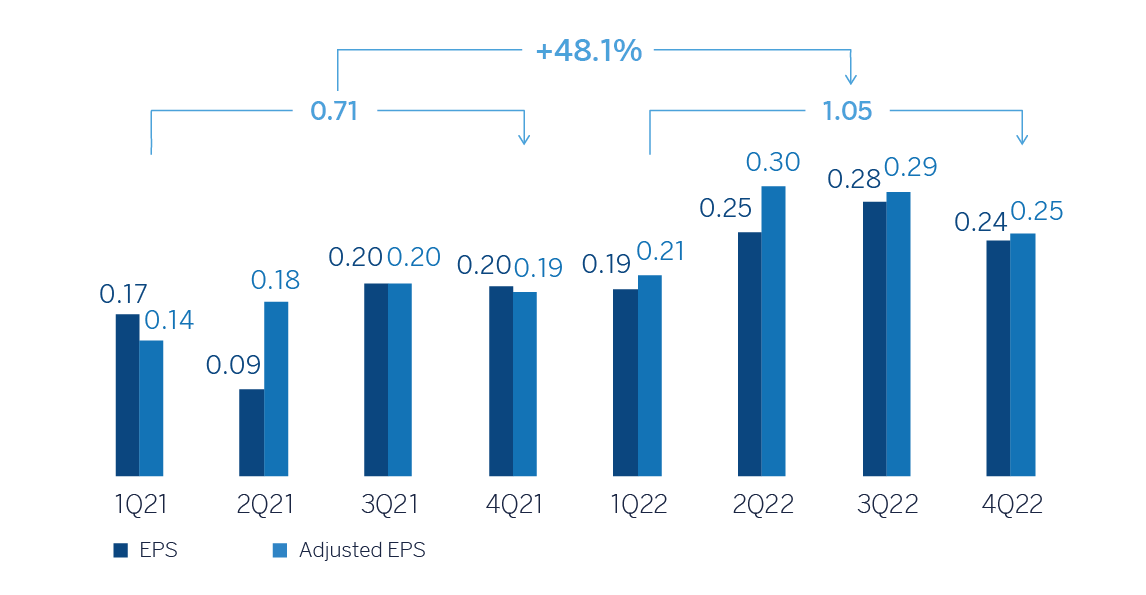
General note: adjusted earning per share excludes: (I) the net impact arisen from the purchase of offices in Spain in 2Q22; (II) the net cost related to the restructuring process for the period 2Q21; and (III) the profit (loss) after tax from discontinued operations derived from the sale of BBVA USA and the rest of the companies in the United States to PNC on June 1, 2021 for the periods 1Q21 and 2Q21.
(1) For more information, see Alternative Performance Measures at the end of this report.
(2) Adjusted by additional Tier 1 instrument remuneration. For more information, see Alternative Performance Measures at the end of this report.
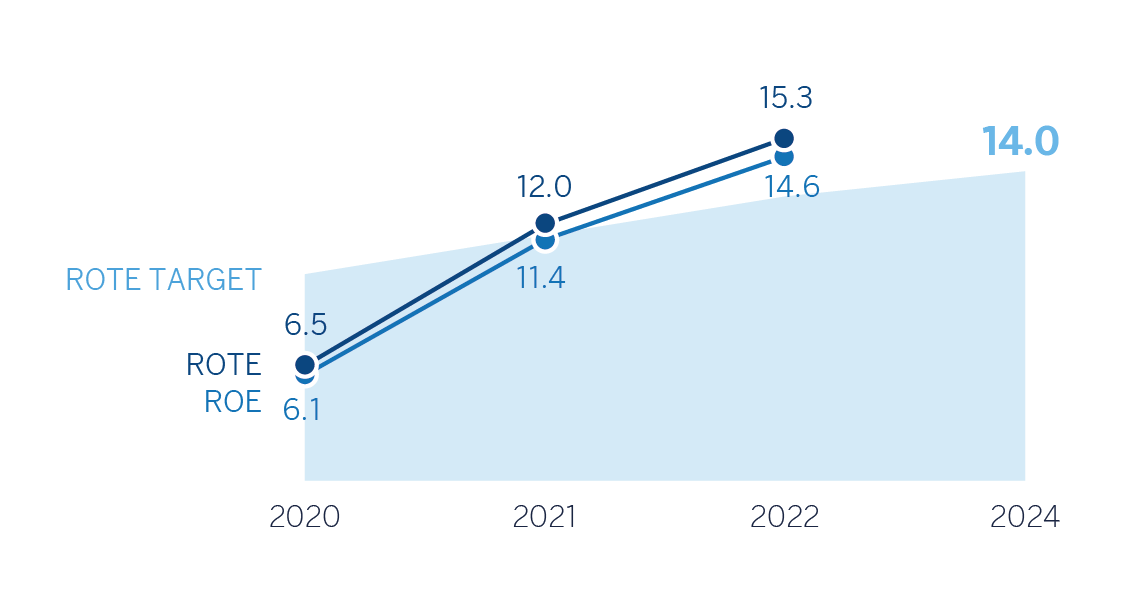
The Group’s profitability indicators improved in year-on-year terms, supported by the favorable performance of results.
ROE AND ROTE (1) (PERCENTAGE)
ROA AND RORWA (1) (PERCENTAGE)
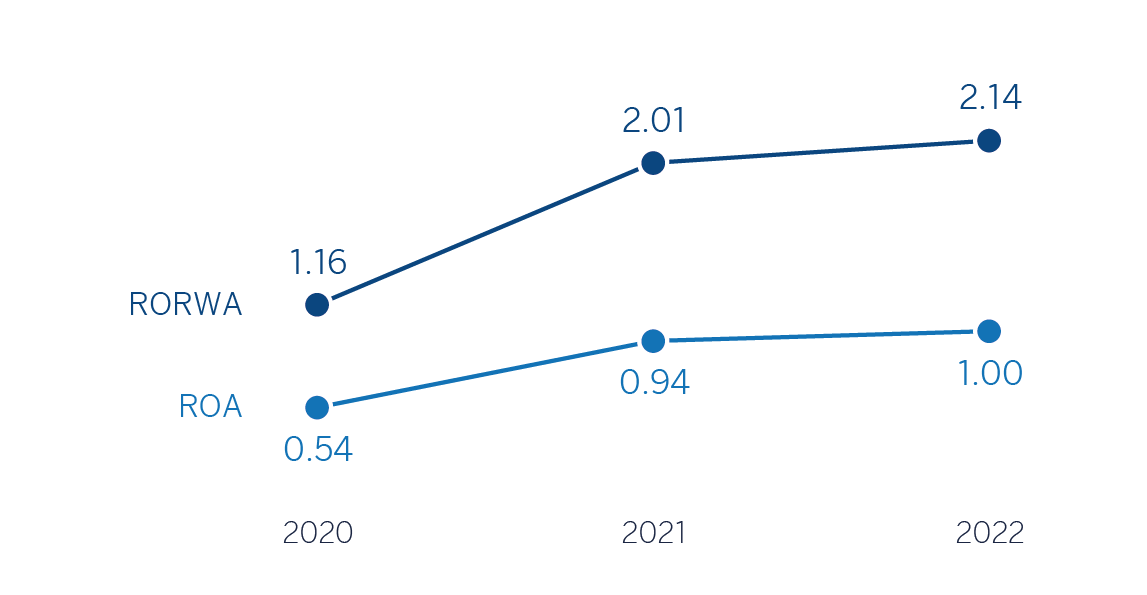
(1) Excludes the net impact arisen from the purchase of offices in Spain in 2022, the net cost related to the restructuring process in 2021, the net capital gains from the bancassurance transaction with Allianz in 2020, and the resuls generated by BBVA USA and the rest of the companies in the United States sold to PNC on June 1, 2021 for the periods 2021 and 2020.
45 IAS 29 has not been applied to operations outside Turkey, in particular to the financial statements of Garanti Bank in Romania and Garanti Bank International N.V. in the Netherlands.
3.1.4 Balance sheet and business activity
The most relevant aspects related to the evolution of the Group's balance sheet and business activity as of December 31, 2022 are summarized below:
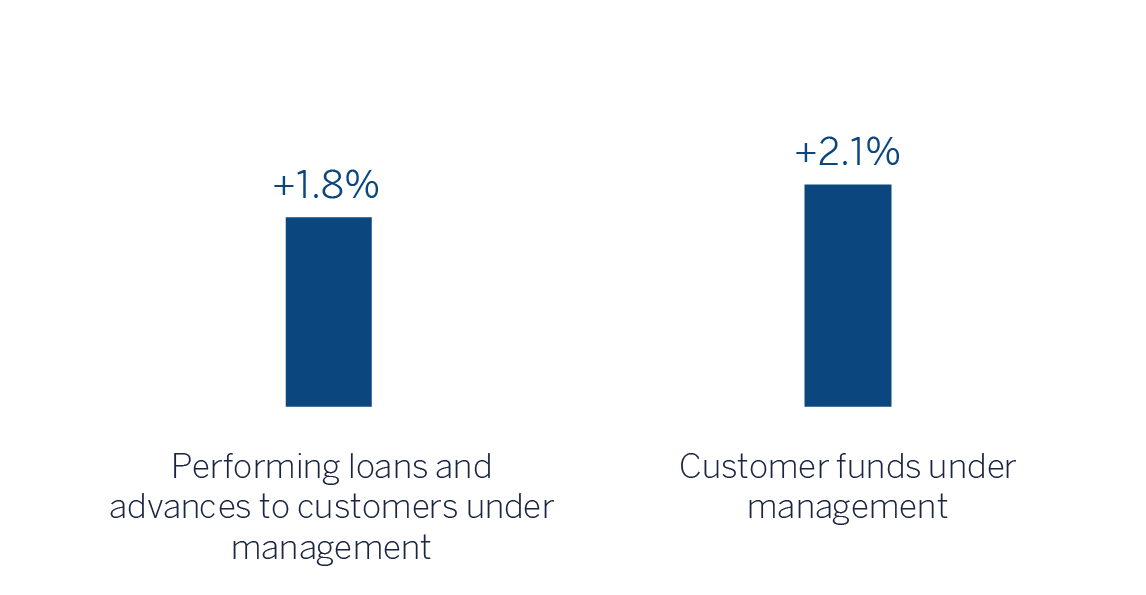
- Loans and advances to customers grew by 12.3% compared to the end of December 2021, strongly favored by the evolution of business loans (+18.8%) in all business areas and, to a lesser extent, by the performance of retail loans (+7.5% at Group level), in particular, in Mexico and Turkey, supported by the good performance of consumer loans as well as credit cards (+21.7% overall at Group level) and, to a lesser extent, mortgage loans (+0.8% at Group level) due to the positive evolution in Mexico.
- Customer funds increased by 9.5% compared to the end of December 2021, thanks to the good performance of customer deposits, which increased in all geographical areas, with increase in both demand deposits and time deposits. For its part, off-balance sheet funds increased by 2.0% in the year 2022, with the most notable growth in mutual funds in Mexico and Turkey.
CONSOLIDATED BALANCE SHEET (MILLIONS OF EUROS)
| 31-12-22 | ∆% | 31-12-21 | |
|---|---|---|---|
| Cash, cash balances at central banks and other demand deposits | 79,756 | 17.6 | 67,799 |
| Financial assets held for trading | 110,671 | (10.4) | 123,493 |
| Non-trading financial assets mandatorily at fair value through profit or loss | 6,888 | 13.2 | 6,086 |
| Financial assets designated at fair value through profit or loss | 913 | (16.4) | 1,092 |
| Financial assets at fair value through accumulated other comprehensive income | 58,980 | (2.4) | 60,421 |
| Financial assets at amortized cost | 422,061 | 13.3 | 372,676 |
| Loans and advances to central banks and credit institutions | 20,431 | 7.8 | 18,957 |
| Loans and advances to customers | 358,023 | 12.3 | 318,939 |
| Debt securities | 43,606 | 25.4 | 34,781 |
| Investments in subsidiaries, joint ventures and associates | 916 | 1.7 | 900 |
| Tangible assets | 8,737 | 19.7 | 7,298 |
| Intangible assets | 2,156 | (1.9) | 2,197 |
| Other assets | 22,062 | 5.4 | 20,923 |
| Total assets | 713,140 | 7.6 | 662,885 |
| Financial liabilities held for trading | 95,611 | 4.9 | 91,135 |
| Other financial liabilities designated at fair value through profit or loss | 10,580 | 9.3 | 9,683 |
| Financial liabilities at amortized cost | 528,629 | 8.3 | 487,893 |
| Deposits from central banks and credit institutions | 65,258 | (2.9) | 67,185 |
| Deposits from customers | 393,856 | 12.6 | 349,761 |
| Debt certificates | 55,429 | (0.6) | 55,763 |
| Other financial liabilities | 14,086 | (7.2) | 15,183 |
| Liabilities under insurance and reinsurance contracts | 11,848 | 9.0 | 10,865 |
| Other liabilities | 15,858 | 9.0 | 14,549 |
| Total liabilities | 662,526 | 7.9 | 614,125 |
| Non-controlling interests | 3,624 | (25.3) | 4,853 |
| Accumulated other comprehensive income | (17,432) | 5.8 | (16,476) |
| Shareholders’ funds | 64,422 | 6.7 | 60,383 |
| Total equity | 50,615 | 3.8 | 48,760 |
| Total liabilities and equity | 713,140 | 7.6 | 662,885 |
| Memorandum item: | |||
| Guarantees given | 55,182 | 20.1 | 45,956 |
LOANS AND ADVANCES TO CUSTOMERS (MILLIONS OF EUROS)
| 31-12-22 | ∆% | 31-12-21 | |
|---|---|---|---|
| Public sector | 20,884 | 6.2 | 19,656 |
| Individuals | 157,432 | 7.5 | 146,433 |
| Mortgages | 92,064 | 0.8 | 91,324 |
| Consumer | 36,116 | 16.4 | 31,026 |
| Credit cards | 17,382 | 34.4 | 12,936 |
| Other loans | 11,870 | 6.5 | 11,146 |
| Business | 177,451 | 18.8 | 149,309 |
| Non-performing loans | 13,493 | (7.9) | 14,657 |
| Loans and advances to customers (gross) | 369,260 | 11.9 | 330,055 |
| Allowances (1) | (11,237) | 1.1 | (11,116) |
| Loans and advances to customers | 358,023 | 12.3 | 318,939 |
- (1) Allowances include valuation adjustments for credit risk throughout the expected residual life in those financial instruments that have been acquired (mainly originating from the acquisition of Catalunya Banc, S.A.). As of December 31, 2022 and December 31, 2021, the remaining amount was €190m and €266m, respectively.
LOANS AND ADVANCES TO CUSTOMERS (BILLIONS OF EUROS)
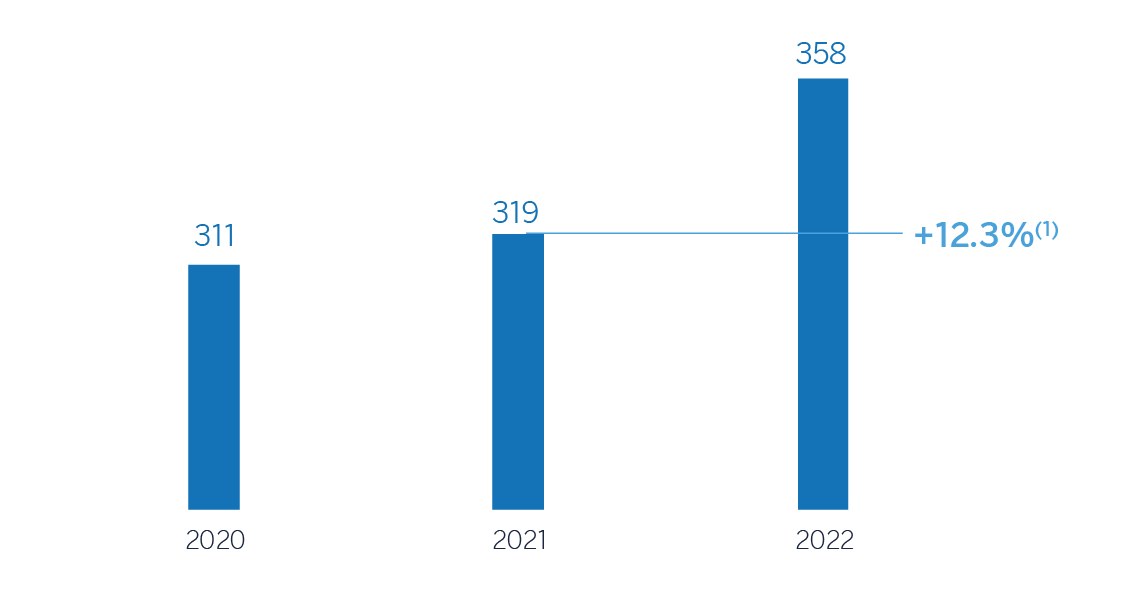
General Note: 2020 excludes BBVA USA and the rest of companies in the United States sold to PNC on June 1, 2021 and BBVA Paraguay.
(1) At constant exchange rates: +12.8%.
CUSTOMER FUNDS (BILLIONS OF EUROS)
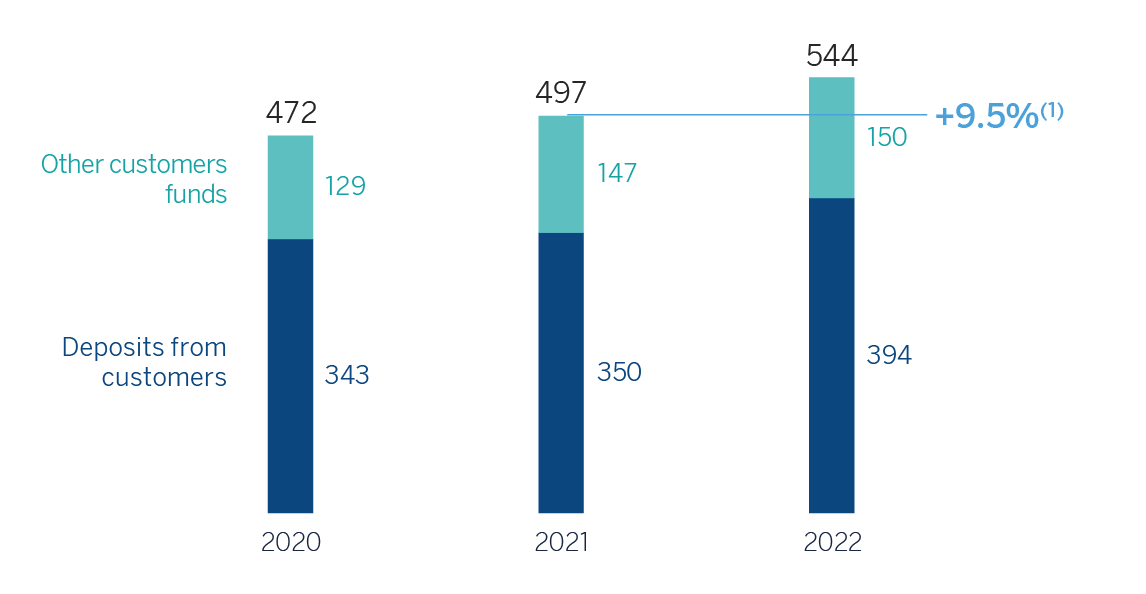
General Note: 2020 excludes BBVA USA and the rest of companies in the United States sold to PNC on June 1, 2021 and BBVA Paraguay.
(1) At constant exchange rates: +9.7%.
CUSTOMER FUNDS (MILLIONS OF EUROS)
| 31-12-22 | ∆% | 31-12-21 | |
|---|---|---|---|
| Deposits from customers | 393,856 | 12.6 | 349,761 |
| Current accounts | 316,082 | 7.9 | 293,015 |
| Time deposits | 75,098 | 36.4 | 55,059 |
| Other deposits | 2,676 | 58.6 | 1,687 |
| Other customer funds | 150,172 | 2.0 | 147,192 |
| Mutual funds and investment companies and customer portfolios (1) | 108,936 | 2.5 | 106,235 |
| Pension funds | 38,653 | (0.3) | 38,763 |
| Other off-balance sheet funds | 2,582 | 17.7 | 2,195 |
| Total customer funds | 544,028 | 9.5 | 496,954 |
- (1) Includes the customer portfolios in Spain, Mexico, Colombia and Peru.
3.1.5 Solvency
Capital base
As of December 31, 2022, the Common Equity Tier 1 (CET1) fully-loaded ratio stood at 12.61% which represented a reduction of -14 basis points with respect to 2021, with the CET1 phased-in ratio at 12.68%, which represented a reduction of -30 basis points with respect to 2021. The difference between the CET1 fully-loaded ratio and the CET1 phased-in ratio is mainly explained by the effect of the transitory adjustments for the treatment in the solvency ratios of the impacts of IFRS 9.
These fully-loaded ratios include the effect of the corporate transactions carried out during the year, with a combined impact of -38 basis points of CET1. These operations are the agreement reached with Neon Payments Limited in the first quarter of 2022, the voluntary takeover bid for Garanti BBVA and the acquisition of 100% of Tree from Merlin in the second quarter of 2022 (see Note 3 and 17). In addition, these ratios include the positive impact of the partial reversion of the share buyback program, as well as the offsetting in equity of the effects of hyperinflation on earnings. Excluding these impacts during the year, the organic generation of profits, net of shareholder remuneration and payments made in respect of BBVA’s contingent convertible bonds (CoCos), contributed by +106 basis points to the CET1 ratio and offset the increase in RWAs, the market evolution as well as the supervisory effects.
Fully-loaded risk-weighted assets (RWAs) increased by approximately €30,000 million, mainly as a result of organic generation and the supervisory effects abovementioned.
The fully-loaded additional Tier 1 capital ratio (AT1) stood at 1.54% (1.54% phased-in) at December 31, 2022, which included a reduction of €500 million due to the early redemption of a series of CoCos issued in 2017.
The fully-loaded Tier 2 ratio stood at 1.79%, which represents a reduction of -58 basis points compared to December 31, 2021, mainly explained by the RWA growth during the year as well as the reduction in the computability of provisions from internal credit models. The phased-in Tier 2 ratio stood at 1.76%. The difference with the fully-loaded Tier 2 ratio relates mainly to the transitional treatment of certain subordinated issuances.
Regarding the minimum capital requirements, the ECB informed the Group that the Pillar 2 requirement would remain at 1.5% (of which at least 0.84% must be CET1) since March 1, 2022. Therefore, BBVA should maintain a CET1 capital ratio of 8.60% and a total capital ratio of 12.76% at a consolidated level, which once updated taking into account the countercyclical buffer as of December 31, 2022, are 8.63% and 12.79%, respectively).
In addition, after the latest SREP (Supervisory Review and Evaluation Process) decision, applicable as from January 1, 2023, the ECB has informed the Group that it must maintain a total capital ratio of 13.00% and a CET1 capital ratio of 8.75% at the consolidated level, which include the consolidated Pillar 2 requirement of 1.71% (at least 0.96% must be CET1), of which 0.21% (0.12% must be CET1) is determined on the basis of the ECB's prudential provisioning expectation which, as of January 1, 2023, will no longer be treated as a deduction from CET1, with a 19 basis points positive effect on fully-loaded CET1 ratio as of December 31, 2022 to place it at 12.80% proforma.
As result of the above, the total fully-loaded capital ratio stood at 15.94% as of December 31, 2022, and the total phased-in ratio stood at 15.98%.
FULLY-LOADED CAPITAL RATIOS (PERCENTAGE)
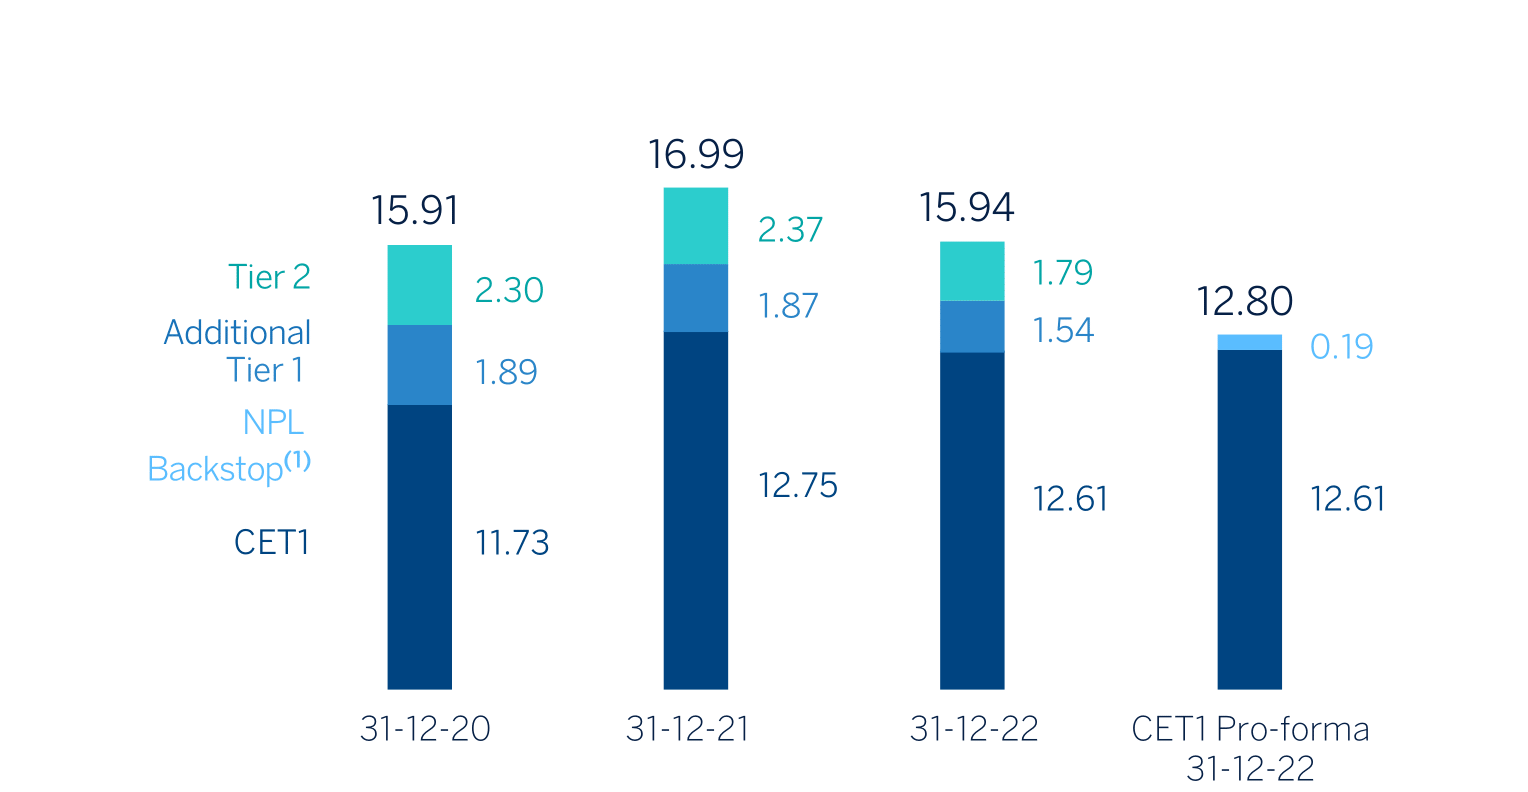
(1) Includes the reversal of the NPL Backstop.
CAPITAL BASE (MILLIONS OF EUROS)
| CRD IV phased-in | CRD IV fully-loaded | |||||
|---|---|---|---|---|---|---|
| 31-12-22 (1) (2) | 31-12-21 | 31-12-20 | 31-12-22 (1) (2) | 31-12-21 | 31-12-20 | |
| Common Equity Tier 1 (CET 1) | 42,740 | 39,949 | 42,931 | 42,486 | 39,184 | 41,345 |
| Tier 1 | 47,933 | 45,686 | 49,597 | 47,678 | 44,922 | 48,012 |
| Tier 2 | 5,930 | 7,383 | 8,547 | 6,023 | 7,283 | 8,101 |
| Total Capital (Tier 1 + Tier 2) | 53,863 | 53,069 | 58,145 | 53,701 | 52,205 | 56,112 |
| Risk-weighted assets | 337,102 | 307,795 | 353,273 | 336,920 | 307,335 | 352,622 |
| CET1 (%) | 12.68 | 12.98 | 12.15 | 12.61 | 12.75 | 11.73 |
| Tier 1 (%) | 14.22 | 14.84 | 14.04 | 14.15 | 14.62 | 13.62 |
| Tier 2 (%) | 1.76 | 2.40 | 2.42 | 1.79 | 2.37 | 2.30 |
| Total capital ratio (%) | 15.98 | 17.24 | 16.46 | 15.94 | 16.99 | 15.91 |
- (1) As of December 31, 2022, the difference between the phased-in and fully-loaded ratios arises from the temporary treatment of certain capital items, mainly of the impact of IFRS 9, to which the BBVA Group has adhered voluntarily (in accordance with article 473bis of the CRR and the subsequent amendments introduced by the Regulation (EU) 2020/873).
- (2) Preliminary data.
Regarding MREL (Minimum Requirement for Own Funds and Eligible Liabilities) requirements, on March 8, 2022, the Bank announced that it had received a communication from the Bank of Spain of its minimum level of own funds and eligible liabilities requirement (MREL), as determined by the Single Resolution Board (SRB), repealing and superseding the previous MREL requirement communicated in May 2021.
In accordance with this new MREL communication, BBVA has to reach, by January 1, 2022, a volume of own funds and eligible liabilities equal to 21.46% of the total RWAs of its resolution group (the "MREL in RWAs"), of which 13.5% of the total RWAs of BBVA’s resolution group has to be fulfilled with subordinated instruments (the "MREL RWAs subordination requirement"). The MREL in RWAs and the MREL in RWAs subordination requirement do not include the combined capital buffer requirement which, according to applicable regulations and supervisory criteria, is currently 3.26% (setting the MREL in RWAs including the combined capital buffer requirement at 24.72% and the MREL in RWAs subordination requirement including the combined capital buffer requirement at 16.76%). As of December 31, 2022 BBVA met the MREL in RWAs requirement, being this ratio 26.45%. Finally, as of December 31, 2022, the MREL in Leverage Ratio (LR) is 11.14% and the subordination ratios in terms of RWA and in terms of LR were 21.74% and 9.16%, respectively.
With the aim of reinforcing compliance with these requirements, BBVA has made some debt issues during 2022. For more information about these issues, see "Structural risks" section within the "4. Risk management" chapter.
In November 2015 (with effect from 1 January 2017) BBVA ceased to be part of the list of Global Systemically Important Banks (G-SIBs). This list is drawn up annually by the Financial Stability Board (FSB) on the basis of a set of quantitative indicators which are available, together with the assessment methodology, at www.bis.org/bcbs/gsib/. In November 2021, BBVA, at consolidated level, was again identified as an Other Systemically Important Institution (hereinafter referred to as O-SII) by the Bank of Spain, which imposes on BBVA the obligation to maintain Common Equity Tier 1 items as a buffer for O-SII for an amount equal to 0,75% of the total amount of its risk exposure on a consolidated basis. After the update of the list of institutions in November 2022, BBVA remains identified as O-SII. Similarly, following the mandatory annual review in July 2022 of the designations of the so-called O-SIIs, the Bank of Spain continues to require BBVA to maintain a capital buffer of 0.75% in 2023.
Lastly, as of December 31, 2022, the Group's fully-loaded leverage ratio stood at 6.5% (6,5% phased-in). 46
Ratings
During the year 2022, BBVA’s rating has continued to show its strength and all agencies have maintained their rating in the A category. In March, S&P changed the outlook of BBVA's rating from negative to stable (affirming the rating at A), after taking a similar action in the Spanish sovereign rating. Following the periodic reviews of BBVA, Fitch and DBRS Morningstar affirmed their ratings at A- (May and December) and A (high) (March), respectively, both with a stable outlook. For its part, Moody's has kept BBVA's rating unchanged in the period at A3 (with a stable outlook). The following table shows the credit ratings and outlook assigned by the agencies:
RATINGS
| Rating agency | Long term (1) | Short term | Outlook |
|---|---|---|---|
| DBRS | A (high) | R-1 (middle) | Stable |
| Fitch | A- | F-2 | Stable |
| Moody’s | A3 | P-2 | Stable |
| Standard & Poor’s | A | A-1 | Stable |
(1) Ratings assigned to long term senior preferred debt. Additionally, Moody’s and Fitch assign A2 and A- rating, respectively, to BBVA’s long term deposit.
46 The Group’s leverage ratio is provisional at the date of release of this report. On April, 1st 2022 ended the period of temporary exclusion of certain positions with central banks.
3.1.6 The BBVA share
The main stock market indexes showed a positive performance in 2022. In Europe, the Stoxx Europe 600 index decreased by 12.9% compared to the end of December of the previous year, and in Spain the Ibex 35 declined by 5.6% in the same period, showing a worse relative performance. In the United States, the S&P 500 index also decreased by 19.4%.
With regard to the banking sector indexes, their performance in 2022 was better than the general indexes in Europe. The Stoxx Europe 600 Banks index, which includes the banks in the United Kingdom, and the Euro Stoxx Banks, an index of Eurozone banks, decreased by 3.2% and 4.6% respectively, meanwhile in The United States, the S&P Regional Banks sectoral index decreased by 17.0% in the period.
For its part, the BBVA share price increased by 7.3% in the year,above its sector index, closing December 2022 at €5.63.
BBVA SHARE EVOLUTION Compared with European indexes (Base index 100=31-12-21)
BBVA
EUROSTOXX-50
EUROSTOXX BANKS
The BBVA share and share performance ratios
THE BBVA SHARE AND SHARE PERFORMANCE RATIOS
| 31-12-22 | 31-12-21 | |
|---|---|---|
| Number of shareholders | 801,216 | 826,835 |
| Number of shares issued | 6,030,116,564 | 6,667,886,580 |
| Daily average number of shares traded | 22,956,058 | 22,901,565 |
| Daily average trading (millions of euros) | 115 | 118 |
| Maximum price (euros) | 6.12 | 6.29 |
| Minimum price (euros) | 3.97 | 3.74 |
| Closing price (euros) | 5.63 | 5.25 |
| Book value per share (euros) (1) | 7.80 | 6.86 |
| Tangible book value per share (euros) (1) | 7.44 | 6.52 |
| Market capitalization (millions of euros) | 33,974 | 35,006 |
| Yield (dividend/price; %) (2) | 6.2 | 2.6 |
(1) Considering 112 million shares acquired within the share buyback program between November 22 and December 31 of 2021 and the estimated shares pending from buyback program as of December 31, 2021 of the first tranche approved by the Board of Directors in October 2021 (€1,500m), in process at the end of the year 2021.
(2) Calculated by dividing shareholder remuneration over the last twelve months by the closing price of the period.
SHAREHOLDER STRUCTURE (31-12-22)
| Shareholders | Shares issued | |||
|---|---|---|---|---|
| Numbers of shares | Number | % | Number | % |
| Up to 500 | 330,991 | 41.3 | 61,765,540 | 1.0 |
| 501 to 5,000 | 367,730 | 45.9 | 653,340,057 | 10.8 |
| 5,001 to 10,000 | 55,066 | 6.9 | 387,127,400 | 6.4 |
| 10,001 to 50,000 | 42,731 | 5.3 | 815,962,950 | 13.5 |
| 50,001 to 100,000 | 3,014 | 0.4 | 205,137,227 | 3.4 |
| 100,001 to 500,000 | 1,401 | 0.2 | 251,980,588 | 4.2 |
| More than 500,001 | 283 | 0.0 | 3,654,802,802 | 60.6 |
| Total | 801,216 | 100.0 | 6,030,116,564 | 100.0 |
Share buyback program
Regarding the share buyback program started by the Entity in 2021, on August 19, 2022 BBVA announced the end of the execution of its share buyback program once the maximum number of shares established in the terms and conditions announced on November 19, 2021 had been reached. Thus, the Bank has successfully concluded its share buyback program, having acquired a total of 637,770,016 shares, for an amount of €3,160m.
The share buyback program highlights are summarized below. For more information, see Note 4 “Shareholder remuneration system” of the attached Consolidated Financial Statements.
EXECUTION OF THE PROGRAM FOR THE BUYBACK OF SHARES
| Tranche | Segment | Completion date | Number of shares | % of share capital* | Disbursement |
|---|---|---|---|---|---|
| First tranche | March 3 | 281,218,710 | 4.2 | 1,500 | |
| Second tranche | First segment | May 16 | 206,554,498 | 3.1 | 1,000 |
| Second segment | August 19 | 149,996,808 | 2.3 | 660 | |
| Total | 637,770,016 | 9.6 | 3,160 |
- * As of the date tranche closure
REDEMPTION OF SHARES
| Tranche | Date | Number of redeemed shares |
|---|---|---|
| First tranche | June 15 | 281,218,710 |
| Second tranche | September 30 | 356,551,306 |
| Total | 637,770,016 |
Stock market indexes
BBVA’s shares are included in the main stock market indexes, among them the Euro Stoxx 50, to which BBVA returned on September 20, only one year after its exit, due to the good performance of the share. This milestone -exit and re-enter the following year- has not been achieved by any company at least in the last decade. In addition to these indexes, BBVA is part of the main sustainability indexes, such as the Dow Jones Sustainability Index (DJSI), the FTSE4Good and the MSCI ESG indexes. For more information on this subject, please refer to the “Sustainability indexes and ratings” section of this report.
At the closing of December 2022, the weighting of BBVA shares in the Ibex 35, Euro Stoxx 50 and the Stoxx Europe 600 index, were 7.75%, 1,20% and 0.37%, respectively. They are also included in several sector indexes, including Stoxx Europe 600 Banks, which includes the United Kingdom, with a weighting of 4.52% and the Euro Stoxx Banks index for the eurozone with a weighting of 7.87%.
3.2 Business areas
This section presents the most relevant aspects of the Group's different business areas. Specifically, for each one of them, it shows a summary of the income statements and balance sheets, the business activity figures and the most significant ratios.
The structure of the business areas reported by the BBVA Group as of December 31, 2022, is identical with the one presented at the end of 2021.
The composition of BBVA Group's business areas is summarized below:
- Spain mainly includes the banking, insurance and asset management activities that the Group carries out in this country, including the proportional share of the results of the company arisen from the bancassurance agreement reached with Allianz at the end of 2020.
- Mexico includes banking, insurance and asset management activities in this country, as well as the activity that BBVA Mexico carries out through its agency in Houston.
- Turkey reports the activity of the group Garanti BBVA that is mainly carried out in this country and, to a lesser extent, in Romania and the Netherlands.
With regard to this business area, after the end on May 18, 2022, of the acceptance period of the voluntary takeover bid, submitted by the BBVA Group for the entire share capital of Garanti BBVA not already owned, the Group’s stake increased to 85.97% from the 49.85% to the voluntary takeover bid. - South America includes banking, financial, insurance and asset management activities conducted, mainly, in Argentina, Chile, Colombia, Peru, Uruguay and Venezuela.
- Rest of Business mainly incorporates the wholesale activity carried out in Europe (excluding Spain), the United States, and BBVA’s branches in Asia
The Corporate Center contains the centralized functions of the Group, including: the costs of the head offices with a corporate function; structural exchange rate positions management; portfolios whose management is not linked to customer relations, such as financial and industrial holdings; stakes in Funds & Investment Vehicles in tech companies; certain tax assets and liabilities; funds due to commitments to employees; goodwill and other intangible assets as well as such portfolios and assets' funding. Additionally, the results obtained by BBVA USA and the rest of the companies included in the sale agreement to PNC until the closing of the transaction on June 1, 2021, are presented in a single line of the income statements called “Profit (loss) after taxes from discontinued operations”. Finally, the costs related to the BBVA, S.A. restructuring process carried out in Spain during the first half of the year 2021, are included in this aggregate and are recorded in the line "Net cost related to the restructuring process".
In addition to these geographical breakdowns, supplementary information is provided for the wholesale business carried out by BBVA, Corporate & Investment Banking (CIB), in the countries where it operates. This business is relevant to have a broader understanding of the Group's activity and results due to the important features of the type of customers served, products offered and risks assumed.
The information by business areas is based on units at the lowest level and/or companies that make up the Group, which are assigned to the different areas according to the main region or company group in which they carry out their activity. With regard to the information of the business areas, in the first quarter of 2022 the Group changed the allocation criteria for certain expenses related to global technology projects between the Corporate Center and the business areas, therefore, to ensure that year-on-year comparisons are homogeneous, the figures corresponding to the financial year 2021 have been restated, which did not affect the consolidated financial information of the Group. Also in the first quarter of 2022, an equity team from the Global Markets unit was transferred from Spain to New York, with the corresponding transfer of the costs associated with this relocation from the Spain area to the Rest of Business area.
Regarding the shareholders' funds allocation, in the business areas, a capital allocation system based on the consumed regulatory capital is used.
Finally, it should be noted that, as usual, in the case of the different business areas, that is, Mexico, Turkey, South America and Rest of Business, and, additionally, CIB, in addition to the year-on-year variations applying current exchange rates, the variations at constant exchange rates are also disclosed.
GROSS INCOME (1), OPERATING INCOME (1) AND NET ATTRIBUTABLE PROFIT (1) BREAKDOWN (PERCENTAGE. 2022)

(1) Excludes the Corporate Center.
MAIN INCOME STATEMENT LINE ITEMS BY BUSINESS AREA (MILLIONS OF EUROS)
| Business areas | |||||||||
|---|---|---|---|---|---|---|---|---|---|
| BBVA Group |
Spain | Mexico | Turkey | South America |
Rest of Business |
∑ Business areas | Corporate Center | ||
| 2022 | |||||||||
| Net interest income | 19,153 | 3,784 | 8,378 | 2,631 | 4,137 | 332 | 19,263 | (109) | |
| Gross income | 24,890 | 6,145 | 10,839 | 3,185 | 4,261 | 790 | 25,219 | (329) | |
| Operating income | 14,130 | 3,226 | 7,406 | 2,119 | 2,284 | 276 | 15,311 | (1,181) | |
| Profit (loss) before tax | 10,490 | 2,625 | 5,690 | 1,644 | 1,429 | 277 | 11,665 | (1,175) | |
| Net attributable profit (loss) excluding non-recurring impacts (1) |
6,621 | 1,879 | 4,182 | 509 | 734 | 240 | 7,544 | (922) | |
| Net attributable profit (loss) | 6,420 | 1,678 | 4,182 | 509 | 734 | 240 | 7,342 | (922) | |
| 2021 (2) | |||||||||
| Net interest income | 14,686 | 3,501 | 5,836 | 2,370 | 2,859 | 283 | 14,849 | (163) | |
| Gross income | 21,066 | 5,890 | 7,603 | 3,422 | 3,162 | 776 | 20,854 | 212 | |
| Operating income | 11,536 | 2,847 | 4,921 | 2,412 | 1,639 | 323 | 12,143 | (607) | |
| Profit (loss) before tax | 8,240 | 2,075 | 3,505 | 1,952 | 940 | 346 | 8,817 | (577) | |
|
Net attributable profit (loss) excluding non-recurring impacts (1) |
5,069 | 1,548 | 2,551 | 739 | 476 | 276 | 5,590 | (522) | |
| Net attributable profit (loss) | 4,653 | 1,548 | 2,551 | 739 | 476 | 276 | 5,590 | (938) | |
- (1) Non-recurring impacts include: (I) the net impact arisen from the purchase of offices in Spain in 2022; (II) the net costs related to the restructuring process; and (III) the profit (loss) after tax from discontinued operations derived from the sale of BBVA USA and the rest of the companies in the United States to PNC on June 1, 2021.
- (2) Restated balances.
MAIN BALANCE-SHEET ITEMS AND RISK-WEIGHTED ASSETS BY BUSINESS AREA (MILLIONS OF EUROS)
| Business areas | ||||||||||
|---|---|---|---|---|---|---|---|---|---|---|
| BBVA Group |
Spain | Mexico | Turkey | South America |
Rest of business |
∑ Business areas | Corporate Center | Deletions | ||
| 31-12-22 | ||||||||||
| Loans and advances to customers |
358,023 | 174,031 | 71,754 | 37,443 | 38,526 | 37,375 | 359,128 | 278 | (1,383) | |
| Deposits from customers | 393,856 | 220,471 | 77,750 | 46,339 | 40,042 | 9,827 | 394,430 | 187 | (760) | |
| Off-balance sheet funds | 150,172 | 86,759 | 38,196 | 6,936 | 17,760 | 520 | 150,170 | 2 | — | |
| Total assets/liabilities and equity | 713,140 | 427,193 | 143,405 | 66,043 | 62,067 | 49,952 | 748,660 | 22,719 | (58,239) | |
| RWAs | 337,102 | 114,474 | 71,738 | 56,275 | 46,834 | 35,064 | 324,385 | 12,718 | — | |
| 31-12-21 | ||||||||||
| Loans and advances to customers |
318,939 | 171,081 | 55,809 | 31,414 | 34,608 | 26,965 | 319,877 | 1,006 | (1,945) | |
| Deposits from customers | 349,761 | 206,663 | 64,003 | 38,341 | 36,340 | 6,266 | 351,613 | 175 | (2,027) | |
| Off-balance sheet funds | 147,192 | 94,095 | 32,380 | 3,895 | 16,223 | 597 | 147,190 | 2 | — | |
| Total assets/liabilities and equity | 662,885 | 413,430 | 118,106 | 56,245 | 56,124 | 40,328 | 684,233 | 30,835 | (52,182) | |
| RWAs | 307,795 | 113,797 | 64,573 | 49,718 | 43,334 | 29,280 | 300,703 | 7,092 | — | |
NUMBER OF EMPLOYEES
NUMBER OF BRANCHES
NUMBER OF ATMS
3.2.1 Spain
Highlights
- Lending growth in the most profitable segments in 2022
- Double-digit operating income growth
- Significant improvement in efficiency in the year
- Solid risk indicators, with a reduction of both the non-performing loans balance and the NPL ratio in 2022
BUSINESS ACTIVITY (1) (VARIATION COMPARED TO 31-12-21)
(1) Excluding repos.
NET INTEREST INCOME / AVERAGE TOTAL ASSETS (PERCENTAGE)
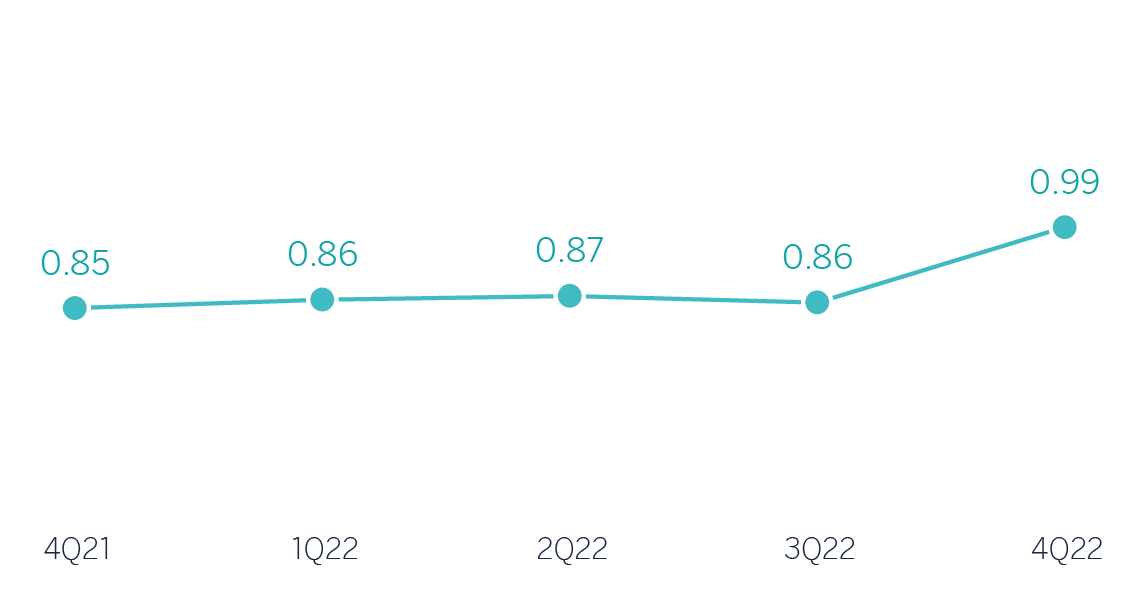
OPERATING INCOME (MILLIONS OF EUROS)
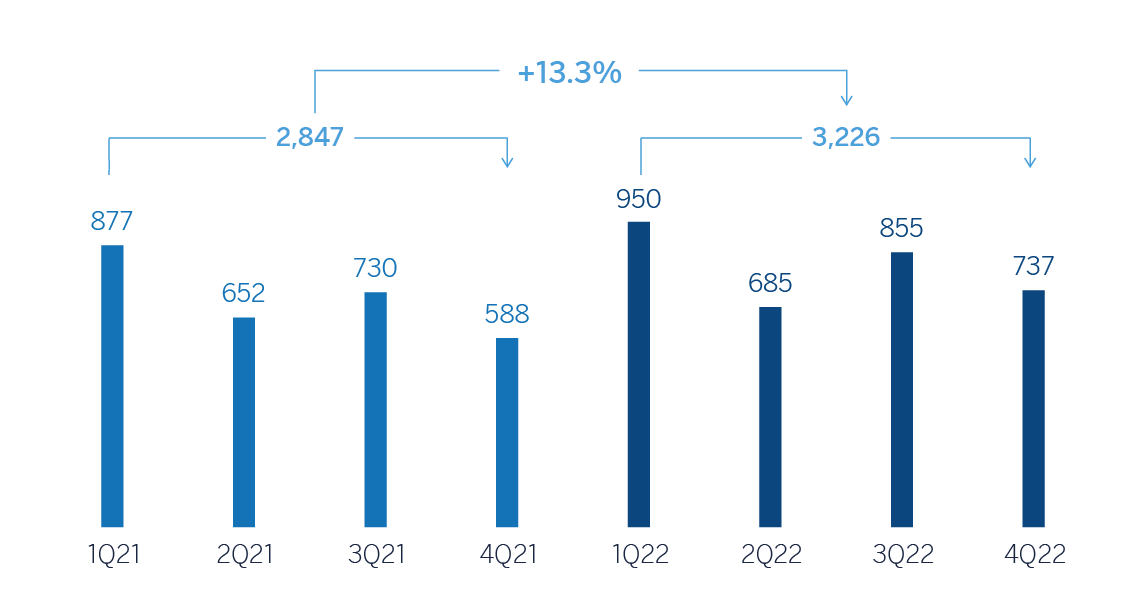
NET ATTRIBUTABLE PROFIT (LOSS) (MILLIONS OF EUROS)
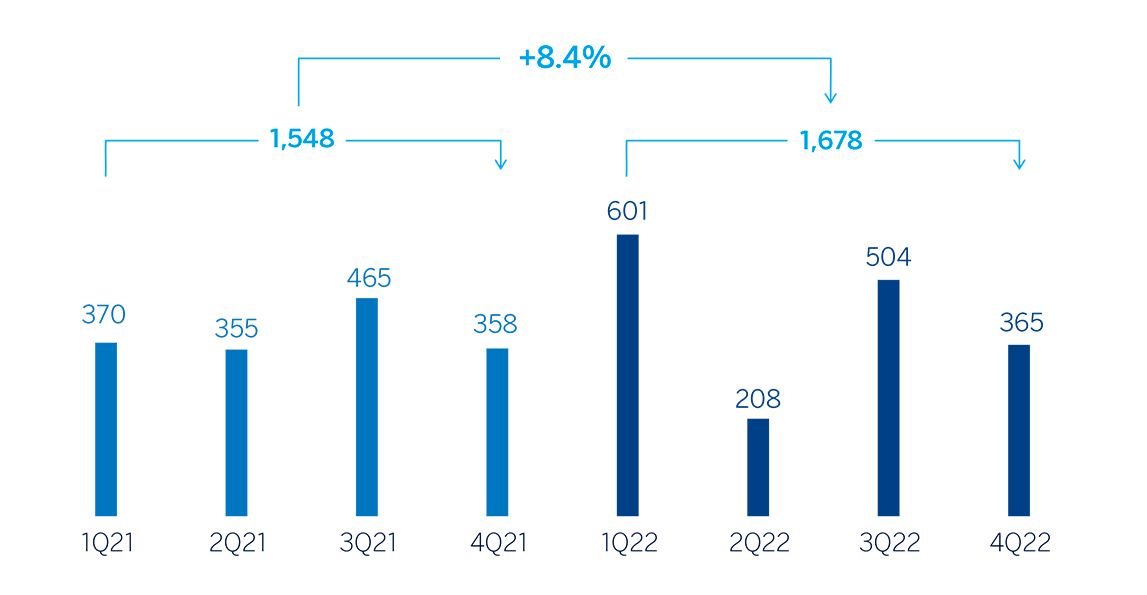
FINANCIAL STATEMENTS AND RELEVANT BUSINESS INDICATORS (MILLIONS OF EUROS AND PERCENTAGE)
| Income statement | 2022 | ∆% | 2021(1) |
|---|---|---|---|
| Net interest income | 3,784 | 8.1 | 3,501 |
| Net fees and commissions | 2,156 | (1.8) | 2,195 |
| Net trading income | 396 | 30.1 | 304 |
| Other operating income and expenses | (191) | 75.1 | (109) |
| Of which: insurance activities (2) | 378 | 5.8 | 357 |
| Gross income | 6,145 | 4.3 | 5,890 |
| Operating expenses | (2,919) | (4.1) | (3,043) |
| Personnel expenses | (1,608) | (7.4) | (1,738) |
| Other administrative expenses | (907) | 3.7 | (875) |
| Depreciation | (404) | (6.3) | (431) |
| Operating income | 3,226 | 13.3 | 2,847 |
| Impairment on financial assets not measured at fair value through profit or loss | (522) | 4.0 | (503) |
| Provisions or reversal of provisions and other results | (78) | (71.2) | (270) |
| Profit (loss) before tax | 2,625 | 26.6 | 2,075 |
| Income tax | (743) | 41.8 | (524) |
| Profit (loss) for the period | 1,882 | 21.4 | 1,551 |
| Non-controlling interests | (3) | 38.3 | (2) |
| Net attributable profit (loss) excluding non-recurring impacts | 1,879 | 21.4 | 1,548 |
| Net impact arisen from the purchase of offices in Spain | (201) | — | — |
| Net attributable profit (loss) | 1,678 | 8.4 | 1,548 |
(1) Restated balances. For more information, please refer to the “Business Areas” section.
(2) Includes premiums received net of estimated technical insurance reserves.
| Balance sheets | 31-12-22 | ∆% | 31-12-21 |
|---|---|---|---|
| Cash, cash balances at central banks and other demand deposits | 49,185 | 86.4 | 26,386 |
| Financial assets designated at fair value | 126,413 | (13.1) | 145,546 |
| Of which: Loans and advances | 41,926 | (17.2) | 50,633 |
| Financial assets at amortized cost | 204,588 | 2.5 | 199,646 |
| Of which: Loans and advances to customers | 174,031 | 1.7 | 171,081 |
| Inter-area positions | 38,924 | 14.6 | 33,972 |
| Tangible assets | 2,990 | 18.0 | 2,534 |
| Other assets | 5,093 | (4.7) | 5,346 |
| Total assets/liabilities and equity | 427,193 | 3.3 | 413,430 |
| Financial liabilities held for trading and designated at fair value through profit or loss | 84,619 | 4.0 | 81,376 |
| Deposits from central banks and credit institutions | 51,702 | (5.6) | 54,759 |
| Deposits from customers | 220,471 | 6.7 | 206,663 |
| Debt certificates | 40,782 | 6.7 | 38,224 |
| Inter-area positions | — | — | — |
| Other liabilities | 16,495 | (10.4) | 18,406 |
| Regulatory capital allocated | 13,123 | (6.3) | 14,002 |
| Relevant business indicators | 31-12-22 | ∆% | 31-12-21 |
|---|---|---|---|
| Performing loans and advances to customers under management (1) | 171,268 | 1.8 | 168,235 |
| Non-performing loans | 7,891 | (6.6) | 8,450 |
| Customer deposits under management (1) | 219,592 | 6.6 | 205,908 |
| Off-balance sheet funds (2) | 86,759 | (7.8) | 94,095 |
| Risk-weighted assets | 114,474 | 0.6 | 113,797 |
| Efficiency ratio (%) | 47.5 | 51.7 | |
| NPL ratio (%) | 3.9 | 4.2 | |
| NPL coverage ratio (%) | 61 | 62 | |
| Cost of risk (%) | 0.28 | 0.30 |
- (1) Excluding repos.
- (2) Includes mutual funds, customer portfolios and pension funds.
Macro and industry trends
Despite the war in Ukraine and the ongoing tightening of monetary conditions, economic activity continued to show dynamism in the second half of 2022. Inflation displayed recent signs of deceleration, in line with lower energy prices, favored by expectations that current gas inventories are high enough to avoid a shortage in the winter of 2022-23. Spain's GDP increased by 5.5% in 2022, ninety basis points above BBVA Research's forecast. The interest rate hikes by the ECB, disruptions in the gas market and the global and European slowdown are expected to moderate the economy, and GDP growth in 2023 would be around 1.4%, 0.2 percentage points higher than previously expected by BBVA Research. Inflation, which ended the year at 5.7% after breaching the 10.0% threshold at the mid-year, will moderate to around 3.5% in the 2023 average, which is still above the ECB's 2% target.
As for the banking sector, based on data as of the end of November 2022, the volume of credit to the private sector remained stable, with a slight growth of 0.4% year-on-year. This was mainly driven by mortgages and credit to non-real estate businesses. Customer deposits (demand and time) grew by 2.8% year-on-year at the end of November 2022. For the time being, no transfers to time deposits has been observed. The NPL ratio continued to decline, reaching 3.68% in November 2022, 61 basis points lower than in the same month of 2021. The system also maintains comfortable solvency and liquidity levels.
Activity
The most relevant aspects related to the area's activity during 2022 were:
- Lending activity increased in the year (+1.8% compared to the end of 2021), largely supported by the growth of business segments, especially SMEs (+11.0%) and corporate loans (+8.4%), as well as higher consumer balances (+9.1%, including credit cards).
- With regard to asset quality, the NPL ratio decreased by 28 basis points in the year to 3.9%, mainly derived from the retail portfolios sale and, to a lesser extent, the higher recoveries and write-offs management. For its part, the NPL coverage ratio remained broadly stable at 61% at the end of December 2022.
- Total customer funds recorded a variation of +2.1%, which represents balances, for the first time in the last twelve months, above the end of 2021, with uneven performance by product: customer deposits under management increased by 6.6% in 2022, with growth in demand deposits and, to a lesser extent, in time deposits -no transfers from demand to time deposits currently observed-. For its part, off-balance sheet funds (mutual and pension funds) declined by 7.8% weighed down by the evolution of the markets in 2022.
Results
Spain generated a net attributable profit of €1,678m in the year 2022, up 8.4% from the result achieved in the previous year, due to the dynamism of net interest income and the higher net trading income (NTI), which together with lower operating expenses and provisions, have driven the year-on-year evolution. This result includes the net impact of €-201m from the purchase of offices from Merlin, recorded in the second quarter of the year. Excluding this impact, the cumulative net attributable profit of the area at the end of the year 2022 stands at €1,879m, 21.4% above the net attributable profit of the previous year.
The most notable aspects of the year-on-year changes in the area's income statement at the end of December 2022 were:
- Net interest income registered an increase of 8.1%, supported by the improvement in customer spread, in an environment of rising interest rates, and the activity growth.
- Net fees and commissions were lower than in the previous year (-1.8%), affected by the lower asset management commissions contribution, which were impacted by the market evolution during the year 2022.
- NTI stood a 30.1% above the one achieved in the same period of the previous year, mainly due to the greater contribution of the Global Markets unit.
- The other operating income and expenses line compares negatively to the previous year, mainly due to the higher contribution to the Single Resolution Fund (hereinafter, FUR, for its acronym in Spanish) and Deposit Guarantee Fund (hereinafter, FGD, for its acronym in Spanish), which was partially offset by the good performance of the insurance business (+5.8%).
- Decrease in operating expenses (-4.1%), mainly due to lower personnel expenses, as a result of the restructuring process in 2021.
- As a result of gross income growth and the declined expenses, the efficiency ratio stood at 47.5%, representing a significant improvement compared to the 51.7% recorded at the end of December 2021.
- Impairment on financial assets was 4.0% above the one recorded in 2021, due to the provisions increase in debt securities portfolio (release in 2021), which were partially offset by slightly lower loan-loss provisions. As a result, the accumulated cost of risk at the end of December 2022 stood at 0.28%, below the 0.30% at the end of December 2021.
- The provisions and other results line closed the year 2022 at €-78m, which compares very positively with last year, due to, among other factors, the provisions update in 2022 for pensions and other personnel commitments.
3.2.2 Mexico
Highlights
- Balanced and double-digit growth in both the wholesale and retail portfolio in the year
- Very positive performance of recurring income due to increased activity and improved customer spreads
- Risk indicators improvement and outstanding performance of the efficiency ratio
- Constant increase in the quarterly net attributable profit
BUSINESS ACTIVITY (1)
(VARIATION AT CONSTANT
EXCHANGE RATE COMPARED TO 31-12-21)
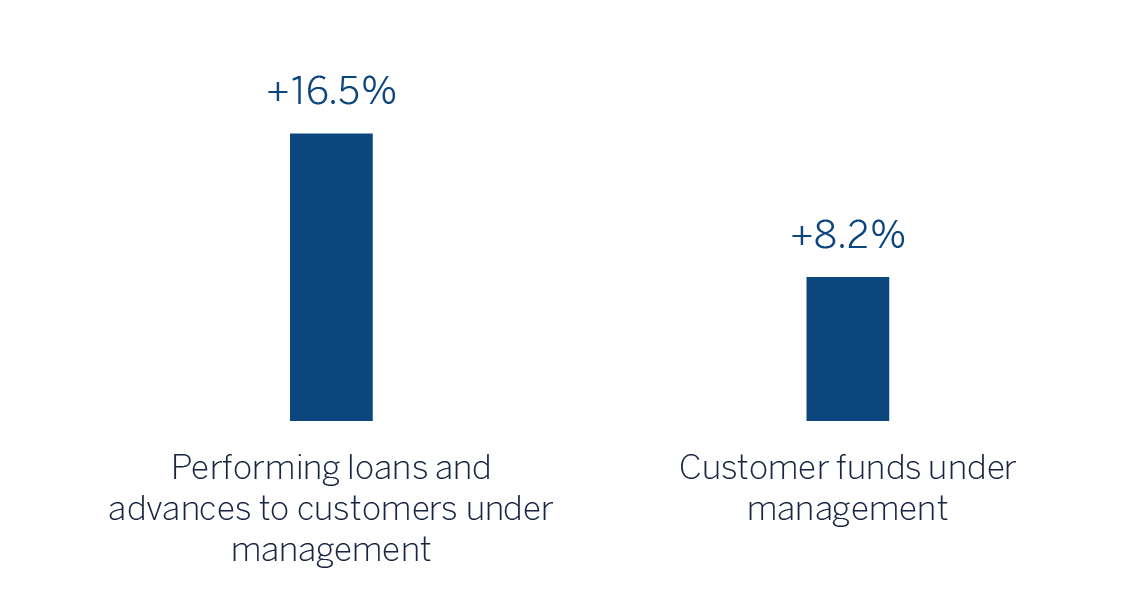
(1) Excluding repos.
NET INTEREST INCOME / AVERAGE TOTAL ASSETS
(PERCENTAGE AT CONSTANT EXCHANGE RATE)
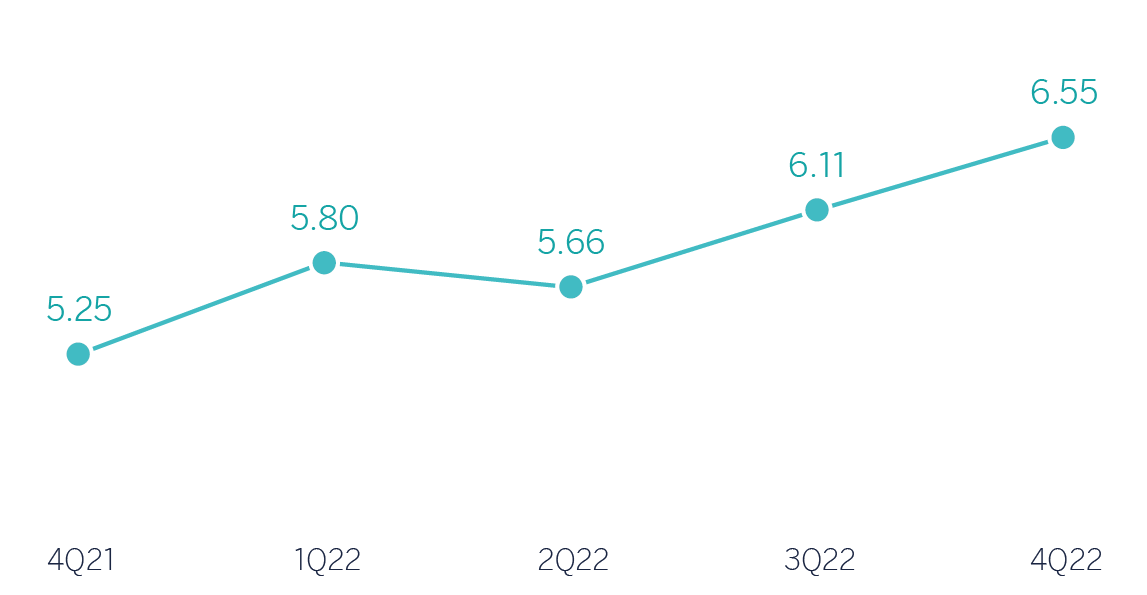
OPERATING INCOME (MILLIONS OF EUROS AT CONSTANT EXCHANGE RATE)
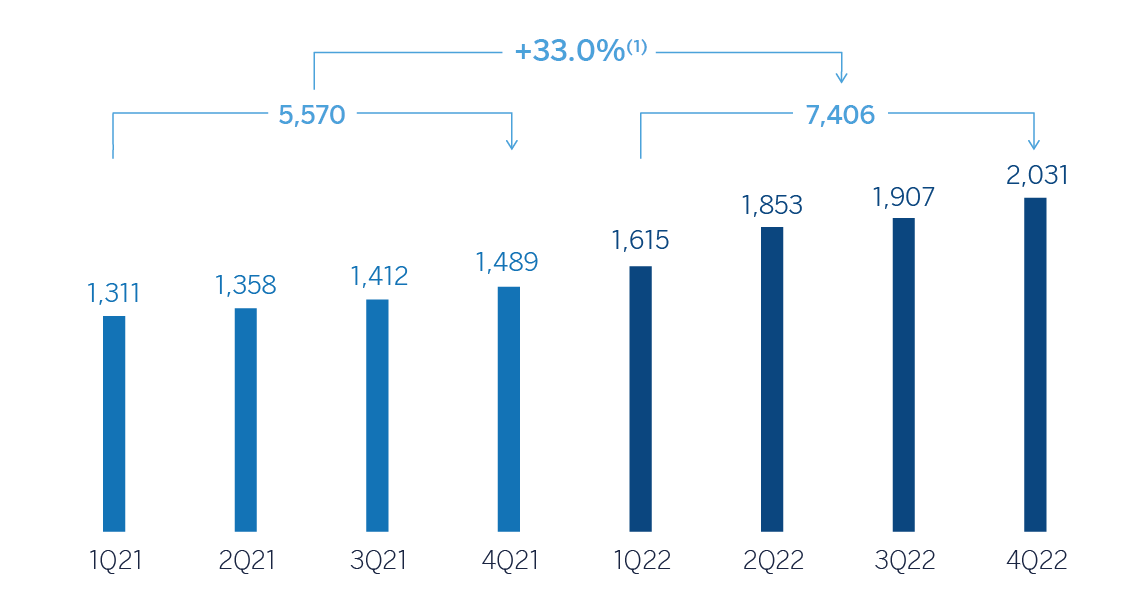
(1) At current exchange rate: +50.5%.
NET ATTRIBUTABLE PROFIT (LOSS) (MILLIONS OF EUROS AT CONSTANT EXCHANGE RATE)
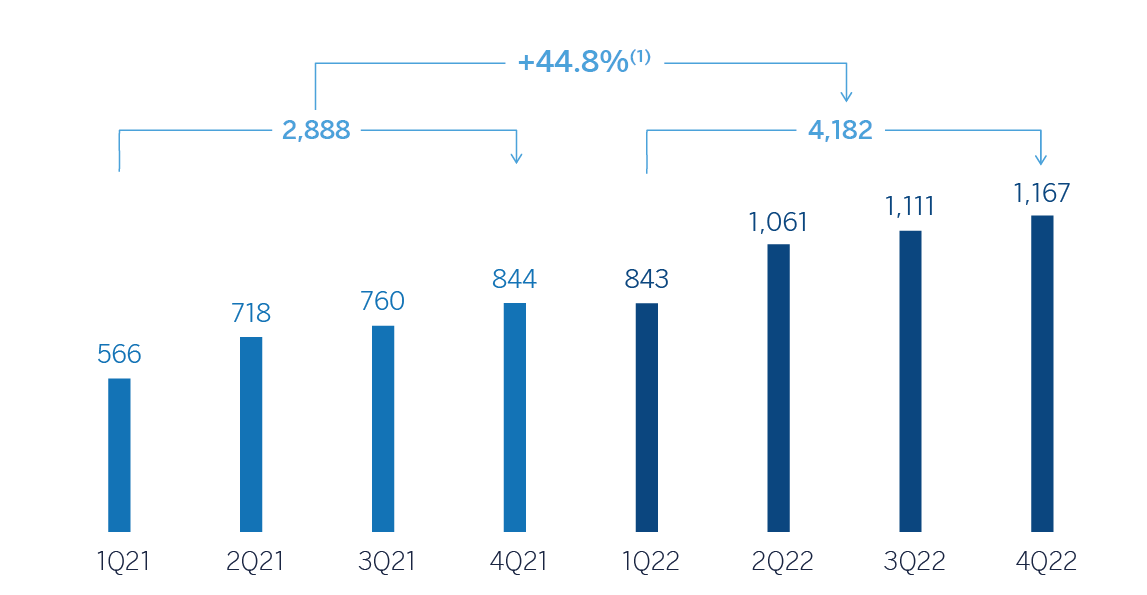
(1) At current exchange rate: +63.9%.
FINANCIAL STATEMENTS AND RELEVANT BUSINESS INDICATORS (MILLIONS OF EUROS AND PERCENTAGE)
| Income statement | 2022 | ∆% | ∆% (1) | 2021 (2) |
|---|---|---|---|---|
| Net interest income | 8,378 | 43.6 | 26.8 | 5,836 |
| Net fees and commissions | 1,621 | 33.9 | 18.3 | 1,211 |
| Net trading income | 439 | 19.9 | 5.9 | 366 |
| Other operating income and expenses | 400 | 110.9 | 86.3 | 190 |
| Gross income | 10,839 | 42.6 | 25.9 | 7,603 |
| Operating expenses | (3,432) | 28.0 | 13.0 | (2,682) |
| Personnel expenses | (1,576) | 31.4 | 16.1 | (1,199) |
| Other administrative expenses | (1,459) | 26.0 | 11.3 | (1,157) |
| Depreciation | (398) | 22.0 | 7.8 | (326) |
| Operating income | 7,406 | 50.5 | 33.0 | 4,921 |
| Impairment on financial assets not measured at fair value through profit or loss | (1,693) | 17.5 | 3.8 | (1,440) |
| Provisions or reversal of provisions and other results | (24) | n.s. | n.s. | 24 |
| Profit (loss) before tax | 5,690 | 62.3 | 43.4 | 3,505 |
| Income tax | (1,507) | 58.1 | 39.7 | (953) |
| Profit (loss) for the period | 4,182 | 63.9 | 44.8 | 2,552 |
| Non-controlling interests | (1) | 60.7 | 42.0 | (0) |
| Net attributable profit (loss) | 4,182 | 63.9 | 44.8 | 2,551 |
- (1) At constant exchange rate.
- (2) Restated balances. For more information, please refer to the “Business Areas” section.
| Balance sheets | 31-12-22 | ∆% | ∆% (1) | 31-12-21 |
|---|---|---|---|---|
| Cash, cash balances at central banks and other demand deposits | 13,228 | 1.9 | (8.2) | 12,985 |
| Financial assets designated at fair value | 40,356 | 14.9 | 3.5 | 35,126 |
| Of which: loans and advances | 1,507 | 80.4 | 62.6 | 835 |
| Financial assets at amortized cost | 84,465 | 29.3 | 16.5 | 65,311 |
| Of which: loans and advances to customers | 71,754 | 28.6 | 15.9 | 55,809 |
| Tangible assets | 1,969 | 13.8 | 2.5 | 1,731 |
| Other assets | 3,387 | 14.7 | 3.4 | 2,953 |
| Total assets/liabilities and equity | 143,405 | 21.4 | 9.4 | 118,106 |
| Financial liabilities held for trading and designated at fair value through profit or loss | 25,840 | 30.2 | 17.3 | 19,843 |
| Deposits from central banks and credit institutions | 4,402 | 34.7 | 21.4 | 3,268 |
| Deposits from customers | 77,750 | 21.5 | 9.5 | 64,003 |
| Debt certificates | 7,758 | (2.8) | (12.4) | 7,984 |
| Other liabilities | 17,825 | 13.0 | 1.8 | 15,779 |
| Regulatory capital allocated | 9,831 | 36.0 | 22.6 | 7,229 |
| Relevant business indicators | 31-12-22 | ∆% | ∆% (1) | 31-12-21 |
|---|---|---|---|---|
| Performing loans and advances to customers under management (2) | 72,311 | 29.3 | 16.5 | 55,926 |
| Non-performing loans | 1,939 | 0.9 | (9.0) | 1,921 |
| Customer deposits under management (2) | 76,785 | 21.2 | 9.2 | 63,349 |
| Off-balance sheet funds (3) | 38,196 | 18.0 | 6.3 | 32,380 |
| Risk-weighted assets | 71,738 | 11.1 | 0.1 | 64,573 |
| Efficiency ratio (%) | 31.7 | 35.3 | ||
| NPL ratio (%) | 2.5 | 3.2 | ||
| NPL coverage ratio (%) | 129 | 106 | ||
| Cost of risk (%) | 2.47 | 2.67 |
- (1) At constant exchange rate.
- (2) Excluding repos.
- (3) Includes mutual funds, customer portfolios and other off-balance sheet funds.
Macro and industry trends
Economic growth surprised on the upside in the second half of 2022, maintaining the relative dynamism observed in the first half of the year. The GDP growth for the year would reach around 3.0%, according to BBVA Research (one percentage point above the previous forecast). The outlook for economic activity in 2023 remains moderate: the GDP is expected to grow by 0.6% in 2023 (unchanged from the previous forecast). The slowdown in the United States economy, the high inflation —which stood at 7.8% at the end of 2022 and could average around 5.1% in 2023— and the high central bank interest rates, which could soon reach 10.75%, will foreseeably contribute to the slowdown in economic growth.
As for the banking system, with data as of the end of November 2022, the lending volume increased by 12.8% year-on-year, with a greater boost from the consumer portfolio (+17.5%) relative to mortgages and businesses (+12.0% and +11.3%, respectively). Total deposits growth moderated slightly to 8.8% year-on-year in November 2022, highlighting the incipient shift towards time deposits (+11.1% year-on-year). The industry's non-performing loans remained stable at around 2.35% in November 2022. Capital ratios are comfortable.
Unless expressly stated otherwise, all the comments below on rates of change, for both activity and results, will be given at constant exchange rate. These rates, together with changes at current exchange rates, can be found in the attached tables of financial statements and relevant business indicators.
Activity
The most relevant aspects related to the area's activity in the year 2022 were:
- Lending activity (performing loans under management) grew 16.5% between January and December 2022, with balanced growth in the wholesale portfolio and retail portfolio. The wholesale portfolio, which includes larger companies and the public sector, recorded a growth of 15.7%, due to commercial efforts to attract and retain new customers. For its part, the retail segment accelerated its rate of growth to 15.3%. Within this segment, consumer loans (+16.0%), mortgage loans (+11.2%), and credit cards (+20.7%) stood out, with an outstanding evolution of the latter in the fourth quarter. The aforementioned has supported a stable composition in lending activity, with a balanced distribution in lending between wholesale portfolio and retail portfolio.
- With regard to asset quality indicators, the NPL ratio stood at 2.5% at the end of December 2022, which represents a 68 basis points improvement in the year, mainly due to the aforementioned lending activity increase, and higher recoveries from the wholesale portfolio. For its part, the NPL coverage ratio stood at 129% at the end of December 2022, which represents an increase compared to the ratio of December 2021 (106%) due to higher loan-loss provisions.
- Customer deposits under management increased during the year 2022 (+9.2%). This performance is explained by both the growth in time deposits and demand deposits. For its part, off-balance sheet funds grew at a rate of 6.3% between January and December 2022.
Results
In Mexico, BBVA achieved a net attributable profit of €4,182m during 2022, representing an increase of 44.8% compared to the year 2021, mainly as a result of the increase in recurring income (net interest income and commissions), due to the strong dynamism of lending activity and the continued improvement in customer spreads, which more than offset the expenses increase in a context of growth and strong activity. For its part, loan-loss provisions remained contained in the year.
The most relevant aspects of the year-on-year changes in the income statement at the end of December 2022 are summarized below:
- Net interest income increased by 26.8%, due to the strong dynamism of lending activity and the effective pricing management, in a context of rising interest rates, with a higher loan yield and a contained cost of deposits in the year.
- Net fees and commissions increased by 18.3% thanks to the higher level of transactions by customers, especially on credit cards, as well as income derived from mutual funds management.
- NTI increased by 5.9%, mainly due to the good results of the Global Markets unit and the foreign exchange operations.
- The other operating income and expenses line recorded a growth of 86.3%, due to higher results of the insurance business as result of the activity dynamism, as well as the release of provisions in a context of rising interest rates.
- Operating expenses increase (+13.0%), mainly due to higher personnel expenses, impacted by wages increases in a context of higher inflation, and higher incentives to sales position and higher variable remuneration in a context of strong growth of activity. The general expenses line also increased, in an environment of rising prices where certain expenses are indexed to inflation, as well as by higher marketing and technology expenses. Notwithstanding the above, there was significant improvement of 361 basis points in the efficiency ratio, which stood at 31.7% compared to 35.3% recorded twelve months earlier.
- Slight increase in the impairment on financial assets line in the year (+3.8%), mainly due to higher loan loss-provisions in the retail portfolio in a higher growth environment. However, the cumulative cost of risk, at the end of December 2022 stood at 2.47%, still below that recorded twelve months earlier.
3.2.3 Turkey
Highlights
- Acceleration of local currency portfolio and reduction of exposure to foreign currency portfolios
- Net attributable profit impacted by the hyperinflation accounting, with effect from January 1, 2022, partially offset by the good dynamics of the business
- Strength of risk indicators
BUSINESS ACTIVITY (1) (VARIATION AT CONSTANT EXCHANGE RATE COMPARED TO 31-12-21)
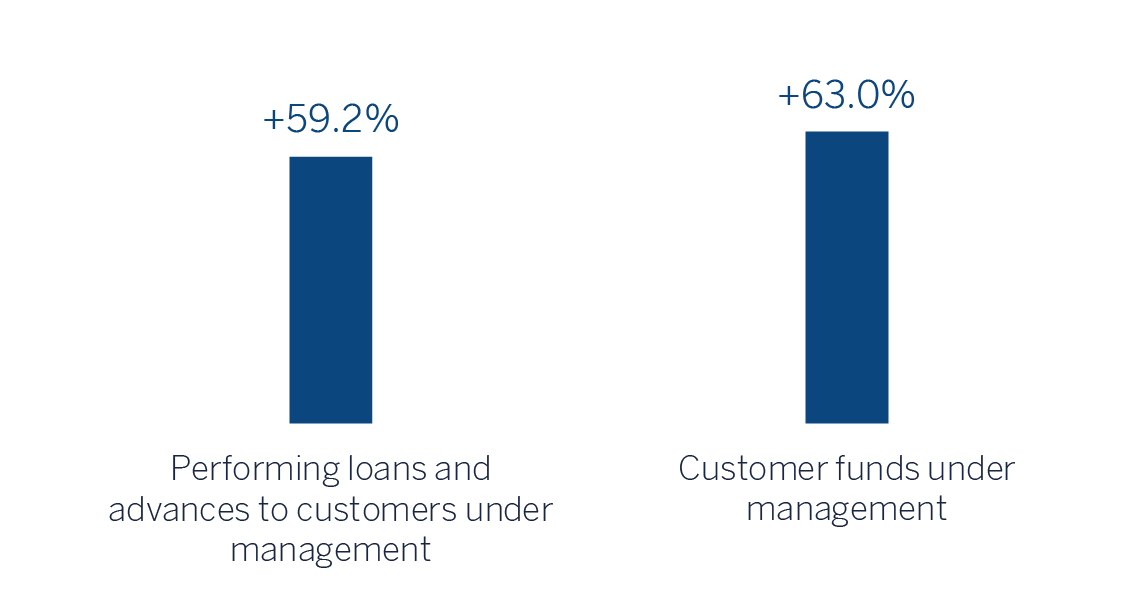
(1) Excluding repos.
NET INTEREST INCOME / AVERAGE TOTAL ASSETS (PERCENTAGE AT CONSTANT EXCHANGE RATE)
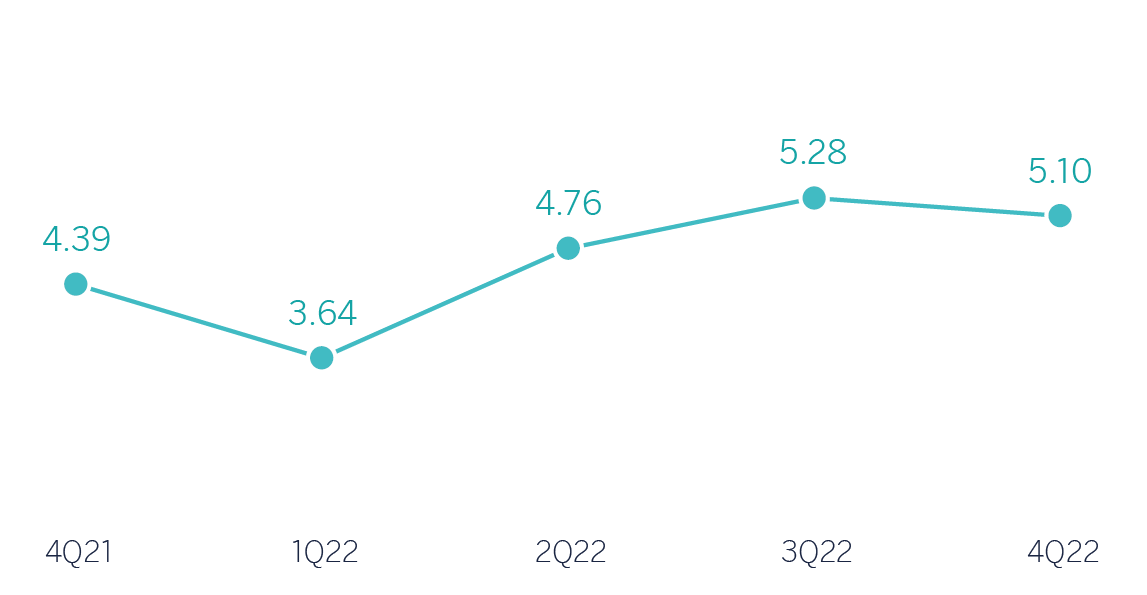
OPERATING INCOME (MILLIONS OF EUROS AT CONSTANT EXCHANGE RATE)
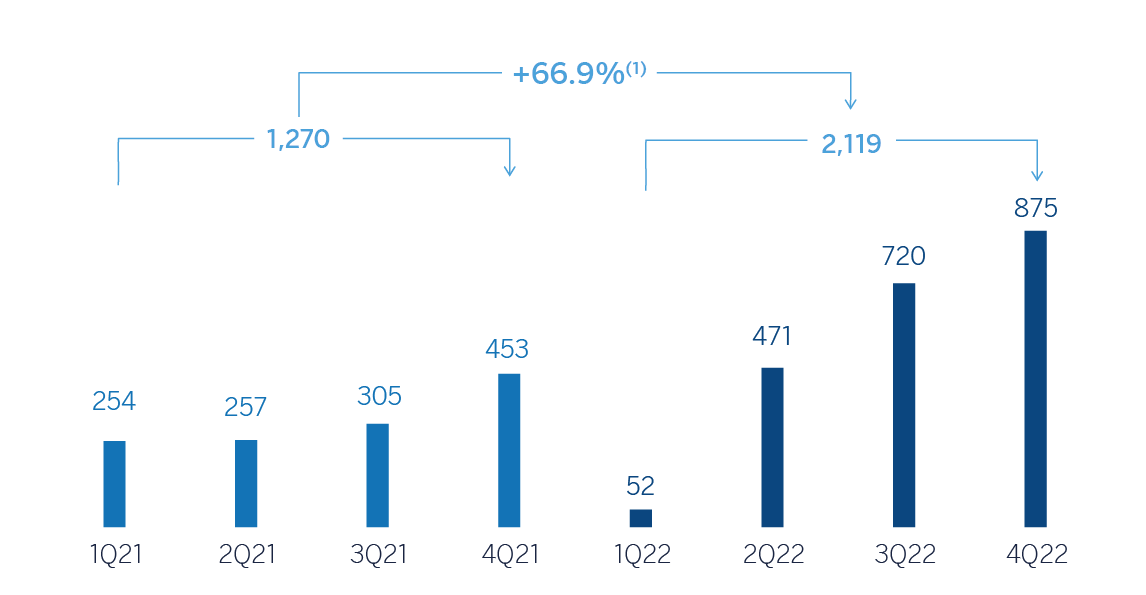
(1) At current exchange rate: -12.2%.
NET ATTRIBUTABLE PROFIT (LOSS) (MILLIONS OF EUROS AT CONSTANT EXCHANGE RATE)
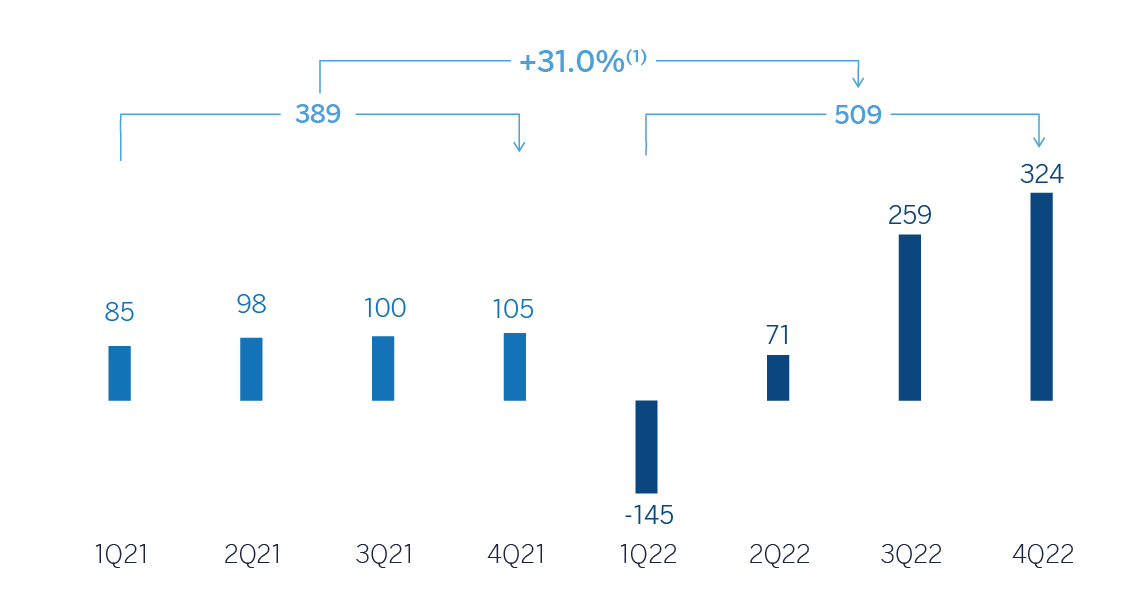
(1) At current exchange rate: -31.0%.
FINANCIAL STATEMENTS AND RELEVANT BUSINESS INDICATORS (MILLIONS OF EUROS AND PERCENTAGE)
| Income statement | 2022 | ∆% | ∆% (1) | 2021 (2) |
|---|---|---|---|---|
| Net interest income | 2,631 | 11.0 | 110.9 | 2,370 |
| Net fees and commissions | 587 | 4.0 | 97.5 | 564 |
| Net trading income | 741 | 79.4 | 240.9 | 413 |
| Other operating income and expenses | (774) | n.s. | n.s. | 74 |
| Gross income | 3,185 | (6.9) | 76.9 | 3,422 |
| Operating expenses | (1,067) | 5.6 | 100.7 | (1,010) |
| Personnel expenses | (593) | 0.0 | 90.0 | (593) |
| Other administrative expenses | (345) | 15.8 | 120.0 | (298) |
| Depreciation | (129) | 8.6 | 106.4 | (118) |
| Operating income | 2,119 | (12.2) | 66.9 | 2,412 |
| Impairment on financial assets not measured at fair value through profit or loss | (387) | (21.8) | 48.7 | (494) |
| Provisions or reversal of provisions and other results | (88) | n.s. | n.s. | 33 |
| Profit (loss) before tax | 1,644 | (15.8) | 60.1 | 1,952 |
| Income tax | (1,105) | 143.1 | n.s. | (455) |
| Profit (loss) for the period | 538 | (64.0) | (31.6) | 1,497 |
| Non-controlling interests | (29) | (96.2) | (92.7) | (758) |
| Net attributable profit (loss) | 509 | (31.0) | 31.0 | 739 |
- (1)At constant exchange rate.
- (2) Restated balances due to reallocation of some technology expenses. For more information, please refer to the “Business Areas” section.
| Balance sheets | 31-12-22 | ∆% | ∆% (1) | 31-12-21 |
|---|---|---|---|---|
| Cash, cash balances at central banks and other demand deposits | 6,061 | (21.9) | 2.3 | 7,764 |
| Financial assets designated at fair value | 5,203 | (1.6) | 28.9 | 5,289 |
| Of which: loans and advances | 3 | (99) | (99) | 295 |
| Financial assets at amortized cost | 51,621 | 24.3 | 62.9 | 41,544 |
| Of which: loans and advances to customers | 37,443 | 19.2 | 56.2 | 31,414 |
| Tangible assets | 1,213 | 94.6 | 155.0 | 623 |
| Other assets | 1,944 | 89.8 | 148.7 | 1,025 |
| Total assets/liabilities and equity | 66,043 | 17.4 | 53.9 | 56,245 |
| Financial liabilities held for trading and designated at fair value through profit or loss | 2,138 | (5.9) | 23.3 | 2,272 |
| Deposits from central banks and credit institutions | 2,872 | (29.7) | (7.9) | 4,087 |
| Deposits from customers | 46,339 | 20.9 | 58.4 | 38,341 |
| Debt certificates | 3,236 | (10.6) | 17.2 | 3,618 |
| Other liabilities | 4,748 | 119.2 | 187.3 | 2,166 |
| Regulatory capital allocated | 6,711 | 16.5 | 52.7 | 5,761 |
| Relevant business indicators | 31-12-22 | ∆% | ∆% (1) | 31-12-21 |
|---|---|---|---|---|
| Performing loans and advances to customers under management (2) | 37,191 | 21.5 | 59.2 | 30,610 |
| Non-performing loans | 2,597 | (13.3) | 13.7 | 2,995 |
| Customer deposits under management (2) | 45,592 | 18.9 | 55.9 | 38,335 |
| Off-balance sheet funds (3) | 6,936 | 78,1 | 133.4 | 3,895 |
| Risk-weighted assets | 56,275 | 13.2 | 48.3 | 49,718 |
| Efficiency ratio (%) | 33.5 | 29.5 | ||
| NPL ratio (%) | 5.1 | 7.1 | ||
| NPL coverage ratio (%) | 90 | 75 | ||
| Cost of risk (%) | 0.94 | 1.33 |
- (1) At constant exchange rate.
- (2) Excluding repos.
- (3) Includes mutual funds and pension funds.
Macro and industry trends
After surprising on the upside in the first half of the year, against a context of increasing fiscal and monetary stimulus, economic activity lost dynamism in the second half of the year. Thus, BBVA Research expects GDP growth in 2022 to be 5.5%, half a percentage point lower than forecast three months ago. The relative strength of demand, high commodity prices and the sharp depreciation of the Turkish lira in a context of negative interest rates in real terms (even more so after the interest rate cuts announced by the central bank) contributed to keeping inflation at particularly elevated levels (64.3% in December). According to BBVA Research estimates, growth could slow to 3.0% in 2023 (five tenths of a percentage point lower than the previous forecast), therefore reducing inflationary pressure and external accounts. However, the economic environment is highly unstable due to the combination of high inflation, very negative real interest rates, economic policy uncertainty, pressure on the Turkish lira, high external finance needs and the current global and regional context.
As for the Turkish banking industry, looking at data as of November 2022 in which the effect of inflation remains clear, the total volume of lending in the system increased by 54.1% year-on-year, a moderation compared to previous months. The stock of credit continued to be driven by the rise of consumer loans (+67.6% year-on-year) while credit to businesses grew slightly less (+53.4% year-on-year). Total deposits slowed down, especially demand deposits, after growing by 62.8% year-on-year in November 2022. The growth in Turkish lira deposits accelerated (+120.5%) while dollar deposits grew far more slowly (+30.0%), reducing dollarization to 47% by the end of 2022 (versus 65% at the end of 2021, boosted by the regulatory measures announced during the year to promote the growth of deposits in Turkish lira). As for the system's NPL ratio, it stood at 2.16% as of November 2022 (106 basis points lower than in the same month of 2021).
Unless expressly stated otherwise, all comments below on rates of changes for both activity and income, will be presented at constant exchange rates. For the conversion of these figures, the exchange rate as of December 31, 2022 is used. These rates, together with changes at current exchange rates, can be observed in the attached tables of the financial statements and relevant business indicators.
Activity
The most relevant aspects related to the area’s activity during the year 2022 were:
- Lending activity (performing loans under management) increased by 59.2% between January and December 2022, driven by the growth in Turkish lira loans (+79.5%). This growth was mainly supported by the performance of credit cards, commercial loans and, to a lesser extent, consumer loans. Regarding foreign currency loans (in U.S. dollars), the deleveraging continues (-16.3%), fostered by regulatory measures.
- With regard to asset quality, the NPL ratio decreased by 200 basis points compared to the end of 2021 to 5.1%, mainly due to the higher recoveries and the change in staging of a large customer from Stage 3 to Stage 2, both in the wholesale portfolio, as well as to an increased activity (in particular, consumer loans and credit cards portfolio in Turkish Lira). As a result of the above, the NPL coverage ratio improved during the year to 90% as of December 31, 2022.
- Customer deposits (70% of the area's total liabilities as of December 31, 2022) remained the main source of funding for the balance sheet and increased by 55.9%. Noteworthy is the positive performance of Turkish lira time deposits (+141.8%), which represent a 72.9% of total customer deposits in local currency, as well as demand deposits (+123.3%). Balances deposited in foreign currency (in U.S. dollars) continued their downward path and decreased by 22.8%, with transfers from foreign currency time deposits to Turkish lira time deposits observed under a foreign exchange protection scheme, favoured by regulatory measures. For its part, off-balance sheet funds grew by 133.4%.
Results
Turkey generated a net attributable profit of €509m in the year 2022. This result includes the impact of hyperinflation accounting in Turkey, with effect from January 1, 2022, which includes, among others, the loss of the net monetary position for a gross amount of €2,323m, partially offset by the gross impact of income from inflation-linked bonds (CPI linkers) of €1,490m, both recorded in the "Other operating income and expenses" line, as well as the impact of applying the period-end exchange rate as of December 31, 2022. The cumulative net attributable profit at the end of 2022 also includes a lower discount on minority interests due to the increase in the BBVA Group's stake in Garanti BBVA, once the acceptance period for the voluntary takeover bid (hereinafter referred to as the Voluntary Takeover Bid) that the Group formulated on the totality of the share capital it did not own, has ended. These results are not comparable with those from the year 2021, as accounting for hyperinflation has been applied since January 1, 2022.
Regarding the results of the area in 2022:
- Net interest income recorded a favourable performance, thanks to the customer spread improvement and the higher loans volumes in Turkish lira loans.
- Net fees and commissions line, positive performance in payment systems, money transfers and brokerage activity.
- Income from NTI mainly reflects those from the Global Markets unit together with the positive results from currency positions.
- Other operating income and expenses line includes, among others, the aforementioned loss in the value of the net monetary position due to the country's inflation rate. It should be noted that said loss is partially offset by the income derived from inflation-linked bonds (CPI linkers). Despite the above, there has been a greater contribution to the Deposit Guarantee Fund and higher income from the subsidiaries of Garanti BBVA.
- Operating expenses include the impact of the wage update on personnel expenses and, in general, the impact of inflation in various items.
- Regarding the impairment on financial assets, provisions increased, both under collective analysis due to portfolio growth and under individualised analysis. For its part, the accumulated cost of risk at the end of December 2022 recorded a decrease to 0.94% from the 1.33% accumulated at the end of the previous quarter, supported by the growth in lending activity.
- The provisions and other results line closed December 2022 .with a loss of €88m, mainly due to the provisions for risks and contingent commitments.
3.2.4 South America
Highlights
- Growth in lending activity and customer funds
- NPL and NPL coverage ratio improvement
- Favorable behavior of recurring income
- Improvement of the efficiency ratio
BUSINESS ACTIVITY (1) (VARIATION AT CONSTANT EXCHANGE RATE COMPARED TO 31-12-21)
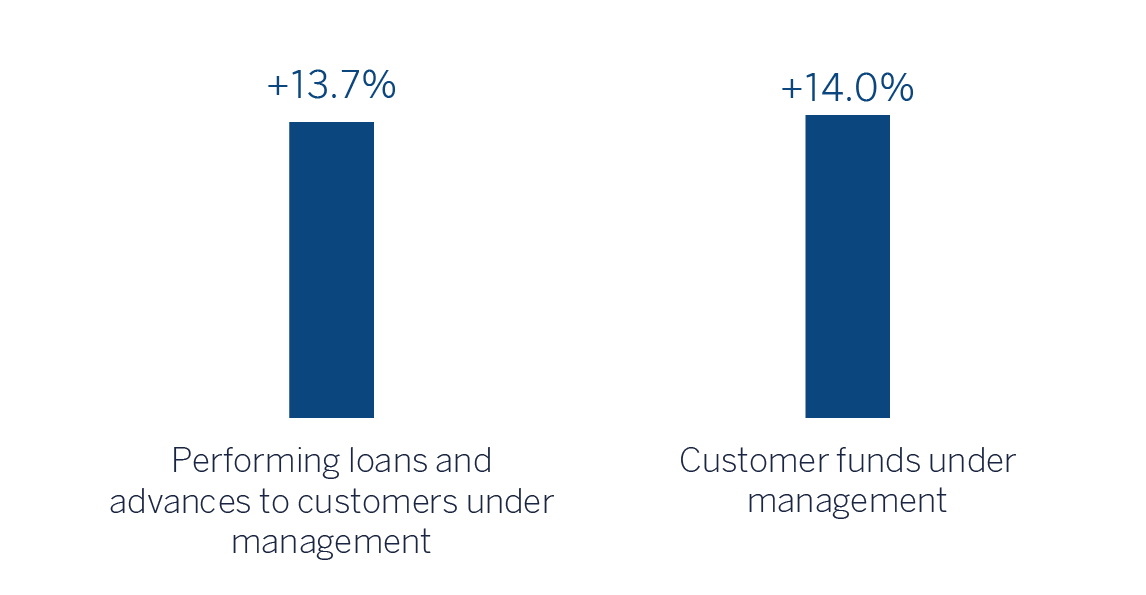
(1)Excluding repos.
NET INTEREST INCOME / AVERAGE TOTAL ASSETS
(PERCENTAGE AT CONSTANT EXCHANGE RATES)
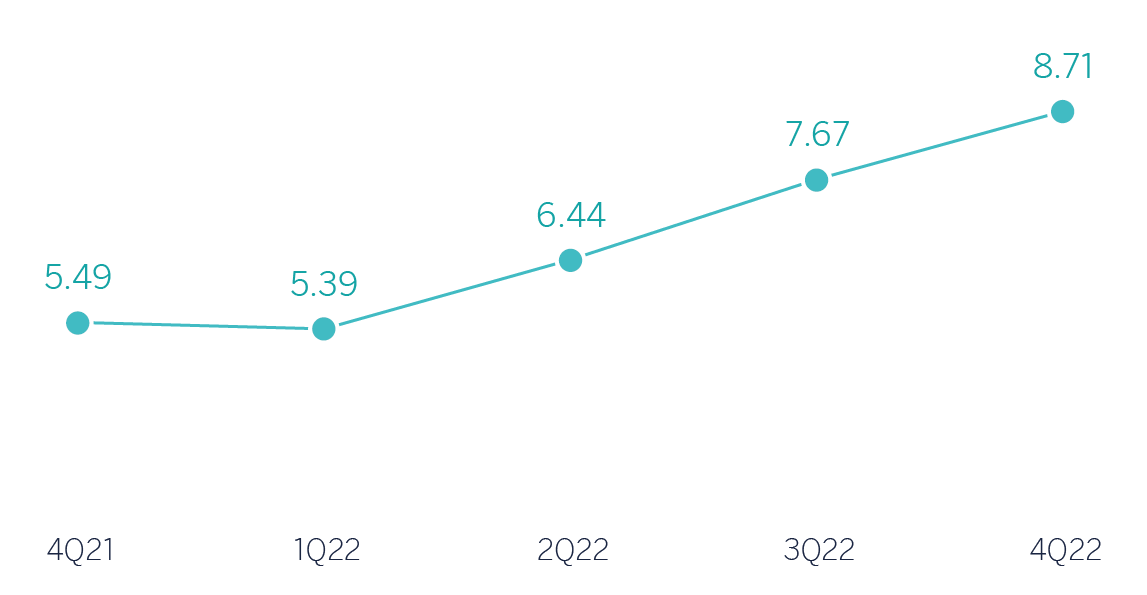
OPERATING INCOME
(MILLIONS OF EUROS AT CONSTANT EXCHANGE RATES)
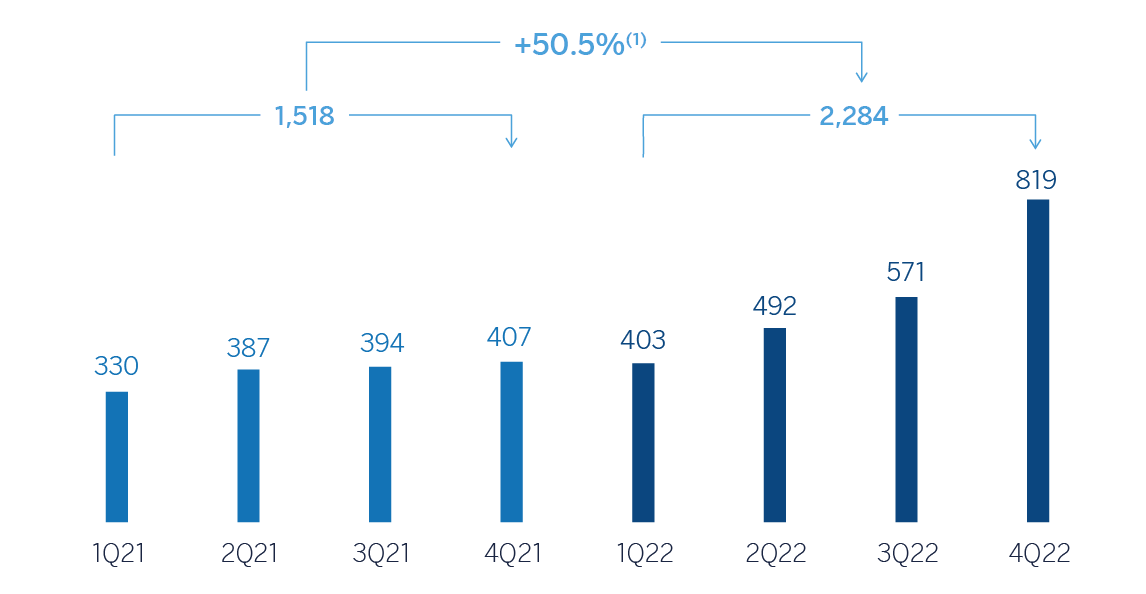
(1)At current exchange rates: +39.3%.
NET ATTRIBUTABLE PROFIT (LOSS)
(MILLIONS OF EUROS AT CONSTANT EXCHANGE RATES)
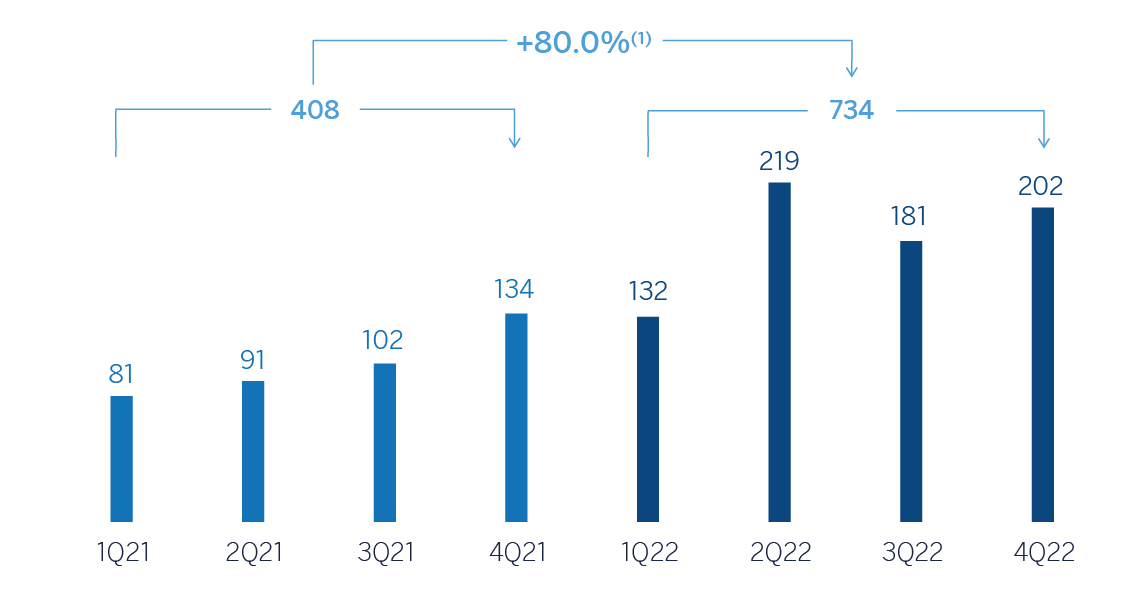
(1) At current exchange rates: +54.4%.
FINANCIAL STATEMENTS AND RELEVANT BUSINESS INDICATORS (MILLIONS OF EUROS AND PERCENTAGE)
| Income statement | 2022 | ∆% | ∆% (1) | 2021 (2) |
|---|---|---|---|---|
| Net interest income | 4,137 | 44.7 | 57.7 | 2,859 |
| Net fees and commissions | 778 | 32.2 | 38.7 | 589 |
| Net trading income | 447 | 37.7 | 40.9 | 324 |
| Other operating income and expenses | (1,102) | 80.4 | 94.9 | (611) |
| Gross income | 4,261 | 34.8 | 45.1 | 3,162 |
| Operating expenses | (1,977) | 29.8 | 39.2 | (1,522) |
| Personnel expenses | (947) | 30.7 | 40.5 | (724) |
| Other administrative expenses | (860) | 31.7 | 43.6 | (653) |
| Depreciation | (170) | 17.3 | 15.9 | (145) |
| Operating income | 2,284 | 39.3 | 50.5 | 1,639 |
| Impairment on financial assets not measured at fair value through profit or loss | (762) | 22.4 | 21.9 | (622) |
| Provisions or reversal of provisions and other results | (94) | 21.8 | 23.4 | (77) |
| Profit (loss) before tax | 1,429 | 52.0 | 74.9 | 940 |
| Income tax | (345) | 23.0 | 39.7 | (281) |
| Profit (loss) for the period | 1,083 | 64.3 | 90.2 | 659 |
| Non-controlling interests | (349) | 90.1 | 115.9 | (184) |
| Net attributable profit (loss) | 734 | 54.4 | 80.0 | 476 |
- (1) At constant exchange rates.
- (2) Restated balances. For more information, please refer to the “Business Areas” section.
| Balance sheets | 31-12-22 | ∆% | ∆% (1) | 31-12-21 |
|---|---|---|---|---|
| Cash, cash balances at central banks and other demand deposits | 7,695 | (10.0) | (4.7) | 8,549 |
| Financial assets designated at fair value | 10,563 | 47.2 | 56.3 | 7,175 |
| Of which: Loans and advances | 152 | (3.3) | 10.0 | 157 |
| Financial assets at amortized cost | 40,755 | 8.0 | 11.6 | 37,747 |
| Of which: Loans and advances to customers | 38,526 | 11.3 | 13.4 | 34,608 |
| Tangible assets | 1,088 | 21.6 | 24.5 | 895 |
| Other assets | 1,966 | 11.8 | 20.0 | 1,758 |
| Total assets/liabilities and equity | 62,067 | 10.6 | 15.3 | 56,124 |
| Financial liabilities held for trading and designated at fair value through profit or loss | 2,813 | 49.4 | 62.0 | 1,884 |
| Deposits from central banks and credit institutions | 5,610 | 2.0 | (4.3) | 5,501 |
| Deposits from customers | 40,042 | 10.2 | 15.7 | 36,340 |
| Debt certificates | 2,956 | (8.0) | (8.1) | 3,215 |
| Other liabilities | 4,770 | 13.4 | 30.7 | 4,207 |
| Regulatory capital allocated | 5,874 | 18.0 | 23.0 | 4,977 |
| Relevant business indicators | 31-12-22 | ∆% | ∆% (1) | 31-12-21 |
|---|---|---|---|---|
| Performing loans and advances to customers under management (2) | 38,566 | 11.5 | 13.7 | 34,583 |
| Non-performing loans | 1,835 | 1.3 | 1.3 | 1,813 |
| Customer deposits under management (3) | 40,074 | 10.2 | 15.7 | 36,364 |
| Off-balance sheet funds (4) | 17,760 | 9.5 | 10.3 | 16,223 |
| Risk-weighted assets | 46,834 | 8.1 | 12.6 | 43,334 |
| Efficiency ratio (%) | 46.4 | 48.2 | ||
| NPL ratio (%) | 4.1 | 4.5 | ||
| NPL coverage ratio (%) | 101 | 99 | ||
| Cost of risk (%) | 1.69 | 1.65 |
- (1) At constant exchange rates.
- (2) Excluding repos.
- (3) Excluding repos and including specific marketable debt securities.
- (4) Includes mutual funds, customer portfolios in Colombia and Peru and pension funds.
SOUTH AMERICA. DATA PER COUNTRY (MILLIONS OF EUROS)
| Operating income | Net attributable profit (loss) | |||||||
|---|---|---|---|---|---|---|---|---|
| Country | 2022 | ∆% | ∆% (1) | 2021 (2) | 2022 | ∆% | ∆% (1) | 2021 (2) |
| Argentina | 468 | 84.4 | n.s. | 254 | 185 | 218.0 | n.s. | 58 |
| Colombia | 605 | 7.8 | 8.9 | 561 | 238 | 6.6 | 7.6 | 223 |
| Peru | 932 | 37.3 | 20.7 | 679 | 206 | 74.3 | 53.1 | 118 |
| Other countries (3) | 279 | 91.6 | 82.8 | 145 | 106 | 38.3 | 32.6 | 76 |
| Total | 2,284 | 39.3 | 50.5 | 1,639 | 734 | 54.4 | 80.0 | 476 |
- (1) Figures at constant exchange rates.
- (2) Restated balances. For more information, please refer to the “Business Areas” section.
- (3) Bolivia, Chile (Forum), Uruguay and Venezuela. Additionally, it includes eliminations and other charges.
SOUTH AMERICA. RELEVANT BUSINESS INDICATORS PER COUNTRY (MILLIONS OF EUROS)
| Argentina | Colombia | Peru | ||||
|---|---|---|---|---|---|---|
| 31-12-22 | 31-12-21 | 31-12-22 | 31-12-21 | 31-12-22 | 31-12-21 | |
| Performing loans and advances to customers under management (1) (2) | 3,900 | 2,058 | 13,292 | 10,840 | 16,943 | 17,267 |
| Non-performing loans and guarantees given (1) | 64 | 50 | 600 | 613 | 1,054 | 1,073 |
| Customer deposits under management (1) (3) | 6,964 | 3,755 | 13,061 | 11,261 | 16,219 | 15,483 |
| Off-balance sheet funds (1) (4) | 2,303 | 1,059 | 2,046 | 2,088 | 1,453 | 1,813 |
| Risk-weighted assets | 8,089 | 6,775 | 15,279 | 14,262 | 17,936 | 18,016 |
| Efficiency ratio (%) | 61.3 | 69.0 | 40.6 | 37.0 | 37.2 | 38.2 |
| NPL ratio (%) | 1.6 | 2.3 | 4.2 | 5.0 | 4.9 | 4.9 |
| NPL coverage ratio (%) | 173 | 146 | 106 | 103 | 91 | 89 |
| Cost of risk (%) | 2.59 | 2.20 | 1.56 | 1.85 | 1.58 | 1.59 |
- (1) Figures at constant exchange rates.
- (2) Excluding repos.
- (3) Excluding repos and including specific marketable debt securities.
- (4) Includes mutual funds and customer portfolios (in Colombia and Peru).
Unless expressly stated otherwise, all the comments below on rates of change, for both activity and results, will be given at constant exchange rates. These rates, together with the changes at current exchange rates, can be found in the attached tables of the financial statements and relevant business indicators.
Activity and results
The most relevant aspects related to the area's activity during the year 2022 were:
- Lending activity (performing loans under management) recorded an increase of +13.7%, with growth in all segments, particularly in the corporate (+10.0%), consumer (+20.3%) and credit cards (+56.3%) portfolios.
- With regard to asset quality, the NPL ratio stood at 4.1% at the end of December 2022, which represents an improvement compared to the previous year, mainly due to the activity increase. For its part, NPL coverage ratio stood at 101% as of December 31, 2022, with a slight increase compared to the 99% registered at the end of the previous year.
- Customer funds under management increased (+14.0%) compared to the closing balances at the end of 2021, with higher contribution from time deposits (+69.0%) in an environment of rising benchmark rates and, to a lesser extent, on off-balance sheet funds (+10.3%).
South America generated a net attributable profit of €734m in the year 2022, which represents a year-on-year variation of +80.0%, mainly due to the improved performance of recurring income (+54.3%) and NTI, widely offsetting the growth of expenses, which in a highly inflationary environment throughout the region, increase below the gross income, the higher impact of the hyperinflation in Argentina, and higher loan-loss provisions for impairments on financial assets. With regard to the aforementioned inflation impact in Argentina, it stood at €-819m at the end of December 2022, notably above the €-395m accumulated at the end of December 2021. The aforementioned impacts are registered in the "Other operating income and expenses" heading of the area's income statement.
More detailed information on the most representative countries of the business area is provided below:
Argentina
Macro and industry trends
Despite the less favorable global context and a local environment shaped by difficulty in correcting current macroeconomic distortions and meeting the targets set in the agreement reached in March with the International Monetary Fund, economic activity exhibited some dynamism in 2022. Available evidence suggests, according to BBVA Research, that GDP could have grown by close to 5.0% in 2022, one percentage point higher than previously forecast. Furthermore, the global environment, high inflation (94.8% in December; expected to reach around 99% in 2023 on average), financial volatility, uncertainty as to policy developments and limited scope for further stimulus measures support expectations of a slight contraction in GDP in 2023.
The balance sheet of the banking sector continues to grow at a stable pace but remains driven by high inflation. At the end of November 2022, total lending grew by 64.0% compared to the same month in 2021, favored by both consumer and corporate portfolios, which reached year-on-year growth rates of 66.7% and 65.6%, respectively. Meanwhile, deposits sped up their growth compared to previous months: they grew by 94.1% year-on-year in November 2022. Finally, the NPL ratio remained stable at 3.1% in October 2022 (181 basis points lower than in the same month in 2021).
Activity and results
- For the year as a whole, performing loans under management increased by 89.6%, a figure that is well below inflation, with growth in both the business portfolio (+117.2%) and the retail portfolio (+71.8%), highlighting in the latter credit cards (+74.6%) and, to a lesser extent, consumer loans (+69.0%). The NPL ratio stood at 1.6%, which represents an increase compared to the previous quarter (+5 basis points) due to new NPL entries from retail portfolios, but well below the end of 2021. For its part, the NPL coverage ratio increased in the quarter to 173% due to the increase in loan-loss provisions. Regarding asset quality, the NPL ratio stood at 1.6% and the NPL coverage ratio closed 2022 at 173%.
- Balance sheet funds grew by 85.5% in 2022, mainly due to the evolution of time deposits, both in the retail and wholesale segments, followed by demand deposits, and mutual funds.
- The cumulative net attributable profit at the end of December 2022 stood at €185m, well above the figure achieved in 2021, mainly explained by strong growth of the net interest income derived from the activity increase and the higher securities portfolio contribution in a rising interest rates context. The year-on-year performance of commissions and NTI was also positive. The aforementioned was partially offset by a more negative inflation adjustment in the year and higher expenses and loan-loss provisions, mainly related to the fixed-income portfolio.II
Colombia
Macro and industry trends
Economic activity, in general, and domestic demand, in particular, have shown greater dynamism than expected in recent months. Growth in 2022 could reach 8.0%, above BBVA Research's previous forecast of 7.6%. In addition, high inflation (13.1% in December) prompted the Bank of the Republic to raise interest rates to 12.0% in December. In this context, and taking into account financial volatility and economic policy uncertainty, BBVA Research estimates further upward adjustments to interest rates in the near term, to around 13.0%. Inflation will remain relatively high in 2023 (11.7%, on average) and growth will slow significantly to around 0.7% in 2023 (unchanged from the previous forecast).
Total lending growth in the banking sector stood at 17.5% year-on-year in October 2022, driven by lending to households, especially consumer loans. Corporate credit growth sped up to 16.3% year-on-year as of September. Total deposits showed 15.1% year-on-year growth at the end of October 2022. There was a strong move toward time deposits (up 39.3% year-on-year) and a slowdown in the growth of demand deposits (up 4.9% year-on-year). The system's NPL ratio remained stable at around 3.70% in October 2022, a drop of 60 basis points from the same month in 2021.
Activity and results
- Lending activity showed a positive evolution throughout the year, accelerating quarter after quarter its growth rate compared to the end of 2021, reaching a year-on-year increase of 22.6% at the end of 2022. Noteworthy was the more dynamic performance in the wholesale portfolio (+37.9%), due to the business segment, although the retail portfolio also showed a favorable evolution (+13.4%). Regarding asset quality, the NPL ratio closed December 2022 at 4.2% and the NPL coverage ratio stood at 106%.
- Customer deposits under management increased by 16.0% during the year 2022, as a result of the growth in time deposits (+54.0%), resulting from the successive rate hikes implemented by the central bank.
- The cumulative net attributable profit at the end of the year 2022 stood at €238m, or 7.6% above that achieved in the previous year, favored by the evolution of recurring income and the NTI, as well as a contained level of provisions for impairment on financial assets. This offset the increase in operating expenses and income tax as a result of the increase in the tax rate from 34% to 38%.
Peru
Macro and industry trends
Against a context of political instability, which could have a negative impact on economic activity, the recent indicators suggest GDP could have grown close to 2.7% in 2022, four tenths of a percentage point above BBVA Research's previous forecast. Furthermore, uncertainty about future policies, high inflation, high interest rates and the global economic slowdown will impact negatively on growth going forward. Thus, BBVA Research estimates growth to be around 2.5% in 2023, unchanged from its previous expectation. Inflation could remain high in 2023 (around 6,4%, on average), while official interest rates could reach around 8.0% in the coming months.
Total lending growth in the banking industry continued to moderate, reaching 3.1% year-on-year in November 2022. The biggest slowdown continues to be seen in credit to businesses, with the balance contracting to -2.9% year-on-year. However, consumer loans remained dynamic, growing by 24.2% year-on-year in November 2022, while the mortgage portfolio maintained a stable growth rate of around 8.0% year-on-year. The industry's total deposits continued to drop moderately (-0.4% year-on-year in November 2022), with a greater shift toward time deposits (24.9% year-on-year) to the detriment of demand deposits (-8.9% year-on-year). The NPL ratio across the banking system deteriorated slightly to 3.19% in November 2022 (15 basis points above the same month in 2021).
Activity and results
- The year-on-year variation of lending activity stood at -1.9% at the end of December 2022, with an unfavorable evolution of the business segment (-8.1%), mainly due to the difficulty of offsetting the amortizations of the program Reactiva Peru. Apart from the above, very dynamic performance of consumer loans (+26.3%) and credit cards (+43.2%). Regarding asset quality, the NPL ratio stood at 4.9% at the end of December 2022, and the NPL coverage ratio closed the year at 91%.
- Customers funds under management increased by 2.2% during the year 2022, due to the favorable performance of time deposits (+84.9%), supported by the rise in benchmark rates by the central bank, which offset lower balances in demand deposits (-10.9%) and in off-balance sheet funds (-19.9%).
- BBVA Peru's net attributable profit stood at €206m at the end of December 2022, 53.1% higher than the figure achieved at the end of the previous year. During the year 2022, recurring income grew by 20.4%, thanks to the favorable evolution of the net interest income, which benefited from the increase in the customer spread and, to a lesser extent, commissions. On the lower part of the income statement, higher operating expenses (+15.8%) -without an efficiency ratio deterioration, which improved 96 basis points in the year- and lower provisions for impairment on financial assets (-1.4%) were recorded.
3.2.5 Rest of Business
Highlights
- Growth in lending activity and in customer funds in 2022
- Strong net interest income, which grows at double-digit
- Risk indicators improvement in the year
- Cost of risk at very low levels
BUSINESS ACTIVITY (1) (VARIATION AT CONSTANT EXCHANGE RATES COMPARED TO 31-12-21)
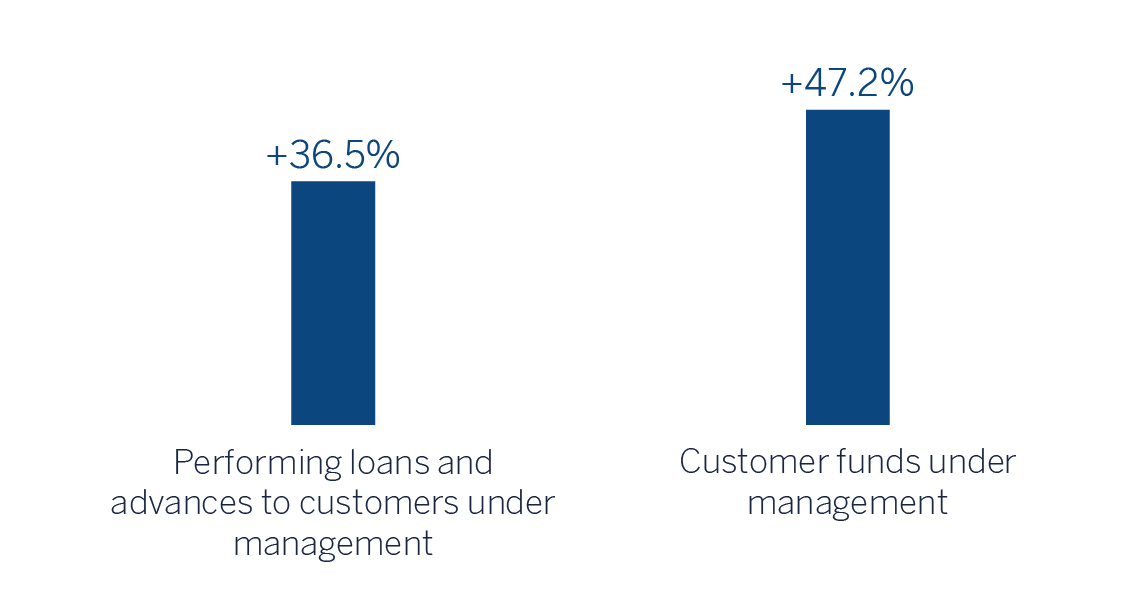
(1)Excluding repos.
NET INTEREST INCOME / AVERAGE TOTAL ASSETS
(PERCENTAGE AT CONSTANT EXCHANGE RATES)
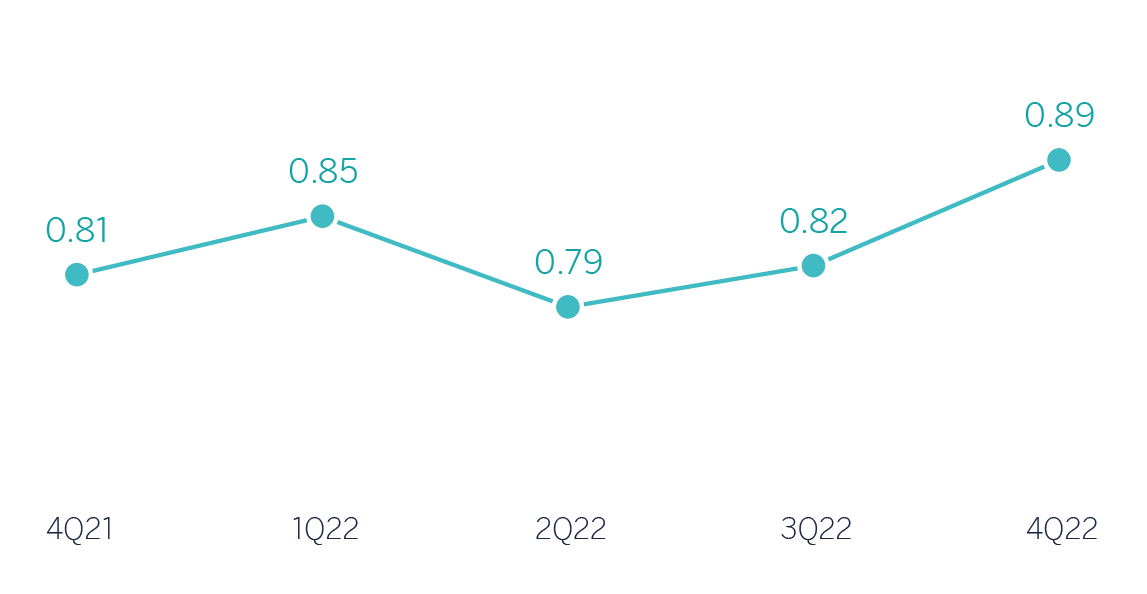
OPERATING INCOME (MILLIONS OF EUROS AT CONSTANT EXCHANGE RATES)
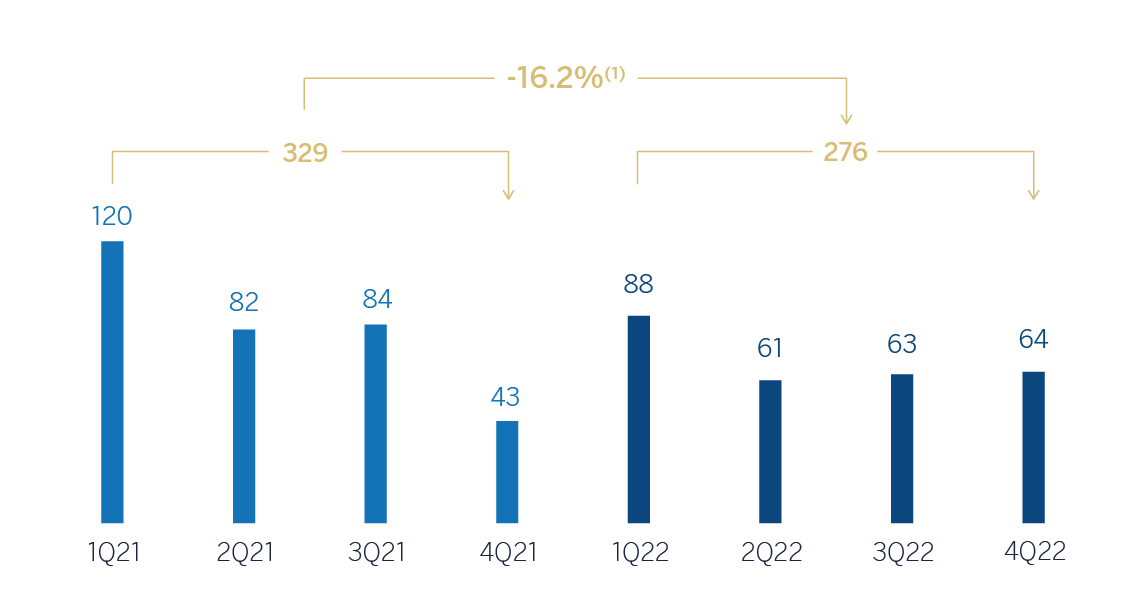
(1) At current exchange rates: -14.6%.
NET ATTRIBUTABLE PROFIT (LOSS)
(MILLIONS OF EUROS AT CONSTANT EXCHANGE RATES)
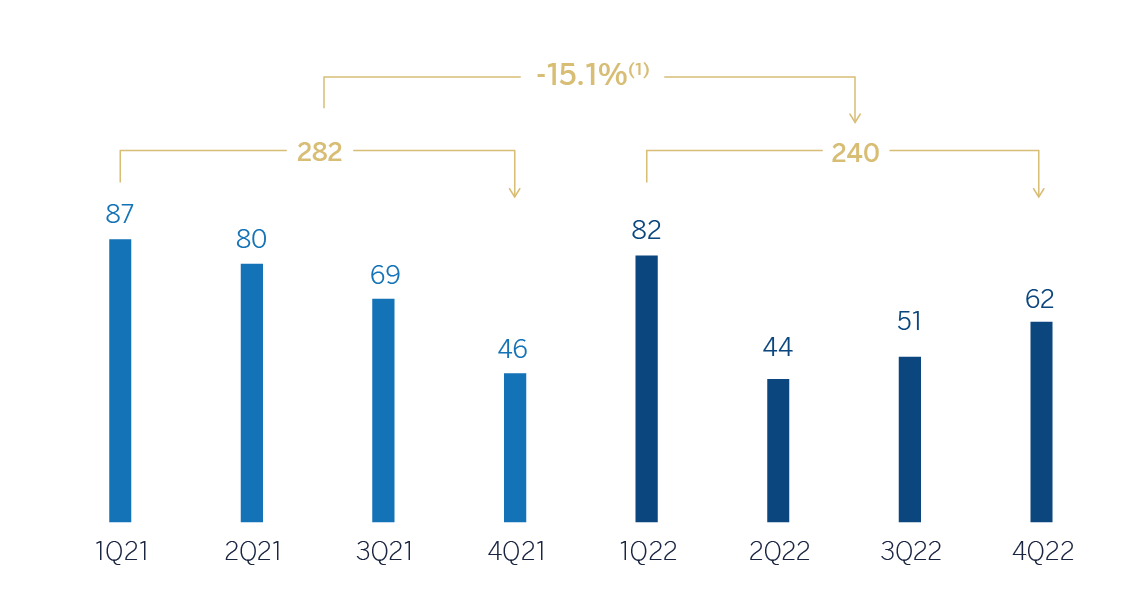
(1) (1)
FINANCIAL STATEMENTS AND RELEVANT BUSINESS INDICATORS (MILLIONS OF EUROS AND PERCENTAGE)
| Income statement | 2022 | ∆% | ∆% (1) | 2021 (2) |
|---|---|---|---|---|
| Net interest income | 332 | 17.4 | 15.5 | 283 |
| Net fees and commissions | 243 | 0.3 | (4.1) | 242 |
| Net trading income | 208 | (11.7) | (13.9) | 236 |
| Other operating income and expenses | 7 | (57.7) | (59.2) | 16 |
| Gross income | 790 | 1.7 | (1.1) | 776 |
| Operating expenses | (513) | 13.4 | 9.4 | (453) |
| Personnel expenses | (262) | 11.9 | 7.5 | (234) |
| Other administrative expenses | (228) | 15.1 | 11.6 | (198) |
| Depreciation | (23) | 12.6 | 9.9 | (20) |
| Operating income | 276 | (14.6) | (16.2) | 323 |
| Impairment on financial assets not measured at fair value through profit or loss | (13) | n.s. | n.s. | 27 |
| Provisions or reversal of provisions and other results | 14 | n.s. | n.s. | (4) |
| Profit (loss) before tax | 277 | (20.0) | (21.6) | 346 |
| Income tax | (37) | (46.6) | (47.3) | (70) |
| Profit (loss) for the period | 240 | (13.3) | (15.1) | 276 |
| Non-controlling interests | — | — | — | — |
| Net attributable profit (loss) | 240 | (13.3) | (15.1) | 276 |
- (1) At constant exchange rates.
- (2) Restated balances. For more information, please refer to the “Business Areas” section.
| Balance sheets | 31-12-22 | ∆% | ∆% (1) | 31-12-21 |
|---|---|---|---|---|
| Cash, cash balances at central banks and other demand deposits | 4,015 | 1.1 | (4.5) | 3,970 |
| Financial assets designated at fair value | 5,090 | (10.4) | (15.2) | 5,682 |
| Of which: Loans and advances | 4,230 | (9.8) | (15.1) | 4,691 |
| Financial assets at amortized cost | 40,425 | 33.4 | 31.4 | 30,315 |
| Of which: Loans and advances to customers | 37,375 | 38.6 | 36.5 | 26,965 |
| Inter-area positions | — | — | — | — |
| Tangible assets | 78 | 12.0 | 11.0 | 70 |
| Other assets | 343 | 17.9 | 15.1 | 291 |
| Total assets/liabilities and equity | 49,952 | 23.9 | 20.8 | 40,328 |
| Financial liabilities held for trading and designated at fair value through profit or loss | 4,397 | (13.1) | (18.1) | 5,060 |
| Deposits from central banks and credit institutions | 2,745 | 60.6 | 55.1 | 1,709 |
| Deposits from customers | 9,827 | 56.8 | 52.8 | 6,266 |
| Debt certificates | 1,561 | 33.9 | 31.5 | 1,166 |
| Inter-area positions | 26,061 | 18.0 | 16.0 | 22,085 |
| Other liabilities | 1,013 | 34.2 | 31.2 | 755 |
| Regulatory capital allocated | 4,348 | 32.3 | 29.9 | 3,287 |
| Relevant business indicators | 31-12-22 | ∆% | ∆% (1) | 31-12-21 |
|---|---|---|---|---|
| Performing loans and advances to customers under management (2) | 37,431 | 38.6 | 36.5 | 27,000 |
| Non-performing loans | 192 | (26.2) | (26.2) | 261 |
| Customer deposits under management (2) | 9,827 | 56.8 | 52.8 | 6,266 |
| Off-balance sheet funds (3) | 520 | (12.9) | (12.9) | 597 |
| Risk-weighted assets | 35,064 | 19.8 | 17.6 | 29,280 |
| Efficiency ratio (%) | 65.0 | 58.4 | ||
| NPL ratio (%) | 0.4 | 0.7 | ||
| NPL coverage ratio (%) | 131 | 116 | ||
| Cost of risk (%) | 0.04 | (0.11) |
(1) At constant exchange rates.
(2) Excluding repos.
(3) Includes pension funds.
Unless expressly stated otherwise, all the comments below on rates of change, for both activity and results, will be given at constant exchange rates. These rates, together with the changes at current exchange rates, can be found in the attached tables of the financial statements and relevant business indicators. Comments that refer to Europe exclude Spain.
Activity
The most relevant aspects of the evolution of BBVA Group's Rest of Business activity between January and December 2022 were:
- Lending activity (performing loans under management) registered an increase (+36.5%), with a favorable performance, mainly from the New York branch and, to a lesser extent, from the branches in Europe and Asia.
- With regard to asset quality indicators, the NPL ratio decreased by 31 basis points in the year to 0.4%, mainly thanks to the increased activity. For its part, the NPL coverage ratio closed the year at 131%, above the 116% registered at the end of December 2021.
- Customer funds under management increased by 47.2%, with growth in time deposits, mainly from Europe and the New York branch, which more than offset the decline in demand deposits and off-balance sheet funds.
Results
The good performance of the net interest income was offset by lower commissions and NTI. Together with the expenses increase in an environment of higher inflation and loan-loss provisions on normal level, represents a lower contribution of the unit to the Group results in 2022.
Regarding the year-on-year evolution of the area's income statement at the end of December 2022:
- The net interest income increased by 15.5%, with a positive performance in Europe and the New York branch.
- Net fees and commissions decreased by 4.1%, due to the lower fees and commissions recorded by BBVA Securities, which offset the good performance in Europe, and especially in New York.
- The NTI line recorded a decrease of 13.9%, mainly due to the lower results of the business in the United States.
- Decrease in the contribution of the other operating income and expenses line, as a result of the evolution of BBVA Securities.
- Increase in operating expenses of 9.4%, mainly due to higher personnel expenses in Europe and the New York branch, partially offset by the lower expenses recorded by BBVA Securities.
- The impairment on financial assets line closed December 2022 with a slight provision compared to the release of the previous year, originated in the New York branch.
- Favorable performance of the provisions or reversal of provisions line and other results mainly focused on lower provisions in New York.
- As a result, the area's cumulative net attributable profit between January and December 2022 was €240m (-15.1% year-on- year).
3.2.6 Corporate Center
FINANCIAL STATEMENTS (MILLIONS OF EUROS AND PERCENTAGE)
| Income statement | 2022 | ∆% | 2021 (1) |
|---|---|---|---|
| Net interest income | (109) | (33.0) | (163) |
| Net fees and commissions | (31) | (11.9) | (36) |
| Net trading income | (294) | n.s. | 266 |
| Other operating income and expenses | 105 | (27.7) | 146 |
| Gross income | (329) | n.s. | 212 |
| Operating expenses | (852) | 4.0 | (820) |
| Personnel expenses | (625) | 12.1 | (558) |
| Other administrative expenses | (21) | (68.7) | (68) |
| Depreciation | (206) | 6.2 | (194) |
| Operating income | (1,181) | 94.6 | (607) |
| Impairment on financial assets not measured at fair value through profit or loss | (2) | 6.1 | (2) |
| Provisions or reversal of provisions and other results | 8 | (73.4) | 32 |
| Profit (loss) before tax | (1,175) | 103.5 | (577) |
| Income tax | 277 | 265.3 | 76 |
| Profit (loss) for the period | (898) | 79.1 | (501) |
| Non-controlling interests | (25) | 21.9 | (20) |
| Net attributable profit (loss) excluding non-recurring impacts | (922) | 76.9 | (522) |
| Profit (loss) after tax from discontinued operations (2) | — | — | 280 | Net cost associated with the restructuring process | — | — | (696) |
| Net attributable profit (loss) | (922) | (1.6) | (938) |
- (1) Restated balances. For more information, please refer to the “Business Areas” section.
- (2) Including the results generated by BBVA USA and the rest of the companies in the United States sold to PNC on June 1, 2021.
| Balance sheets | 31-12-22 | ∆% | 31-12-21 |
|---|---|---|---|
| Cash, cash balances at central banks and other demand deposits | 856 | (91.1) | 9,609 |
| Financial assets designated at fair value | 2,390 | 13.9 | 2,099 |
| Of which: Loans and advances | — | n.s. | — |
| Financial assets at amortized cost | 3,262 | 49.9 | 2,175 |
| Of which: Loans and advances to customers | 278 | (72.4) | 1,006 |
| Inter-area positions | — | — | — |
| Tangible assets | 1,863 | (5.1) | 1,964 |
| Other assets | 14,349 | (4.3) | 14,988 |
| Total assets/liabilities and equity | 22,719 | (26.3) | 30,835 |
| Financial liabilities held for trading and designated at fair value through profit or loss | 108 | 29.1 | 84 |
| Deposits from central banks and credit institutions | 682 | (17.4) | 825 |
| Deposits from customers | 187 | 6.6 | 175 |
| Debt certificates | (863) | n.s. | 1,556 |
| Inter-area positions | 7,865 | 1.4 | 7,758 |
| Other liabilities | 4,012 | (42.1) | 6,932 |
| Regulatory capital allocated | (39,887) | 13.1 | (35,257) |
| Total equity | 50,615 | 3.8 | 48,760 |
Results
The Corporate Center recorded a net attributable loss of €922m in the year 2022. This result compares to the loss of €938m recorded in the same period of the previous year, which included the net costs associated with the restructuring process in Spain carried out by the Group in 2021, in addition to the results generated by the Group's businesses in the United States until their sale to PNC on June 1, 2021.
In addition to the aforementioned, the most relevant aspects of the year-on-year evolution of this aggregate are summarized below:
- Between January and December 2022, the NTI registered a negative result of €294m, which contrasts with the gains of €266m in the same period of the previous year, mainly due to the negative contribution of the foreign exchange hedge as a result of a better currencies evolution than expected and a very positive contribution from the Group's portfolio holdings in 2021.
- Contained operating expenses (+4.0%), mainly due to lower IT- related costs.
3.2.7 Other information: Corporate & Investment Banking
Highlights
- Lending activity and customer funds increase throughout the year
- Favorable evolution of recurring income and NTI, with double-digit growth in all business lines
- Improved efficiency
BUSINESS ACTIVITY (1) (VARIATION AT CONSTANT EXCHANGE RATES COMPARED TO 31-12-21)
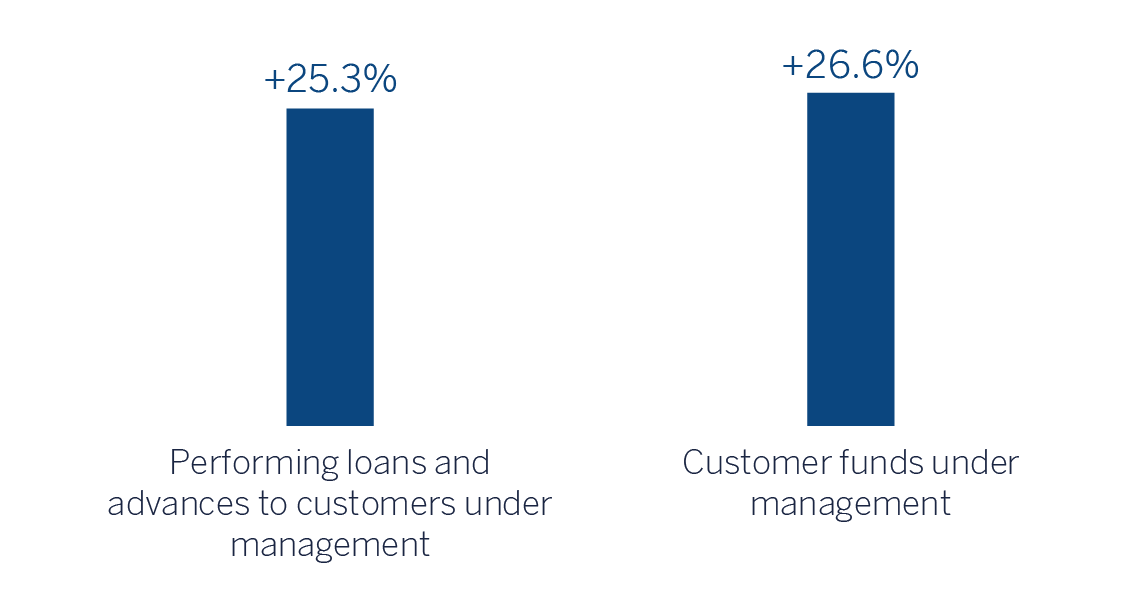
(1) Excluding repos.
GROSS INCOME / AVERAGE TOTAL ASSETS
(PERCENTAGE AT CONSTANT
EXCHANGE RATES)
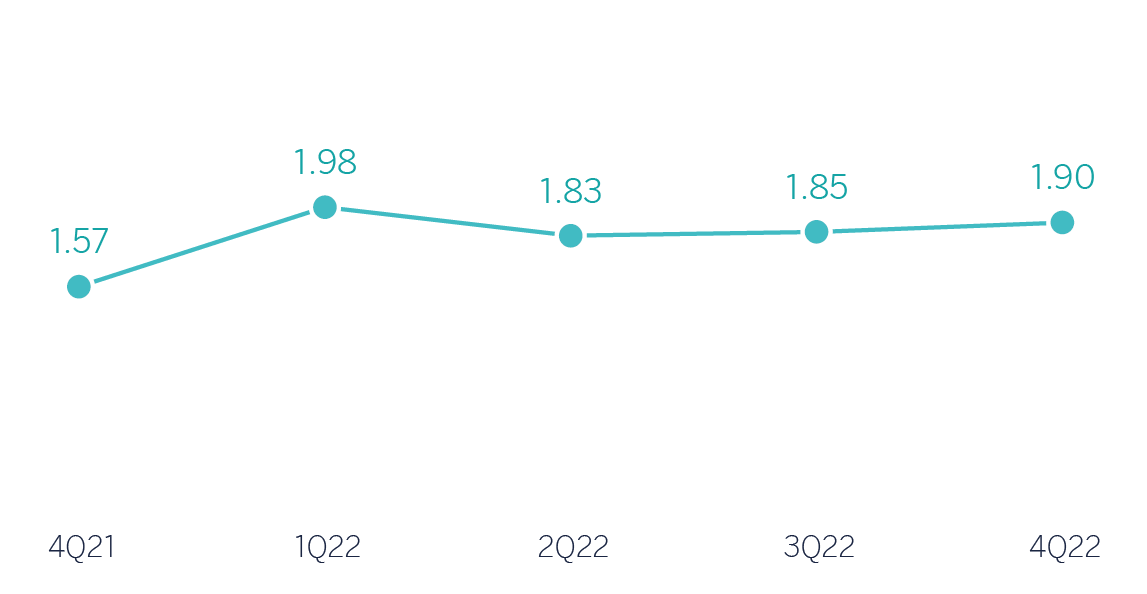
OPERATING INCOME (MILLIONS OF EUROS AT CONSTANT EXCHANGE RATES)
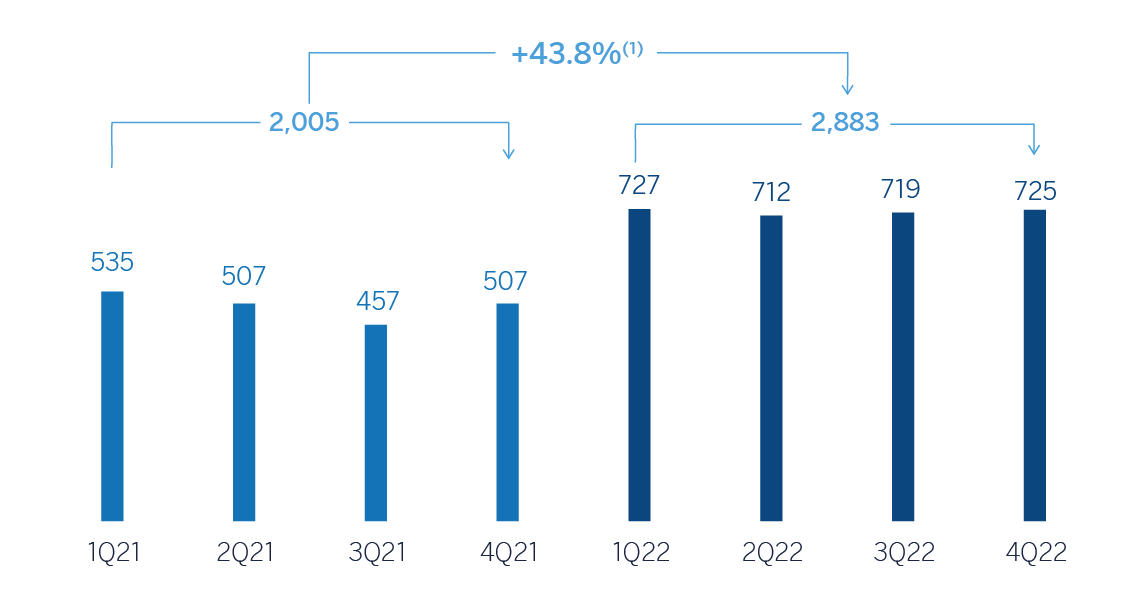
(1) At current exchange rates: +28.9%.
NET ATTRIBUTABLE PROFIT (LOSS) (MILLIONS OF EUROS AT CONSTANT EXCHANGE RATES)
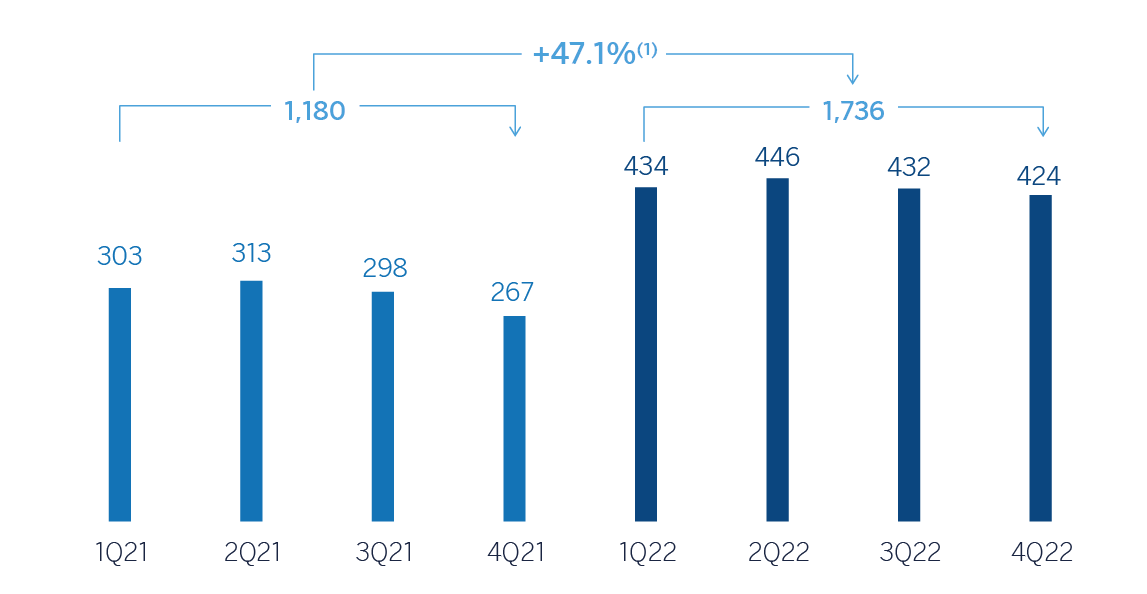
(1) At current exchange rates: +40.0%.
FINANCIAL STATEMENTS AND RELEVANT BUSINESS INDICATORS (MILLIONS OF EUROS AND PERCENTAGE)
| Income statement | 2022 (1) | ∆% | ∆% (2) | 2021 (3) |
|---|---|---|---|---|
| Net interest income | 1,952 | 23.9 | 31.3 | 1,576 |
| Net fees and commissions | 917 | 15.5 | 20.0 | 794 |
| Net trading income | 1,182 | 30.6 | 50.1 | 905 |
| Other operating income and expenses | (43) | 6.9 | 4.2 | (40) |
| Gross income | 4,008 | 23.9 | 33.7 | 3,235 |
| Operating expenses | (1,125) | 12.7 | 13.4 | (999) |
| Personnel expenses | (535) | 12.9 | 12.3 | (474) |
| Other administrative expenses | (485) | 16.4 | 19.3 | (417) |
| Depreciation | (105) | (2.3) | (3.7) | (107) |
| Operating income | 2,883 | 28.9 | 43.8 | 2,236 |
| Impairment on financial assets not measured at fair value through profit or loss | (104) | 51.0 | 110.3 | (69) |
| Provisions or reversal of provisions and other results | (12) | 0.9 | (8.9) | (12) |
| Profit (loss) before tax | 2,767 | 28.4 | 42.4 | 2,156 |
| Income tax | (779) | 32.2 | 45.6 | (589) |
| Profit (loss) for the period | 1,988 | 26.9 | 41.2 | 1,567 |
| Non-controlling interests | (253) | (22.6) | 10.9 | (327) |
| Net attributable profit (loss) | 1,736 | 40.0 | 47.1 | 1,240 |
- (1) For the translation of the income statement in those countries where hyperinflation accounting is applied, the punctual exchange rate as of December 31, 2022 is used.
- (2) At constant exchange rates.
- (2) Restated balances. For more information, please refer to the “Business Areas” section.
| Balance sheets | 31-12-22 | ∆% | ∆% (1) | 31-12-21 |
|---|---|---|---|---|
| Cash, cash balances at central banks and other demand deposits | 5,524 | 7.8 | 4.9 | 5,125 |
| Financial assets designated at fair value | 117,958 | (10.4) | (11.5) | 131,711 |
| Of which: Loans and advances | 45,360 | (17.9) | (18.2) | 55,232 |
| Financial assets at amortized cost | 89,440 | 23.6 | 23.6 | 72,363 |
| Of which: Loans and advances to customers | 77,208 | 24.4 | 24.5 | 62,042 |
| Inter-area positions | — | — | — | — |
| Tangible assets | 52 | 20.6 | 18.6 | 43 |
| Other assets | 862 | n.s. | n.s. | 110 |
| Total assets/liabilities and equity | 213,836 | 2.1 | 1.4 | 209,352 |
| Financial liabilities held for trading and designated at fair value through profit or loss | 98,790 | 3.7 | 2.4 | 95,283 |
| Deposits from central banks and credit institutions | 20,987 | 62.9 | 61.7 | 12,884 |
| Deposits from customers | 48,180 | 25.6 | 25.0 | 38,360 |
| Debt certificates | 5,292 | (7.9) | (12.3) | 5,746 |
| Inter-area positions | 25,576 | (42.1) | (41.9) | 44,196 |
| Other liabilities | 4,157 | 43.3 | 45.6 | 2,901 |
| Regulatory capital allocated | 10,855 | 8.7 | 8.3 | 9,983 |
| Relevant business indicators | 31-12-22 | ∆% | ∆% (1) | 31-12-21 |
|---|---|---|---|---|
| Performing loans and advances to customers under management (2) | 77,291 | 25.5 | 25.3 | 61,588 |
| Non-performing loans | 753 | (46.9) | (37.6) | 1,417 |
| Customer deposits under management (2) | 47,270 | 26.2 | 25.6 | 37,445 |
| Off-balance sheet funds (3) | 1,750 | 33.2 | 62.5 | 1,314 |
| Efficiency ratio (%) | 28.1 | 30.9 |
- (1) At constant exchange rates.
- (2) Excluding repos.
- (3) Includes mutual funds, customer portfolios and other off-balance sheet funds.
Unless expressly stated otherwise, all the comments below on rates of change, for both activity and results, will be given at constant exchange rates. For the conversion of these figures in those countries in which accounting for hyperinflation is applied, the punctual exchange rate as of December 31, 2022 is used. These rates, together with changes at current exchange rates, can be found in the attached tables of financial statements and relevant business indicators.
Activity
The most relevant aspects related to the area's activity in the year 2022 were:
- Lending activity (performing loans under management) continued to grow at double digit rates and accumulates a growth of 25.3%, with a positive performance in all geographical areas, except for Peru. Both Investment Banking & Finance (project finance and one-off corporate operations in the United States) and Global Transactional Banking, where Factoring and Confirming business showed a very positive dynamics, stand out.
- Customer funds increased by 26.6% thanks to the active management of the area, both in demand and time deposits. The deposits from the Group’s wholesale customers continue to be a relevant lever for the BBVA’s liquidity management.
Results
CIB generated a net attributable profit of €1,736m in 2022. These results, which do not include the application of hyperinflation accounting, represent an increase of 47.1% on a year-on-year basis, due to the growth in recurring income and NTI, which comfortably offset the higher expenses and provisions for impairment on financial assets. It should also be noted that all business lines of the CIB area recorded double-digit growth compared to the year 2021, both in revenues and net attributable profit.
The contribution by business areas, excluding the Corporate Center, to CIB's accumulated net attributable profit at the end of December 2022 was as follows: 25% Spain, 28% Mexico, 21% Turkey, 14% South America and 12% Rest of Business.
The most relevant aspects of the year-on-year evolution in the income statement of this aggregate are summarized below:
- Net interest income was 31.3% above the year 2021, with a good evolution in all business lines, highlighting the performance of Global Transactional Banking. This excellent result is due to the aforementioned good evolution of lending activity and the offer extension to our customers.
- Net fees and commissions recorded an increase of 20.0%, with positive evolution of all business lines, especially in Global Transactional Banking. Project finance operations and the good activity at guarantee scope stand out.
- NTI showed a good evolution (+50.1%), mainly due to the performance of the Global Markets unit, driven by the income from commercial activity in emerging markets and intraday trading in foreign exchange positions.
- Operating expenses increased by 13.4%, in a year-on-year comparison affected by the cost containment plans implemented by CIB in 2021, in addition to the high inflationary environment, although the area continues to focus its efforts on discretionary expenses management. Despite the aforementioned, the efficiency ratio stood at 28.1%, which is an improvement over the same period last year.
- Higher level of provisions for impairment on financial assets, with higher loan loss-provisions in Turkey.
- Finally, the provision and other results line recorded a negative result of €12m (-8.9% in year-on-year terms), highlighting in the year-on-year evolution the release of provisions for risks and contingent commitments made in the New York branch.
3.3 Subsequent events
On February 1, 2023, it was announced that a cash distribution for the amount of €0.31 gross per share in April as a final dividend for the year 2022 and the execution of a share buyback program of BBVA for an amount of €422 million were planned to propose to the corresponding corporate bodies for consideration, subject to obtaining the corresponding regulatory authorizations and the communication of the specific terms and conditions of the program before the inception of its execution (see Note 4 of the attached Consolidated Financial Statements).
In relation to the recent earthquake in Turkey, at these early stages, the Group is working on the definition of some emergency measures to help alleviate the effects of the humanitarian crisis caused by this catastrophe.
In addition, internal protocols have been put in place to monitor the situation and begin to assess the direct and future impacts for the Group that may arise from it. The direct exposure of the Group in the affected areas is not significant and, up to the date of approval of this consolidated financial statements and management report, no relevant impacts on the future continuity of the Group's operations and business in Turkey have been identified. However, it is not possible at this time to carry out a precise evaluation of the future impacts that may derive from this situation. Such impacts, if applicable, will be recorded in the Group's financial statements at for the respective period(s) impacted.
From January 1, 2023 to the date of preparation of these Consolidated Financial Statements, no other subsequent events not mentioned above in these financial statements have taken place that could significantly affect the Group’s earnings or its equity position.