The BBVA share
Global growth is slowing in the face of protectionist pressures affecting the global industrial sector and international trade, although first quarter data indicates a certain degree of stabilization, supported by the strength of the service sector, strong employment and low inflation. This trend is occurring across all regions, with cyclical slowdown in the United States, the trend toward growth moderation in China and the consolidation of lower growth in Europe. Thus, global growth is forecasted at around 3.3% in 2019 and 2020, implying a soft landing. However, the deterioration of trade negotiations between the United States and China since late April poses a major risk to the global economy.
In terms of monetary policy, the main central banks signaled their intention to adopt further measures that would provide a stimulus to counteract the high level of uncertainty in the economy, as well as the continued decrease in the long-term inflation outlook. The Federal Reserve, after raising its benchmark interest rate to 2.50% in December, laid the foundations to initiate interest rate reductions in the face of more moderate growth forecasts, weighed down by the trade threat and political uncertainty. For its part, the ECB strengthened its accommodative monetary policy stance by approving a new liquidity provision program, postponing its commitment to maintain interest rates at current levels until mid-2020, and indicating that it has a range of instruments at its disposal to combat growth and inflation risks, including the reduction of deposit rates or the renewal of the bond purchase program. Accordingly, interest rates will remain low in major economies, enabling emerging countries to gain room to maneuver.
The main stock market indexes performed strongly during the first half of 2019. In Europe, increases in the first quarter of the year were expanded on, with the Stoxx 50 and Euro Stoxx 50 rising 15.2% and 15.7%, respectively. In Spain, the rise of the Ibex 35 during the same period was more moderate at 7.7%, with a decline in the second quarter partially offsetting the increase during the first three months of the year. In the United States, the S&P 500 Index rose 17.3% in the first half of the year, maintaining in the second quarter the positive trend initiated in the first quarter.
The performance of European banking sector indexes remained positive during the first half of 2019, although to a lesser extent than general market indexes, having been hindered by declines during the second quarter of the year. The Stoxx Europe 600 Banks index, which includes banks in the United Kingdom, rose 0.9% during the first half of 2019, and the Euro Stoxx Banks index for the eurozone rose 1.3%, while in the United States, the S&P Regional Banks Select Industry Index built on gains made during the first quarter, rising by 14.4% compared to the close of the 2018 financial year.
In this context, the BBVA share outperformed the European banking sector during the first half of the year, with the share price increasing by 6.1% and closing June 2019 at €4.92.
BBVA share evolution
Compared with European indices (Base indice 100=31-12-18)

Regarding shareholder remuneration in 2019, in line with the policy announced in the Relevant Event released on February 1, 2017, BBVA plans to distribute between 35% and 40% of annual earnings in dividends. This shareholder remuneration policy, will consist of two cash payments that are expected to be made in October of this year and in April 2020, all subject to the appropriate approvals by the relevant governing bodies.
Shareholder remuneration
(Euros-gross/share)
Cash
Group information
Results
- In the first half of 2019, the overall growth in recurring revenue items is maintained, with a positive evolution in terms of net interest income in most business areas.
- The trend of containing operating expenses and improving the efficiency ratio compared to the same period of the previous year continues.
- As a result of the above, operating income increased 2.5% year-on-year.
- Impairment on financial assets increased 10.6% year-on-year as a result of the higher loan-loss provisions due to the deterioration of specific portfolios and the update of macroeconomic scenarios in the United States, Mexico and Turkey, especially in the first quarter of the year. The second quarter registered one of the lowest levels of impairment in recent years, thanks to lower needs in Spain, including the positive impact of the sale of non-performing and written-off loan portfolios.
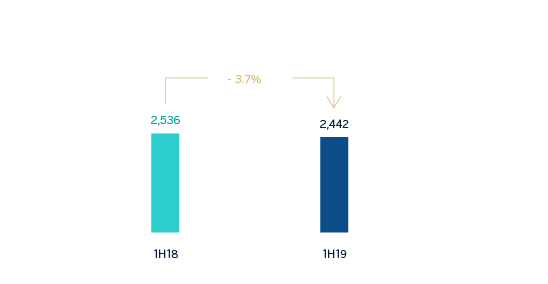
- Finally, the net attributable profit stood at €2,442m, a 3.7% lower than in the same period of 2018, but increased 9.8% in the second quarter of 2019 compared to the first quarter of the year.
Net attributable profit (Millions of Euros)
Net attributable profit breakdown (1) (Percentage. 1H19)
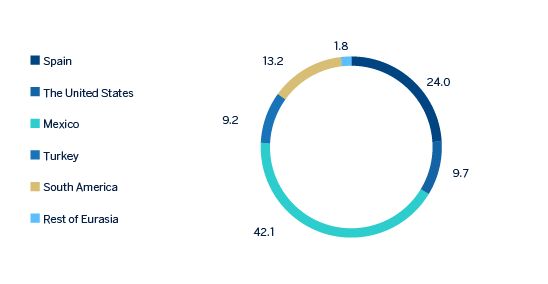
(1) Excludes the Corporate Center.
Balance sheet and business activity
- As of June 30, 2019, loans and advances to customers (gross) grew 0.8% compared to December 31, 2018, with improved levels of activity in all business areas.
- Strong performance of customer funds (up 1.0% compared to December 31, 2018). Noteworthy is the strong performance of demand deposits, mutual funds and pension funds.
- Issuance in June of a green bond of €1,000m in a senior non-preferred debt format (the second in this category issued by BBVA).
Solvency
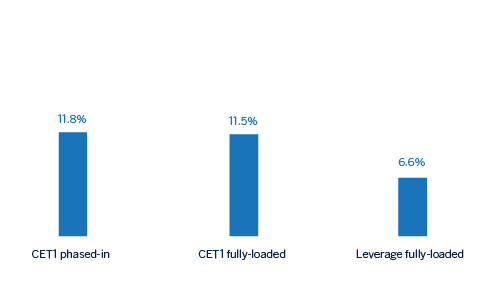
- The CET1 fully-loaded ratio reached 11.5%, up 17 basis points in the first half of the year due to recurring organic capital generation and supported by the positive evolution of the markets. Thus, this ratio is positioned within the range of this capital target defined for the Group.
Capital and leverage ratios (Percentage as of 30-06-19)
Risk management
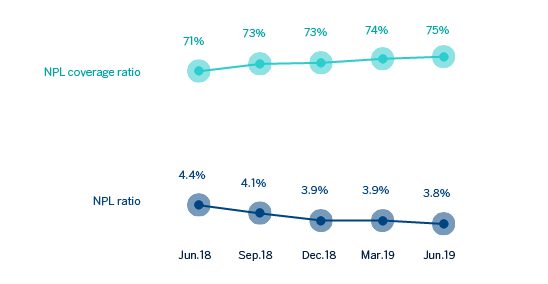
- Positive performance of risk metrics in the first half of 2019: Non-performing loans fell by 2.2% in the first six months of the year. As of June 30, 2019, the NPL ratio stood at 3.8%, the NPL coverage ratio 75%, and the cost of risk 0.91%.
- In the second quarter of 2019, the great majority of the credits that composed the loans from a non-performing and written-off mortgages loan portfolio, with a gross amount of €1,162m, were transferred to Anfora Investing UK Limited Partnership, an entity belonging to Canada Pension Plan Investment Board, has taken place. The positive impact of this transaction in the net attributable profit was €130m, and on the fully loaded CET1 it’s slightly positive. The transfer of the remainder of the portfolio took place in mid-July, with a slightly positive result which will be accounted for in the third quarter of 2019.
NPL and NPL coverage ratios (Percentage)
Transformation
- In the second quarter of 2019, the Group changed its brand name to BBVA in the countries in which it operates, discontinuing the local brand names in Argentina (Francés), the United States (Compass), Mexico (Bancomer) and Peru (Continental). The franchise in Turkey has changed its name to Garanti BBVA. As a result of this rebranding, BBVA has updated its logo and corporate identity.
- The new corporate identity reinforces BBVA's aim of offering a unique value proposition and a homogeneous customer experience which, leveraged on technology and data, will help customers manage their finances. In addition, it has a better design for the growing digital world in which BBVA operates and it’s an example of the Group's values, in particular "We are one team" value, which emphasizes the importance of its employees and their commitment to the BBVA project. The new brand also reflects the Bank's purpose: to bring the age of opportunity to everyone.
- While the new logo retains key elements already known by BBVA - especially the color and the use of capital letters- it introduces a new font and design that provides it with more versatility and functionality on digital channels and platforms.
- This change emphasises the Group's digital transformation and BBVA's commitment to offer its customers global products and services with the aim of being a global digital financial advisor, with a value proposition that helps people and companies in their real needs, lives and businesses in order to make better financial decisions.
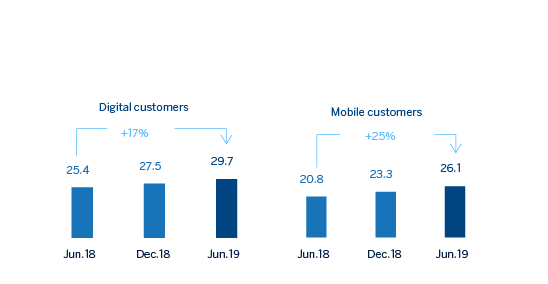
- In addition, the Group's digital and mobile customer base continues to grow, as well as its digital sales.
Digital and mobile customers (Millons)
Other matters of interest
- IFRS 16 “Leases” came into effect on January 1, 2019, which requires lessees to recognize the assets and liabilities arising from the rights and obligations of lease agreements. The main impacts are the recognition of an asset through the right of use and a liability based on future payment obligations. The impact of the first implementation was €3,419m and €3,472m, respectively, resulting in a decrease of 11 basis points of the CET1 capital ratio.
- In order to ensure that the information for 2019 is comparable to that of 2018, the balance sheets, income statements and ratios of the first three quarters of 2018 financial year for the Group and the South America business area have been restated to reflect the impact of the hyperinflation in Argentina as a result of the application of IAS 29 “Financial Reporting in Hyperinflationary Economies”. This impact was first registered in the third quarter of 2018, but with accounting effects as of January 1, 2018.
Business areas
Business areas
Spain (1)
€2,818M
-6.8%
The United States (2)
€1,615M
+5.1%
Mexico (2)
€3,901M
+5.6%
Turkey (2)
€1,677M
+11.9%
South America (3)
€1,994M
+9.7%
Rest of Eurasia (1)
€220M
+1.4%
Spain
Millions of euros and year-on-year changes
Highlights
- Favorable trend of activity, especially in high profitable segments.
- Net Interest income affected by lower ALCO contribution and the impact of IFRS 16.
- The positive trend in operating expenses continues.
- Positive impact of the sale of NPL and write-off portfolios on loan loss provisions and risk indicators.
Results
Net interest income
1,808-2.4% (1)
Gross income
2,818-6.8% (1)
Operating income
1,190-10.9% (1)
Net attributable profit
734-1.7% (1)
Activity (2)
Performing loans and advances to customers under mangement
+0.8%Customers funds under management
+2.2%
Risks
NPL coverage ratio
57%
58%
NPL ratio
5.1%
4.6%
Cost of risk
0.21%
-0.03%
DEC 18
JUN 19
(1) Year on year changes.
(2) Excluding repos.
The United States
Millions of euros and year-on-year changes at constant exchange rate
Highlights
- Good performance of retail lending.
- Positive trend in net interest income and customer spreads.
- The improvement in the efficiency ratio continues.
- Net attributable profit affected by the impairment on financial assets associated with specific customers of the commercial portfolio and to write-offs in consumer loans.
Results
Net interest income
1,217+5.2% (1)
Gross income
1,615+5.1% (1)
Operating income
655+12.7% (1)
Net attributable profit
297-27.8% (1)
Activity (2)
Performing loans and advances to customers under mangement
+3.7%Customers funds under management
+1.3%
Risks
NPL coverage ratio
85%
91%
NPL ratio
1.3%
1.3%
Cost of risk
0.39%
0.94%
DEC 18
JUN 19
(1) Year on year changes at constant exchange rate.
(2) Excluding repos.
Mexico
Millions of euros and year-on-year changes at constant exchange rate
Highlights
- Lending growth boosted by the retail portfolio.
- Favourable performance of customer funds especially in time deposits and off-balance sheet funds.
- Positive performance of net interest income growing above activity.
- Good asset quality indicators.
Results
Net interest income
3,042+7.8% (1)
Gross income
3,901+5.6% (1)
Operating income
2,611+6.1% (1)
Net attributable profit
1,287+0.6% (1)
Activity (2)
Performing loans and advances to customers under mangement
+5.9%Customers funds under management
+5.2%
Risks
NPL coverage ratio
154%
148%
NPL ratio
2.1%
2.2%
Cost of risk
3.07%
2.98%
DEC 18
JUN 19
(1) Year on year changes at constant exchange rate.
(2) Excluding repos.
Turkey
Millions of euros and year-on-year changes at constant exchange rate
Highlights
- Positive trend in activity.
- Good performance of net interest income, favored by the income from inflation-linked bonds.
- Operating expenses growth below the inflation rate.
- Positive evolution of the recurring revenue items offset by higher loan-loss provisions on financial assets.
Results
Net interest income
1,353+15.0% (1)
Gross income
1,677+11.9% (1)
Operating income
1,084+11.7% (1)
Net attributable profit
282-2.8% (1)
Activity (2)
Performing loans and advances to customers under mangement
-0.9%Customers funds under management
+14.1%
Risks
NPL coverage ratio
81%
75%
NPL ratio
5.3%
6.3%
Cost of risk
2.44%
1.57%
DEC 18
JUN 19
(1) Year on year changes at constant exchange rate.
(2) Excluding repos.
South America
Millions of euros and year-on-year changes at constant exchange rates
Highlights
- Positive trend of lending in the main countries.
- Good performance of net interest income is maintained.
- Net Attributable profit impacted by Argentina's hyperinflation adjustment.
- Positive contribution of the main countries: Argentina, Colombia and Peru to the Group’s attributable profit.
Results
Net interest income
1,613+12.1% (1)
Gross income
1,994+9.7% (1)
Operating income
1,215+22.2% (1)
Net attributable profit (3)
404+35.7% (1)
Activity (2) (3)
Performing loans and advances to customers under mangement
+6.3%Customers funds under management
+11.5%
Risks
NPL coverage ratio
97%
95%
NPL ratio
4.3%
4.4%
Cost of risk
1.44%
1.89%
DEC 18
JUN 19
(1) Year on year changes at constant exchange rates.
(2) Excluding repos.
(3) Excluding BBVA Chile as of June 30, 2018.
Rest of Eurasia
Millions of euros and year-on-year changes
Highlights
- Good performance in lending.
- Positive trend of net interest income, in an environment of negative interest rates.
- Moderated growth of the operating expenses.
- Improvement of asset quality indicators.
Results
Net interest income
84+2.2% (1)
Gross income
220+1.4% (1)
Operating income
78+1.5% (1)
Net attributable profit
55-8.0% (1)
Activity (2)
Performing loans and advances to customers under mangement
+5.5%Customers funds under management
-15.5%
Risks
NPL coverage ratio
83%
98%
NPL ratio
1.7%
1.4%
Cost of risk
-0.11%
0.12%
DEC 18
JUN 19
(1) Year on year changes.
(2) Excluding repos.
(1) Gross income. Year-on-year change.
(2) Gross income. Year-on-year change at constant exchange rate.
(3) Gross income. Year-on-year changes at constant exchange rates.
Business Areas
Spain (1)

€2,818 Mill.
-6.8%
Millions of euros and year-on-year changes
Highlights
- Favorable trend of activity, especially in high profitable segments.
- Net Interest income affected by lower ALCO contribution and the impact of IFRS 16.
- The positive trend in operating expenses continues.
- Positive impact of the sale of NPL and write-off portfolios on loan loss provisions and risk indicators.
Results
Net interest income
1,808-2.4% (1)
Gross income
2,818-6.8% (1)
Operating income
1,190-10.9% (1)
Net attributable profit
734-1.7% (1)
Activity (2)
Performing loans and advances to customers under mangement
+0.8%Customers funds under management
+2.2%
Risks
NPL coverage ratio
57%
58%
NPL ratio
5.1%
4.6%
Cost of risk
0.21%
-0.03%
DEC 18
JUN 19
(1) Year on year changes.
(2) Excluding repos.
The United States (2)
€1,615 Mill.
+5.1%
Millions of euros and year-on-year changes at constant exchange rate
Highlights
- Good performance of retail lending.
- Positive trend in net interest income and customer spreads.
- The improvement in the efficiency ratio continues.
- Net attributable profit affected by the impairment on financial assets associated with specific customers of the commercial portfolio and to write-offs in consumer loans.
Results
Net interest income
1,217+5.2% (1)
Gross income
1,615+5.1% (1)
Operating income
655+12.7% (1)
Net attributable profit
297-27.8% (1)
Activity (2)
Performing loans and advances to customers under mangement
+3.7%Customers funds under management
+1.3%
Risks
NPL coverage ratio
85%
91%
NPL ratio
1.3%
1.3%
Cost of risk
0.39%
0.94%
DEC 18
JUN 19
(1) Year on year changes at constant exchange rate.
(2) Excluding repos.
Mexico (2)
€3,901 Mill.
+5.6%
Millions of euros and year-on-year changes at constant exchange rate
Highlights
- Lending growth boosted by the retail portfolio.
- Favourable performance of customer funds especially in time deposits and off-balance sheet funds.
- Positive performance of net interest income growing above activity.
- Good asset quality indicators.
Results
Net interest income
3,042+7.8% (1)
Gross income
3,901+5.6% (1)
Operating income
2,611+6.1% (1)
Net attributable profit
1,287+0.6% (1)
Activity (2)
Performing loans and advances to customers under mangement
+5.9%Customers funds under management
+5.2%
Risks
NPL coverage ratio
154%
148%
NPL ratio
2.1%
2.2%
Cost of risk
3.07%
2.98%
DEC 18
JUN 19
(1) Year on year changes at constant exchange rate.
(2) Excluding repos.
Turkey (2)
€1,677 Mill.
+11.9%
Millions of euros and year-on-year changes at constant exchange rate
Highlights
- Positive trend in activity.
- Good performance of net interest income, favored by the income from inflation-linked bonds.
- Operating expenses growth below the inflation rate.
- Positive evolution of the recurring revenue items offset by higher loan-loss provisions on financial assets.
Results
Net interest income
1,353+15.0% (1)
Gross income
1,677+11.9% (1)
Operating income
1,084+11.7% (1)
Net attributable profit
282-2.8% (1)
Activity (2)
Performing loans and advances to customers under mangement
-0.9%Customers funds under management
+14.1%
Risks
NPL coverage ratio
81%
75%
NPL ratio
5.3%
6.3%
Cost of risk
2.44%
1.57%
DEC 18
JUN 19
(1) Year on year changes at constant exchange rate.
(2) Excluding repos.
South America (3)
€1,994 Mill.
+9.7%
Millions of euros and year-on-year changes at constant exchange rates
Highlights
- Positive trend of lending in the main countries.
- Good performance of net interest income is maintained.
- Net Attributable profit impacted by Argentina's hyperinflation adjustment.
- Positive contribution of the main countries: Argentina, Colombia and Peru to the Group’s attributable profit.
Results
Net interest income
1,613+12.1% (1)
Gross income
1,994+9.7% (1)
Operating income
1,215+22.2% (1)
Net attributable profit (3)
404+35.7% (1)
Activity (2) (3)
Performing loans and advances to customers under mangement
+6.3%Customers funds under management
+11.5%
Risks
NPL coverage ratio
97%
95%
NPL ratio
4.3%
4.4%
Cost of risk
1.44%
1.89%
DEC 18
JUN 19
(1) Year on year changes at constant exchange rates.
(2) Excluding repos.
(3) Excluding BBVA Chile as of June 30, 2018.
Rest of Eurasia (1)
€220 Mill.
+1.4%
Millions of euros and year-on-year changes
Highlights
- Good performance in lending.
- Positive trend of net interest income, in an environment of negative interest rates.
- Moderated growth of the operating expenses.
- Improvement of asset quality indicators.
Results
Net interest income
84+2.2% (1)
Gross income
220+1.4% (1)
Operating income
78+1.5% (1)
Net attributable profit
55-8.0% (1)
Activity (2)
Performing loans and advances to customers under mangement
+5.5%Customers funds under management
-15.5%
Risks
NPL coverage ratio
83%
98%
NPL ratio
1.7%
1.4%
Cost of risk
-0.11%
0.12%
DEC 18
JUN 19
(1) Year on year changes.
(2) Excluding repos.
(1) Gross income. Year-on-year change.
(2) Gross income. Year-on-year change at constant exchange rate.
(3) Gross income. Year-on-year changes at constant exchange rates.
News
Contact
 Shareholder attention line
912 24 98 21
 Subscription service
  Shareholder Office
 Contact email