Results
In the first half of 2019, BBVA Group generated a net attributable profit of €2,442m, a decrease of 3.7% compared to the same period of 2018 (down 3.3% at constant exchange rates), while it showed an increase of 9.8% compared to the first quarter of the year. The strong performance in recurring revenue items, especially that of net interest income, along with the positive impact on the impairment on financial assets due to the sale of non-performing and written-off loans explain the improvement when compared to the first quarter of 2019.
Consolidated income statement: quarterly evolution (Millions of euros)
| 2019 | 2018 | |||||
|---|---|---|---|---|---|---|
| 2Q | 1Q | 4Q | 3Q | 2Q | 1Q | |
| Net interest income | 4,566 | 4,420 | 4,692 | 4,309 | 4,302 | 4,287 |
| Net fees and commissions | 1,256 | 1,214 | 1,226 | 1,173 | 1,244 | 1,236 |
| Net trading income | 116 | 426 | 316 | 212 | 285 | 410 |
| Other operating income and expenses | (18) | 8 | (83) | 38 | 6 | 92 |
| Gross income | 5,920 | 6,069 | 6,151 | 5,733 | 5,838 | 6,026 |
| Operating expenses | (2,952) | (2,922) | (2,981) | (2,825) | (2,921) | (2,975) |
| Personnel expenses | (1,578) | (1,553) | (1,557) | (1,459) | (1,539) | (1,565) |
| Other administrative expenses | (976) | (977) | (1,119) | (1,062) | (1,087) | (1,106) |
| Depreciation | (398) | (392) | (305) | (304) | (295) | (304) |
| Operating income | 2,968 | 3,147 | 3,170 | 2,908 | 2,917 | 3,050 |
| Impairment on financial assets not measured at fair value through profit or loss | (753) | (1,023) | (1,353) | (1,023) | (783) | (823) |
| Provisions or reversal of provisions | (117) | (144) | (66) | (123) | (85) | (99) |
| Other gains (losses) | (3) | (22) | (183) | (36) | 67 | 41 |
| Profit/(loss) before tax | 2,095 | 1,957 | 1,568 | 1,727 | 2,116 | 2,170 |
| Income tax | (577) | (559) | (421) | (419) | (605) | (617) |
| Profit/(loss) after tax from ongoing operations | 1,519 | 1,398 | 1,147 | 1,307 | 1,511 | 1,553 |
| Results from corporate operations (1) | - | - | - | 633 | - | - |
| Profit/(loss) for the year | 1,519 | 1,398 | 1,147 | 1,941 | 1,511 | 1,553 |
| Non-controlling interests | (241) | (234) | (145) | (154) | (265) | (262) |
| Net attributable profit | 1,278 | 1,164 | 1,001 | 1,787 | 1,245 | 1,290 |
| Net attributable profit excluding results from corporate operations | 1,278 | 1,164 | 1,001 | 1,154 | 1,245 | 1,290 |
| Earning per share (euros) (2) | 0.17 | 0.16 | 0.14 | 0.26 | 0.17 | 0.18 |
- General note: the application of accounting for hyperinflation in Argentina was performed for the first time in September 2018 with accounting effects on January 1, 2018, recording the impact of the 9 months in the third quarter. In order to make the 2019 information comparable to the 2018, the income statements for the first three quarters of 2018 have been reexpressed to reflect the impacts of inflation on their income and expenses.
- (1) Includes net capital gains from the sale of BBVA Chile.
- (2) Adjusted by additional Tier 1 instrument remuneration.
Consolidated income statement (Millions of euros)
| 1H19 | ∆% | ∆% at constant exchange rates | 1H18 | |
|---|---|---|---|---|
| Net interest income | 8,987 | 4.6 | 7.1 | 8,590 |
| Net fees and commissions | 2,470 | (0.4) | 1.4 | 2,480 |
| Net trading income | 542 | (22.0) | (20.9) | 696 |
| Other operating income and expenses | (10) | n.s. | n.s. | 98 |
| Gross income | 11,989 | 1.1 | 3.3 | 11,863 |
| Operating expenses | (5,874) | (0.4) | 1.2 | (5,896) |
| Personnel expenses | (3,131) | 0.9 | 2.6 | (3,104) |
| Other administrative expenses | (1,953) | (11.0) | (9.5) | (2,193) |
| Depreciation | (790) | 32.0 | 33.3 | (599) |
| Operating income | 6,115 | 2.5 | 5.4 | 5,967 |
| Impairment on financial assets not measured at fair value through profit or loss | (1,777) | 10.6 | 12.9 | (1,606) |
| Provisions or reversal of provisions | (261) | 41.7 | 45.0 | (184) |
| Other gains (losses) | (25) | n.s. | n.s. | 108 |
| Profit/(loss) before tax | 4,052 | (5.4) | (2.4) | 4,286 |
| Income tax | (1,136) | (7.1) | (4.7) | (1,222) |
| Profit/(loss) after tax from ongoing operations | 2,916 | (4.8) | (1.5) | 3,063 |
| Results from corporate operations | - | - | - | - |
| Profit/(loss) for the year | 2,916 | (4.8) | (1.5) | 3,063 |
| Non-controlling interests | (475) | (10.1) | 9.4 | (528) |
| Net attributable profit | 2,442 | (3.7) | (3.3) | 2,536 |
| Net attributable profit excluding results from corporate operations | 2,442 | (3.7) | (3.3) | 2,536 |
| Earning per share (euros) (1) | 0.34 | 0.36 |
- General note: the application of accounting for hyperinflation in Argentina was performed for the first time in September 2018 with accounting effects on January 1, 2018, recording the impact of the 9 months in the third quarter. In order to make the 2019 information comparable to the 2018, the income statements for the first three quarters of 2018 have been reexpressed to reflect the impacts of inflation on their income and expenses.
- (1) Adjusted by additional Tier 1 instrument remuneration.
Unless expressly indicated otherwise, to better understand the changes in the main headings of the Group's income statement, the year-on-year percentage changes provided below refer to constant exchange rates and the quarterly changes are for the quarter ending with respect to the previous quarter.
Gross income
Gross income grew 3.3% year-on-year, supported by the strong performance of the net interest income and, to a lesser extent, the growth of net fees and commissions.
Gross income (Millions of euros)
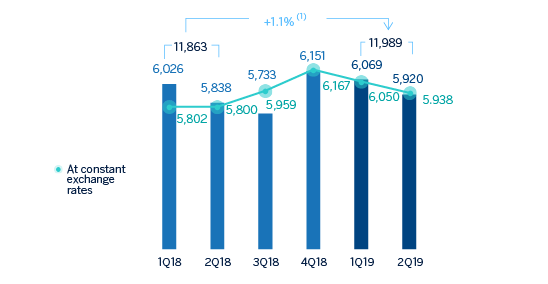
(1) At constant exchange rates: +3.3%.
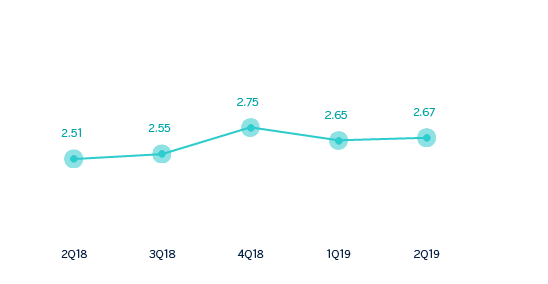
Net interest income increased 7.1% year-on-year and 4.0% quarter-on-quarter. This is explained by a higher activity during the first half of the year in Spain, Mexico, Turkey, South America and the Rest of Eurasia.
Net interest income/ATAs (Percentage)
Net fees and commissions in the first half of 2019 grew 1.4% year-on-year, driven by an adequate diversification. Net fees and commissions increased by 4.2% in the second quarter.
As a result, the more recurring revenues items (net interest income plus net fees and commissions) increased by 5.8% year-on-year (up 4.0% compared to the previous quarter).
Net interest income plus fees and commissions (Millions of euros)
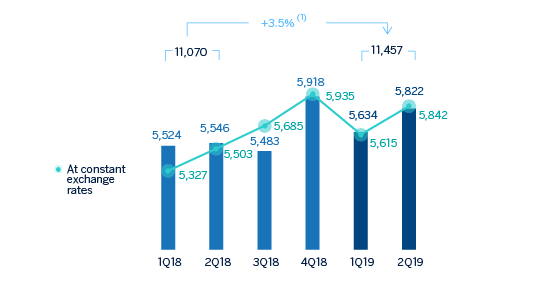
(1) At constant exchange rates: +5.8%.
The positive contribution of NTI moderated in the first half of 2019 compared to the same period in 2018, mainly explained by a lower contribution from Corporate & Investment Banking (CIB), which was partially offset by capital gains coming from the sale of Prisma Medios de Pago, S.A. in Argentina.
Other operating income and expenses recorded a negative balance as a result of BBVA's annual contribution in Spain to the Single Resolution Fund (SRF) of €144m made in the second quarter (€124m in the same period of 2018), and the negative impact from the inflation in Argentina. However, the net contribution of the insurance business grew by 10.4% year-on-year.
Operating income
Operating expenses in the first half of 2019 increased 1.2% year-on-year, (down 0.4% at current exchange rates), with a variation below the inflation recorded in most of the countries where BBVA operates, highlighting the cost reduction in Spain.
Operating expenses (Millions of euros)
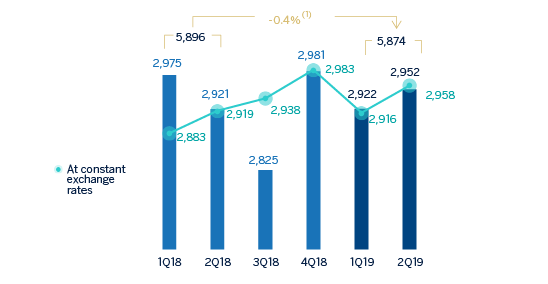
(1) At constant exchange rates: +1.2%.
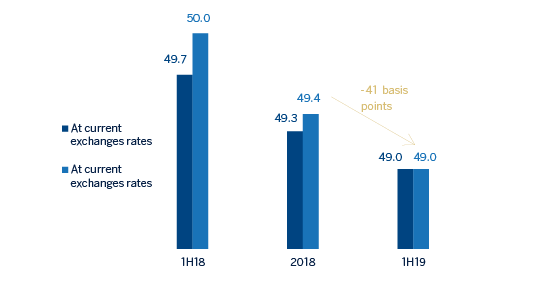
The efficiency ratio stood at 49.0% in the first half of the year, improving as a result of the lower growth in expenses compared to the increase in gross income, and it was slightly below the level reached in the 2018 financial year (49.3%). Operating income grew 5.4% year-on-year.
Efficiency ratio (Percentage)
Operating Income (Millions of euros)
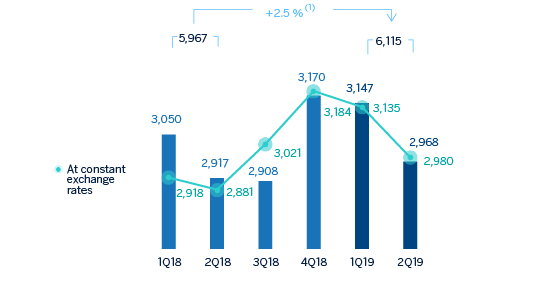
(1) At constant exchange rates: +5.4%.
Provisions and other
Impairment on financial assets not measured at fair value through profit or loss (impairment on financial assets) in the second quarter of 2019 stood at €753m, one of the lowest quarterly figures in the last five years (down 25.6% in the quarter). In the first half of 2019, impairment on financial assets increased by 12.9% compared to the same period of 2018. By business area, the United States recorded a higher loan-loss provisions for specific customers in the commercial portfolio and increased write-offs in consumer loans. In the case of Mexico and Turkey higher loan-loss provisions are explained by the deterioration of specific customer portfolios and by d the update of their macroeconomic scenarios. On the other hand Spain registered a positive amount due to the lower loan-loss provisioning needs mainly due to, the positive effect of the sale of non-performing and written-off portfolios especially mortgage loans during the second quarter of 2019.
Impairment on financial assests (net) (Millions of euros)
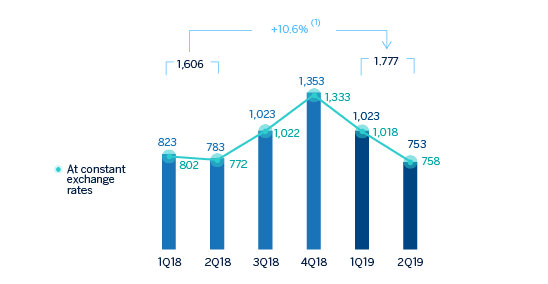
(1) At constant exchange rates: +12.9%.
Provisions or reversal of provisions (provisions) increased by 45.0% compared to the same period of 2018, which incorporated the gains for certain sales of holdings carried out in Mexico, Turkey and the former Non Core Real Estate business area.
Results
As a result of the above, the Group's net attributable profit in the first half of 2019 was 3.3% lower than in the same period last year (down 3.7% at current exchange rates), featured by higher levels of recurring revenues but negatively impacted by lower net trading income and by higher loan-loss provisions.
Net attributable profit (Millions of euros)
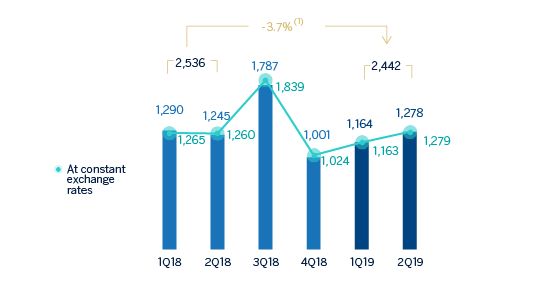
(1) At constant exchange rates: -3.3%.
By business area, during the first six months of the year Spain generated a net attributable profit of €734m, the United States contributed €297m, Mexico registered €1,287m of profit, Turkey contributed €282m, South America €404m and the Rest of Eurasia €55m.
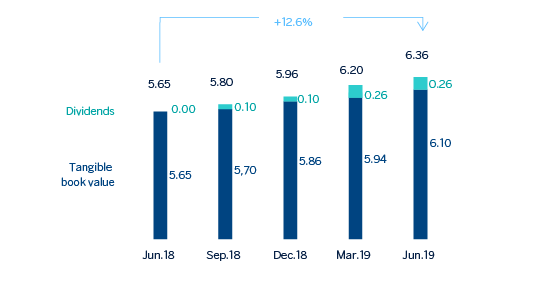
Tangible book value per share and shareholder remuneration (Euros)
Earning per share (1) (Euros)
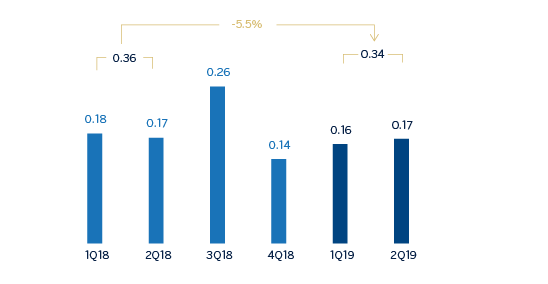
(1) Adjusted by additional Tier 1 instrument remuneration.
ROE and ROTE (1) (Percentage)
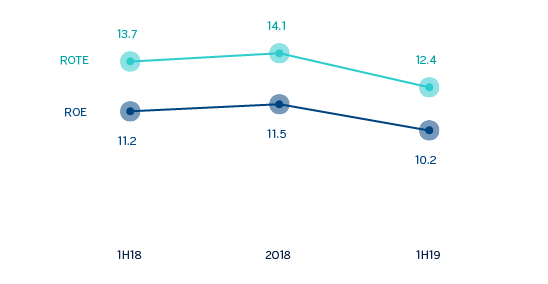
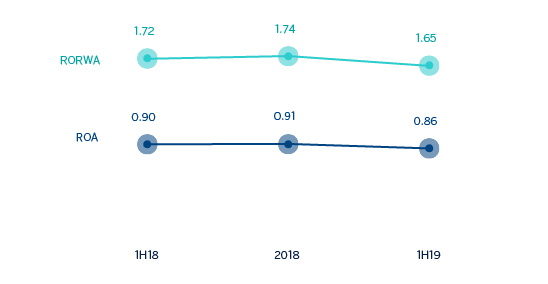
(1) The ROE and ROTE ratios include, in the denominator, the Group’s average shareholders’ funds and take into account the item called “Accumulated other comprehensive income”, which forms part of the equity. Excluding this item, the ROE would stand at 9.8% in 1H18, 10.1% in 2018 and 9.0% in 1H19; and the ROTE on 11.7%, 11.9% and 10.6%, respectively.
ROA and RORWA (Percentage)