Results
BBVA generated a net attributable profit of €4,323m in the first nine months of 2018, which represents a year-on-year increase of 25.3% (+43.0% at constant exchange rates). This increase includes the results from corporate operations originated by the capital gains net of taxes from the sale of BBVA Chile. Moreover, at constant exchange rates, it is worth mentioning the good performance of recurring revenue, containment of operating expenses and lower loan-loss impairments and provisions, which offset the lower contribution from net trading income (NTI) compared to the same period the previous year.
Consolidated income statement: quarterly evolution (Millions of Euros)
| IFRS 9 | IAS 39 | ||||||
|---|---|---|---|---|---|---|---|
| 2018 | 2017 | ||||||
| 3Q | 2Q | 1Q | 4Q | 3Q | 2Q | 1Q | |
| Net interest income | 4,256 | 4,355 | 4,288 | 4,557 | 4,399 | 4,481 | 4,322 |
| Net fees and commissions | 1,161 | 1,256 | 1,236 | 1,215 | 1,249 | 1,233 | 1,223 |
| Net trading income | 200 | 297 | 410 | 552 | 347 | 378 | 691 |
| Dividend income | 11 | 72 | 12 | 86 | 35 | 169 | 43 |
| Share of profit or loss of entities accounted for using the equity method | (3) | 6 | 8 | 5 | 6 | (2) | (5) |
| Other operating income and expenses | (102) | (10) | 142 | (54) | 154 | 77 | 108 |
| Gross income | 5,522 | 5,977 | 6,096 | 6,362 | 6,189 | 6,336 | 6,383 |
| Operating expenses | (2,779) | (2,963) | (2,979) | (3,114) | (3,075) | (3,175) | (3,137) |
| Personnel expenses | (1,438) | (1,560) | (1,566) | (1,640) | (1,607) | (1,677) | (1,647) |
| Other administrative expenses | (1,044) | (1,105) | (1,106) | (1,143) | (1,123) | (1,139) | (1,136) |
| Depreciation | (297) | (299) | (307) | (331) | (344) | (359) | (354) |
| Operating income | 2,743 | 3,014 | 3,117 | 3,248 | 3,115 | 3,161 | 3,246 |
| Impairment on financial assets not measured at fair value through profit or loss | (1,018) | (788) | (823) | (1,885) | (976) | (997) | (945) |
| Provisions or reversal of provisions | (121) | (86) | (99) | (180) | (201) | (193) | (170) |
| Other gains (losses) | (36) | 67 | 41 | (267) | 44 | (3) | (66) |
| Profit/(loss) before tax | 1,569 | 2,207 | 2,237 | 916 | 1,982 | 1,969 | 2,065 |
| Income tax | (428) | (602) | (611) | (499) | (550) | (546) | (573) |
| Profit/(loss) for the year | 1,141 | 1,604 | 1,626 | 417 | 1,431 | 1,422 | 1,492 |
| Non-controlling interests | 633 | - | - | - | - | - | - |
| Profit/(loss) for the year | 1,774 | 1,604 | 1,626 | 417 | 1,431 | 1,422 | 1,492 |
| Non-controlling interests | (100) | (295) | (286) | (347) | (288) | (315) | (293) |
| Net attributable profit | 1,674 | 1,309 | 1,340 | 70 | 1,143 | 1,107 | 1,199 |
| Net attributable profit excluding results from corporate operations | 1,040 | 1,309 | 1,340 | 70 | 1,143 | 1,107 | 1,199 |
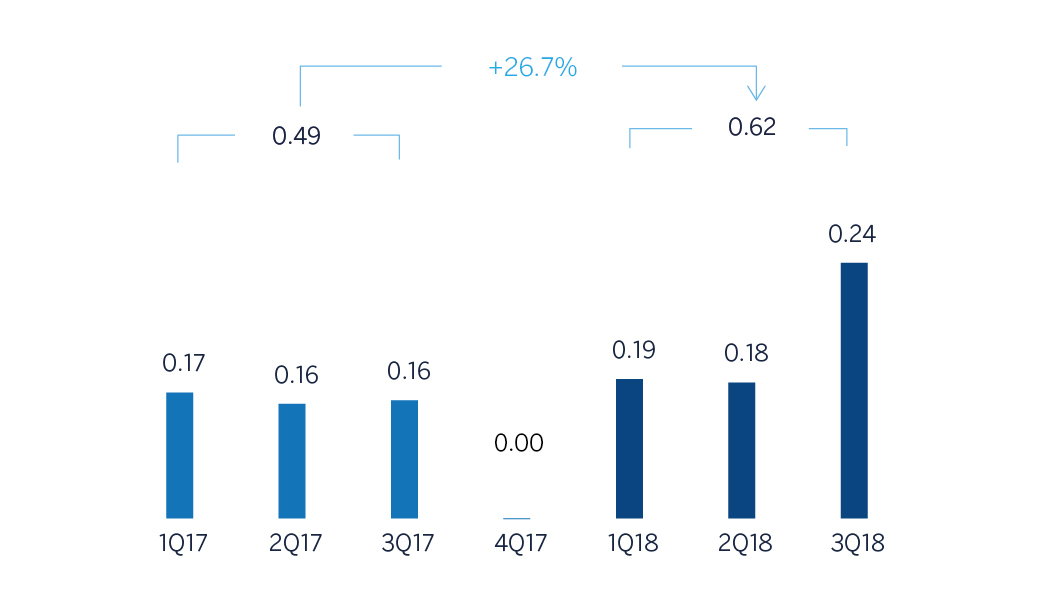
| Earning per share (euros) (1) | 0.24 | 0.18 | 0.19 | (0.00) | 0.16 | 0.16 | 0.17 |
- (1) Includes net capital gains from the sale of BBVA Chile.
- (2) Adjusted by additional Tier 1 instrument remuneration.
Consolidated income statement (Millions of Euros)
| IFRS 9 | IAS 39 | |||
|---|---|---|---|---|
| Jan.-Sep. 18 | ∆% | ∆% at constant exchange rates | Jan.-Sep. 17 | |
| Net interest income | 12,899 | (2.3) | 10.2 | 13,202 |
| Net fees and commissions | 3,653 | (1.4) | 9.4 | 3,705 |
| Net trading income | 907 | (35.9) | (31.2) | 1,416 |
| Dividend income | 95 | (61.7) | (60.6) | 247 |
| Share of profit or loss of entities accounted for using the equity method | 11 | n.s. | n.s. | (1) |
| Other operating income and expenses | 30 | (91.1) | (89.3) | 339 |
| Gross income | 17,596 | (6.9) | 4.3 | 18,908 |
| Operating expenses | (8,721) | (7.1) | 2.7 | (9,386) |
| Personnel expenses | (4,563) | (7.5) | 2.3 | (4,931) |
| Other administrative expenses | (3,255) | (4.2) | 6.6 | (3,398) |
| Depreciation | (903) | (14.5) | (7.5) | (1,057) |
| Operating income | 8,875 | (6.8) | 5.8 | 9,522 |
| Impairment on financial assets not measured at fair value through profit or loss | (2,629) | (9.9) | (1.2) | (2,917) |
| Provisions or reversal of provisions | (307) | (45.7) | (43.1) | (564) |
| Other gains (losses) | 73 | n.s. | n.s. | (25) |
| Profit/(loss) before tax | 6,012 | (0.0) | 16.6 | 6,015 |
| Income tax | (1,641) | (1.7) | 12.8 | (1,670) |
| Profit/(loss) for the year | 4,371 | 0.6 | 18.1 | 4,345 |
| Resultado de operaciones corporativas (1) | 633 | - | - | - |
| Resultado del ejercicio | 5,004 | 15.2 | 35.2 | 4,345 |
| Non-controlling interests | (682) | (23.9) | 0.4 | (896) |
| Net attributable profit | 4,323 | 25.3 | 43.0 | 3,449 |
| Net attributable profit excluding results from corporate operations | 3,689 | 7.0 | 22.0 | 3,449 |
| Earning per share (euros) (2) | 0.62 | 0.49 | ||
- (1) Includes net capital gains from the sale of BBVA Chile.
- (2) Adjusted by additional Tier 1 instrument remuneration.
Unless expressly indicated otherwise, to better understand the changes in the main headings of the Group's income statement, the year-on-year percentage changes given below refer to constant exchange rates.
Gross income
Gross income accumulated in the period grew by 4.3% year-on-year, strongly supported by the positive performance of the more recurring items.
Gross income (Millions of Euros)
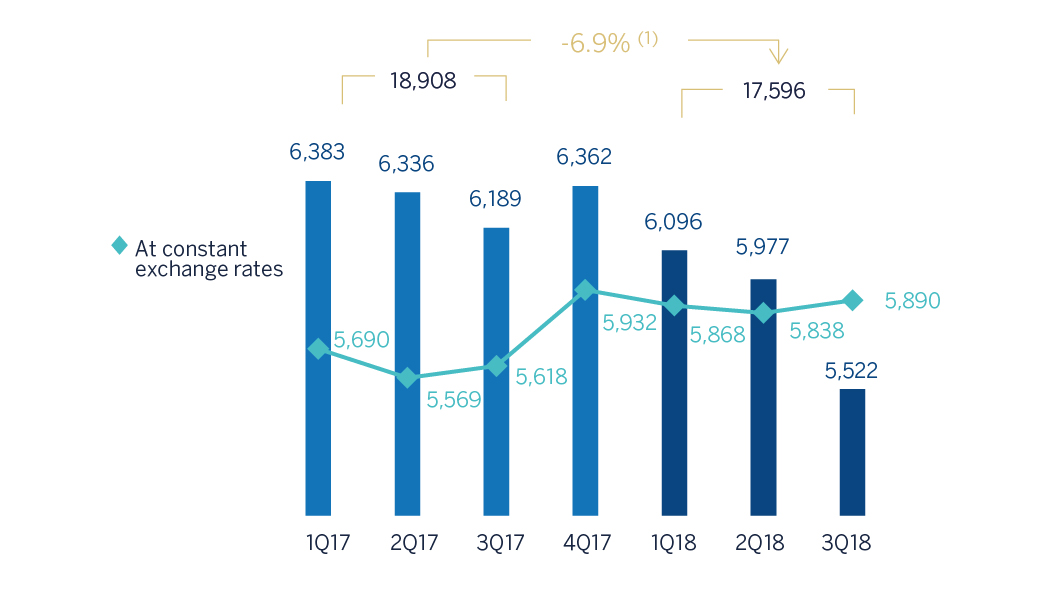
(1) At constant exchange rates: 4.3%.
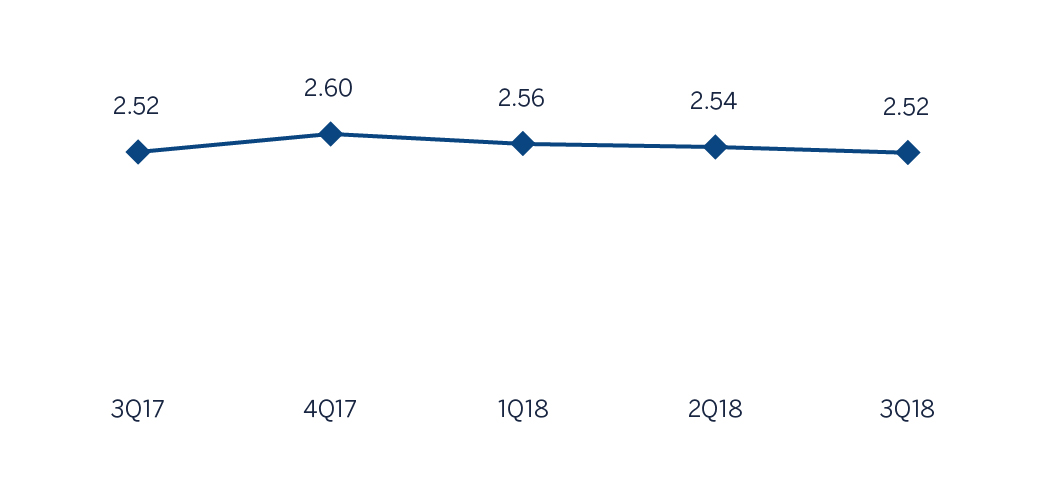
Net interest income grew by 10.2% year-on-year with a general increase in all business areas, mainly in the United States, Mexico, Turkey and South America. In the third quarter, net interest income grew by 6.0% in comparison with the previous quarter.
Net interest income/ATAs (Percentage)
On the other hand, cumulative net fees and commissions (up 9.4% year-on-year) also registered a favorable evolution in all business areas of the Group, highly driven by their diversification. The quarterly figure moderated slightly (down 1.1% in the third quarter).
As a result, the more recurring revenues items (net interest income plus net fees and commissions) increased by 10.1% year-on-year (up 4.4% over the third quarter).
Net interest income plus fees and commissions (Millions of Euros)
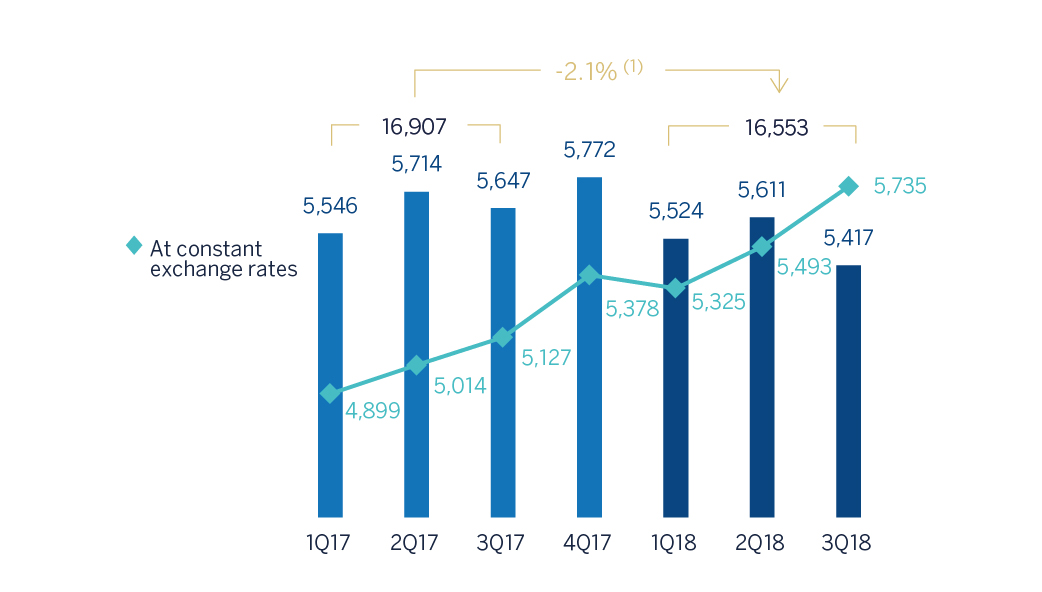
(1) At constant exchange rates: 10.1%.
NTI between January and September of 2018 moderated in comparison with the same period of 2017, when it was exceptionally high, largely due to the registration of the capital gains of €228m before taxes, from market sales of the stake in China Citic Bank (CNCB): €-204 million in the first quarter, from the sale of 1.7% stake, and 24 million in the third quarter from the sale of the remaining 0.34%. There have also been lower sales of ALCO portfolios in Spain in the first nine months of 2018 compared to the same period of the previous year. By business areas, NTI had a good performance in Mexico, South America and Turkey.
Other operating income and expenses contributed €30m; 89.3% less in year-on-year terms, mainly due to negative impact of the hyperinflation in Argentina which meant a negative impact of €190m. The change is also explained by the higher contribution to the Single Resolution Fund -SRF- (€124m in Spain, compared to €98m the same period of 2017). The net contribution of the insurance business grew by 2.4% in accumulated terms (-0.7 % in the third quarter).
Operating income
Operating expenses for the first nine months of 2018 registered an increase of 2.7%, year-on-year, affected by the exchange rates (down 7.1.% at current exchange rates). Cost discipline has been maintained in all the Group's areas through various efficiency plans. By business area the biggest reductions were in Spain and the Rest of Eurasia, year-on-year. In the other geographies, the growth of expenses was lower than the growth of gross income (in South America excluding BBVA Chile).
Operating expenses (Millions of Euros)
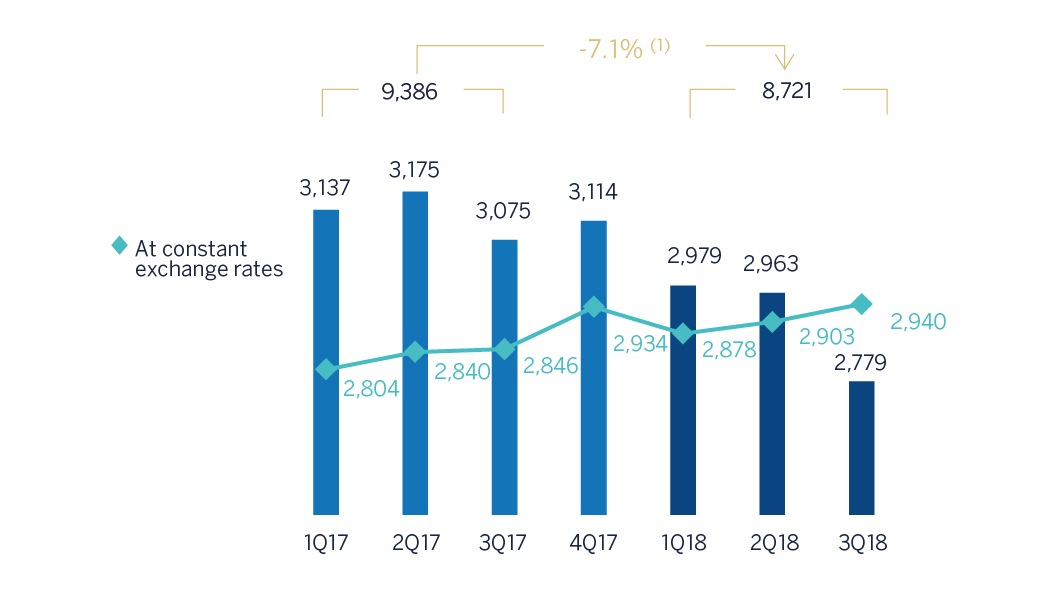
(1) At constant exchange rates: 2.7%.
Breakdown of operating expenses and efficiency calculation (Millions of Euros)
| Jan.-Sep. 18 | ∆% | Jan.-Sep. 17 | |
|---|---|---|---|
| Personnel expenses | 4,563 | (7.5) | 4,931 |
| Wages and salaries | 3,582 | (7.0) | 3,851 |
| Employee welfare expenses | 664 | (6.5) | 710 |
| Training expenses and other | 317 | (14.2) | 370 |
| Other administrative expenses | 3,255 | (4.2) | 3,398 |
| Property, fixtures and materials | 727 | (7.6) | 787 |
| IT | 855 | 11.5 | 767 |
| Communications | 179 | (14.7) | 210 |
| Advertising and publicity | 249 | (10.2) | 278 |
| Corporate expenses | 73 | (4.1) | 76 |
| Other expenses | 864 | (7.5) | 935 |
| Levies and taxes | 306 | (11.5) | 346 |
| Administration costs | 7,818 | (6.1) | 8,329 |
| Depreciation | 903 | (14.5) | 1,057 |
| Operating expenses | 8,721 | (7.1) | 9,386 |
| Gross income | 17,596 | (6.9) | 18,908 |
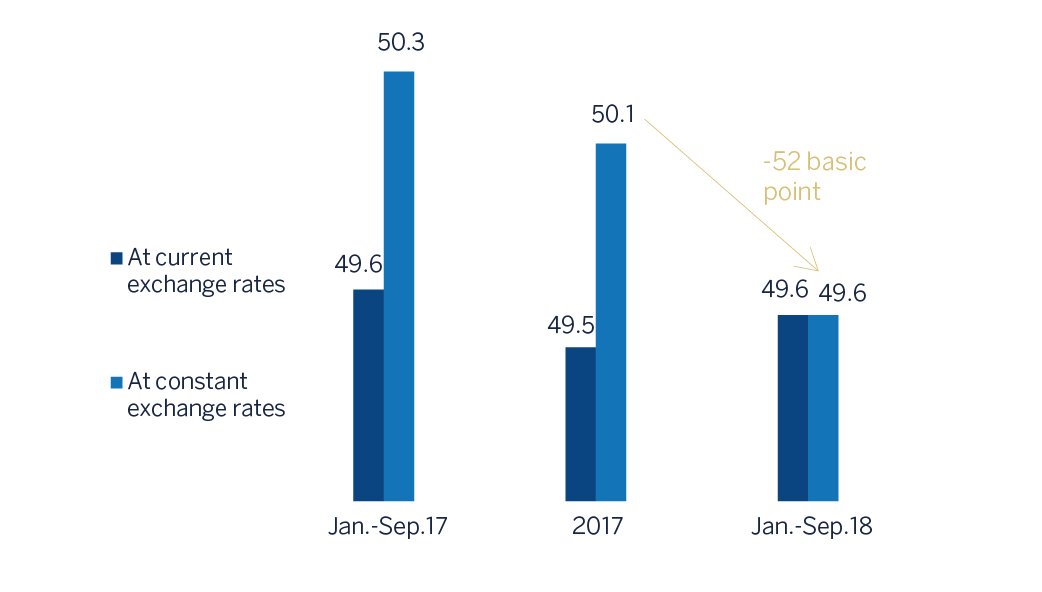
| Efficiency ratio (operating expenses/gross income; %) | 49.6 | 49.6 |
Number of employees
Number of branches
Number of ATMs
As a consequence of this evolution of expenses, the efficiency ratio improved to 49.6%, the same as the period the previous year while the operating income, year-on-year growth of 5.8% (+0.5% in the third quarter).
Efficiency ratio (Percentage)
Operating Income (Millions of Euros)
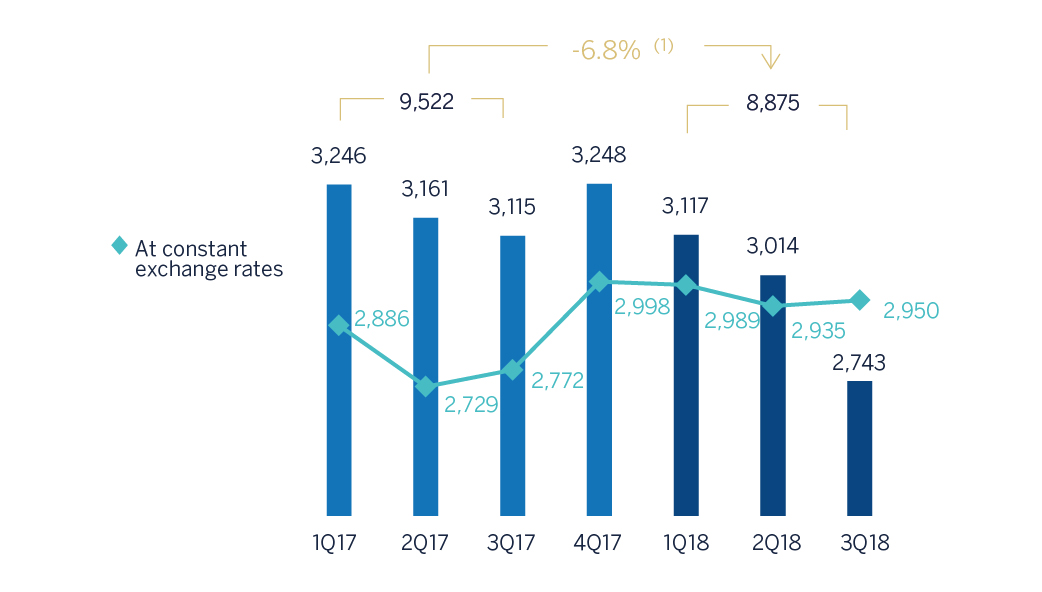
(1) At constant exchange rates: 5.8%.
Provisions and other
Impairment on financial assets for the period January-September 2018 decreased 1.2% in comparison with the figure for the same period in 2017. By business area, they continued to fall in Spain, due to lower loan-loss provisioning requirements for large customers. They also fell in the United States, due to the lower provisioning requirements in the portfolios affected by the 2017 hurricanes. They also decreased in Mexico and, to a lesser extent, in South America. In contrast, they increased in Turkey and the Rest of Eurasia concentrated in wholesale customer portfolios.
Impairment on financial assests (net) (Millions of Euros)
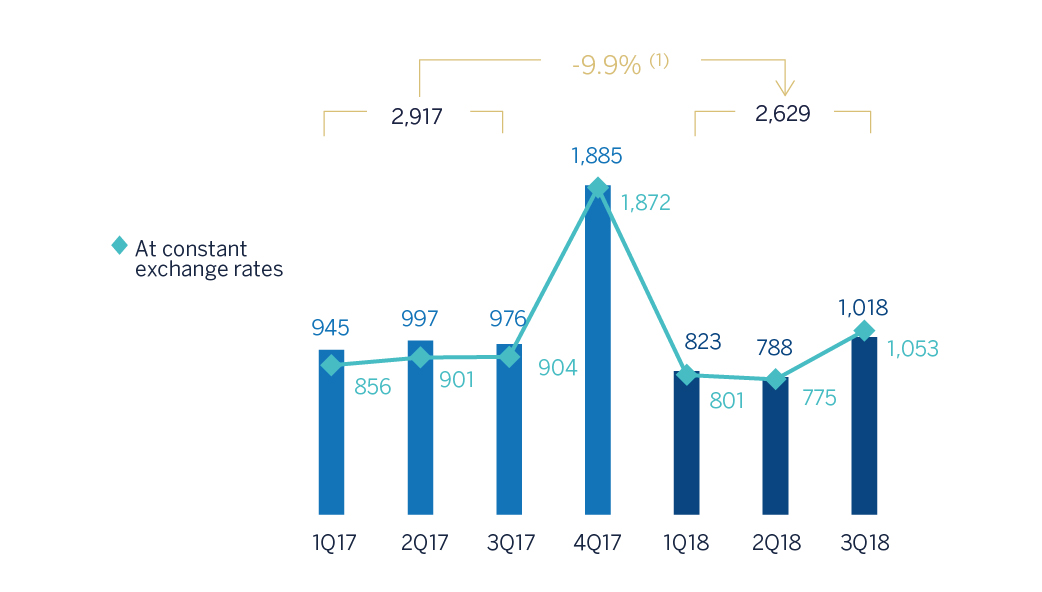
(1) At constant exchange rates: -1.2%.
The heading provisions or reversal of provisions (hereinafter, provisions) were 43.1% lower than the figure for the same period of 2017 (which included a charge of €177m for restructuring costs). The line other gains (losses) showed a positive balance compared to the negative one the previous year. This is due to the incorporated capital gains from the sale of certain portfolios in Mexico and Non Core Real Estate, while the previous year resulted in a negative balance due to certain operations with an unfavorable effect from the Non Core Real Estate area.
The heading of corporate operations amounted to €633m and registered the capital gains (net of taxes) originated by the sale of approximately 68.2% of the BBVA’S equity stake in BBVA Chile.
Results
As a result of the above, the Group's net attributable profit for the first nine months of 2018 reached an amount of €4,323m and continued to show a very positive evolution (up 43.0% year-on-year at constant exchange rates, up 25.3% at current exchange rates).
Net attributable profit, excluding results from corporate operations, stood at 3,689 million euros, or 7.0% higher than the amount recorded for the same period in 2017 (up 22.0% year-on-year at constant exchange rates).
By business area, Banking activity in Spain generated a profit of €1,167m, Non Core Real Estate a loss of only €60m, the United States contributed a profit of €541m, Mexico registered €1,851m, Turkey contributed a profit of €488m, South America €467m and the Rest of Eurasia €57m.
Net attributable profit (Millions of Euros)
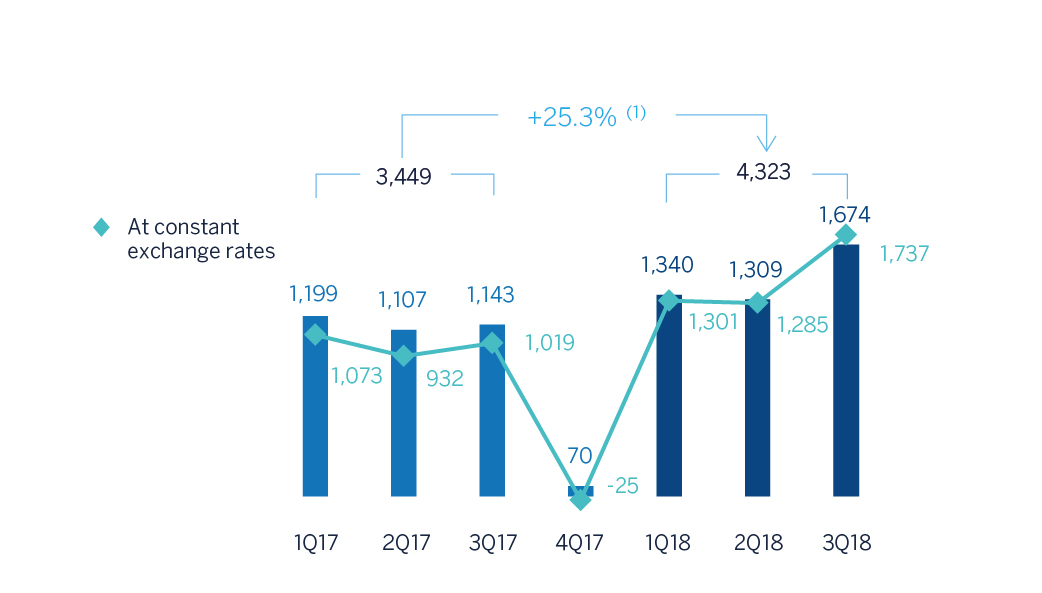
(1) At constant exchange rates: 43.0%.
Earning per share (1) (Euros)
(1) Adjusted by additional Tier 1 instrument remuneration.
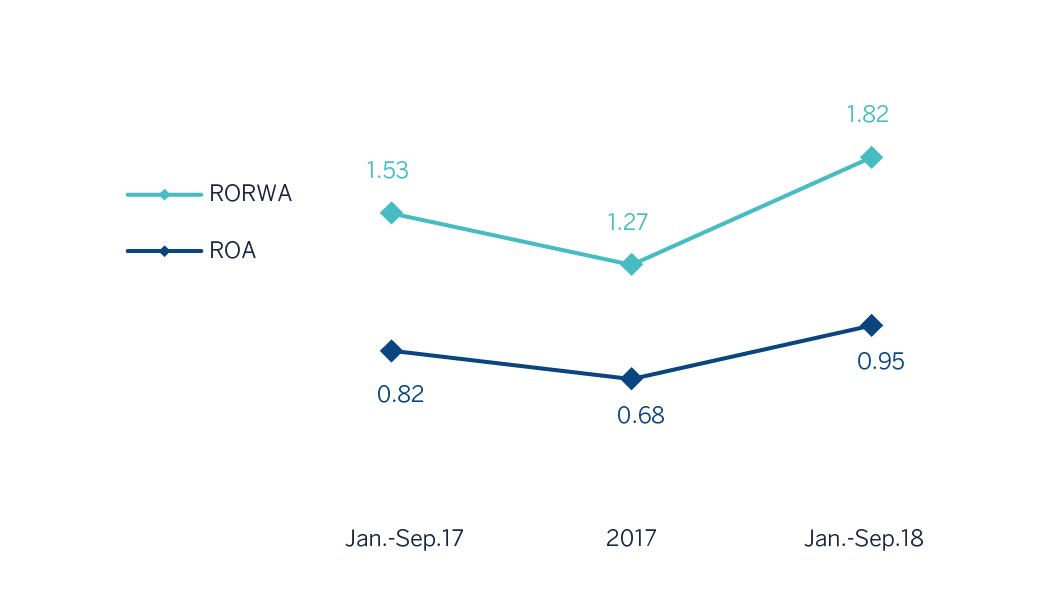
ROE and ROTE (1) (Percentage)
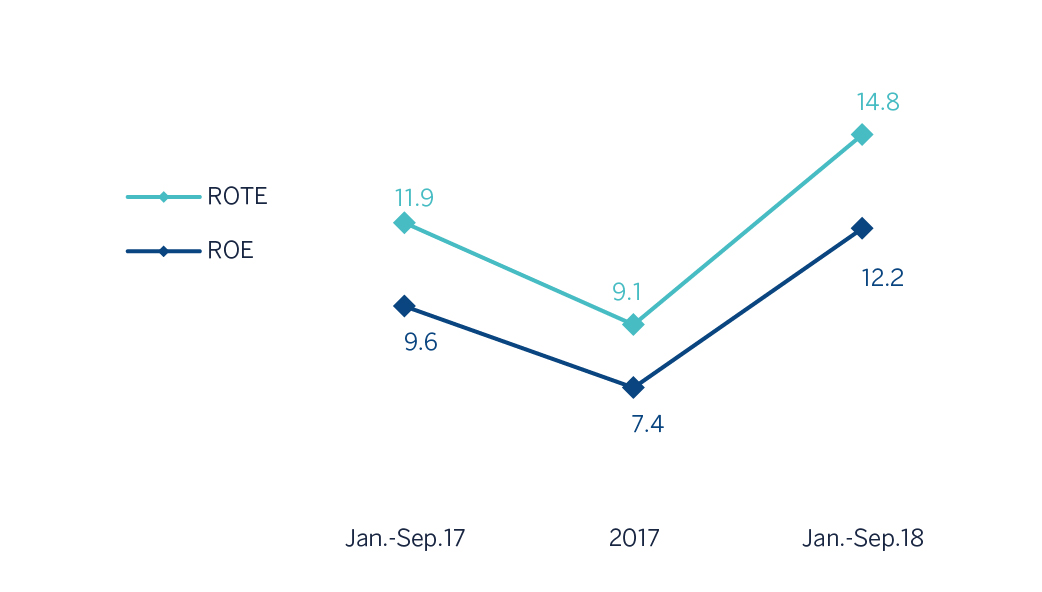
(1) The ROE and ROTE ratios include, in the denominator, the Group’s average shareholders’ funds and take into account the item called “Accumulated other comprehensive income”, which forms part of the equity. Excluding this item, the ROE would stand at 8.5% in January-September 2017, 6.4% in 2017 and 10.0% in January-September 2018; and the ROTE on 10.2%, 7.7% and 11.8%, respectively.
ROA and RORWA (Percentage)