
Other information: Corporate & Investment Banking
Highlights
- Positive performance in lending activity.
- Leadership position in green and sustainable loans.
- Good performance of net interest income.
- Net Attributable profit impacted by lower net trading income and higher impairment on financial assets.
Business activity (1)
(Year-on-year change at constant exchange rates. Data as of 31-03-2019)

(1) Excluding repos.
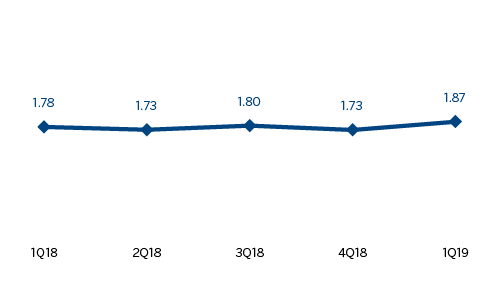
Gross income/ATAs
(Percentage. Constant exchange rates)
Operating income
(Million euros at constant exchange rates)

(1) At current exchange rate: -6.2%.
Net attributable profit
(Million euros at constant exchange rates)
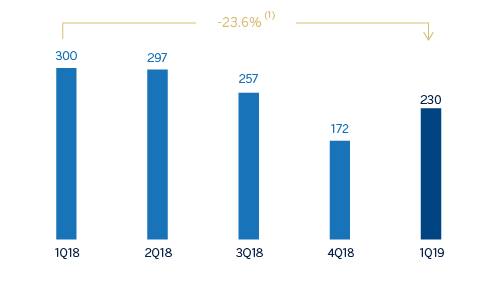
(1) At current exchange rate: -24.5%.
Financial statements and relevant business indicators (Million euros and percentage)
| Income statement | 1Q19 | ∆% | ∆% (1) | 1Q18 |
|---|---|---|---|---|
| Net interest income | 367 | 11.2 | 16.3 | 330 |
| Net fees and commissions | 170 | (6.0) | (3.1) | 180 |
| Net trading income | 215 | (21.1) | (18.6) | 273 |
| Other operating income and expenses | (15) | 25.8 | 33.1 | (12) |
| Gross income | 737 | (4.4) | (0.9) | 771 |
| Operating expenses | (262) | (1.1) | 0.3 | (265) |
| Personnel expenses | (120) | (0.5) | (0.1) | (121) |
| Other administrative expenses | (110) | (6.1) | (3.4) | (117) |
| Depreciation | (32) | 18.5 | 17.8 | (27) |
| Operating income | 475 | (6.2) | (1.6) | 506 |
| Impairment on financial assets not measured at fair value through profit or loss | (54) | n.s. | n.s. | 11 |
| Provisions or reversal of provisions and other results | 4 | n.s. | n.s. | (26) |
| Profit/(loss) before tax | 425 | (13.7) | (11.0) | 492 |
| Income tax | (106) | (19.4) | (17.0) | (131) |
| Profit/(loss) for the year | 319 | (11.6) | (8.9) | 361 |
| Non-controlling interests | (89) | 56.5 | 80.5 | (57) |
| Net attributable profit | 230 | (24.4) | (23.6) | 304 |
- (1) Figures at constant exchange rates.
| Balance sheets | 31-03-19 | ∆% | ∆% (1) | 31-12-18 |
|---|---|---|---|---|
| Cash, cash balances at central banks and other demand deposits | 6,078 | 19.5 | 18.0 | 5,087 |
| Financial assets designated at fair value | 94,377 | 2.1 | 1.6 | 92,391 |
| of which Loans and advances | 29,781 | 3.3 | 3.3 | 28,826 |
| Financial assets at amortized cost | 68,392 | 4.9 | 4.6 | 65,167 |
| of which loans and advances to customers | 61,014 | 3.9 | 3.6 | 58,720 |
| Inter-area positions | - | - | - | - |
| Tangible assets | 82 | 184.4 | 181.8 | 29 |
| Other assets | 1,776 | (18.5) | (20.7) | 2,179 |
| Total assets/liabilities and equity | 170,704 | 3.5 | 3.0 | 164,852 |
| Financial liabilities held for trading and designated at fair value through profit or loss | 81,685 | 11.6 | 11.5 | 73,163 |
| Deposits from central banks and credit institutions | 15,404 | (20.9) | (21.7) | 19,464 |
| Deposits from customers | 35,837 | (16.8) | (17.5) | 43,069 |
| Debt certificates | 2,024 | 4.8 | 3.9 | 1,931 |
| Inter-area positions | 30,192 | 52.9 | 52.6 | 19,742 |
| Other liabilities | 1,401 | (67.8) | (68.2) | 4,348 |
| Economic capital allocated | 4,162 | 32.7 | 31.4 | 3,136 |
- (1) Figures at constant exchange rates.
| Relevant business indicators | 31-03-19 | ∆% | ∆% (1) | 31-12-18 |
|---|---|---|---|---|
| Performing loans and advances to customers under management (2) | 60,457 | 2.8 | 2.5 | 58,796 |
| Non-performing loans | 1,140 | 49.6 | 50.9 | 762 |
| Customer deposits under management (2) | 35,837 | (9.6) | (10.1) | 39,642 |
| Off-balance sheet funds (3) | 1,393 | 40.4 | 39.2 | 993 |
| Efficiency ratio (%) | 35.6 | 34.5 |
- (1) Figures at constant exchange rates.
- (2) Excluding repos.
- (3) Includes mutual funds, pension funds and other off-balance sheet funds.
Activity
Unless expressly stated otherwise, all the comments below on rates of change, for both activity and results, will be given at constant exchange rate,. These rates, together with changes at current exchange rates, can be found in the attached tables of financial statements and relevant business indicators.
The most relevant aspect related to the area’s activity in the first quarter of 2019 were:
- The market context remains unchanged, with margins squeezed and excess liquidity. Lending (performing loans under management grew by 12.2% year-on-year (up 2.5 in the quarter).
- Customer funds decreased by 4.2% during the same period of the previous year (down 8.9% in the quarter), highly concentrated in the decline in time deposits.
- Mergers & Acquisitions (M&A) activity slowed down in the market. Despite this, several sales mandates were signed in the transport infrastructure and primary/agricultural sectors.
- In the equity capital markets (ECM) business, BBVA was proactive in the quarter, thanks to which the bank obtained mandates that will be completed throughout the year.
- In the first quarter, debt capital markets (DCM) activity showed a positive performance in Europe with institutional customers.
- Regarding green and sustainable loans, BBVA has maintained its leadership position in both Spain and Europe.
- In Spain, BBVA participated in all sustainable syndicated operations closed in the first three months of the year as a Sustainable Agent (leader or co-leader). Highlights include the new format of the first loan linked to an ESG rating, the incorporation of a social indicator and the inclusion of new sectors such as hotels and automobile component in the financing of sustainable operations. Thus, BBVA remains the most active institution in the Spanish sustainable finance market.
- In Europe, BBVA has consolidated its position as one of the leading banks in this market
Results
CIB registered a net attributable profit of €230m in the first quarter of 2019, an increase of 33.1% compared to the fourth quarter of the previous year, and 23.6% less compared to the same period of 2018. The most relevant aspects of the year-on-year changes in the income statement in this aggregate are summarized below:
- Net interest income increase of 16.3% year-on-year, derived from the positive evolution of the whole unit, especially evident in Global Markets in Spain and in Mexico.
- Decline in net fees and commissions, resulting from an ambivalent situation in the different countries (down 3.1% year-on-year and up 7.4% in the quarter) and the decrease of one-off operations.
- Reduction in NTI by 18.6% year-on-year, mainly due to lower operations of Global Markets in Spain, which was offset by the better performance of this unit in Turkey and South America, the NTI, represents 22.2% more than in the last quarter.
- As a result, the gross income remained stable in the quarter (down 0.9% year-on-year and up 0.3 in the quarter).
- Operating expenses were slightly higher than the first quarter and fourth quarters of 2018 (up 0.3% and up 2.2%), respectively affected by inflation in emerging countries.
- Year-on-year increase in impairment on financial assets, mainly as a result of higher loan-loss provision, especially in Rest of Eurasia and the United States.