
Spain
Highlights
- Positive trend of activity, especially in high profitable segments.
- Net Interest income affected by lower ALCO contribution and the impact of IFRS 16.
- Significant reduction in operating expenses.
- Continues improvement in Credit risk indicators.
Business activity (1)
(Year-on-year change. Data as of 31-03-19)

(1) Excluding repos.
Net interest income/ATAs
(Percentage)

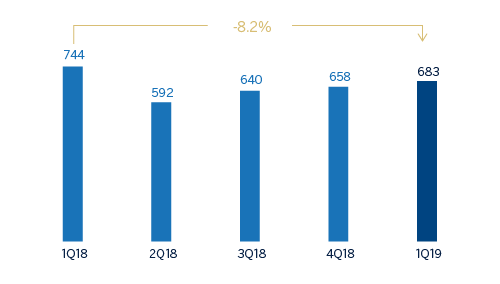
Operating income (Millions of Euros)
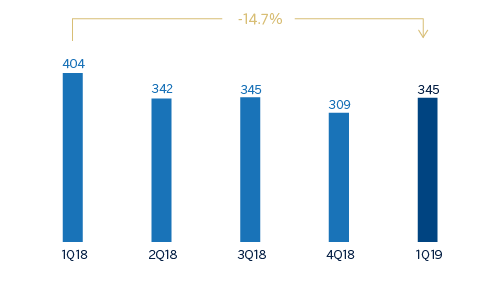
Net attributable profit (Millions of Euros)
Financial statements and relevant business indicators (Millions of euros and percentage)
| Income statement | 1Q19 | ∆% | 1Q18 |
|---|---|---|---|
| Net interest income | 822 | (4.9) | 927 |
| Net fees and commissions | 414 | 0.3 | 412 |
| Net trading income | 108 | (35.2) | 167 |
| Other operating income and expenses | 94 | 14.0 | 82 |
| of which insurance activities (1) | 130 | 13.5 | 114 |
| Gross income | 1,497 | (5.7) | 1,588 |
| Operating expenses | (814) | (3.5) | (844) |
| Personnel expenses | (472) | (1.6) | (480) |
| Other administrative expenses | (223) | (22.5) | (287) |
| Depreciation | (119) | 55.7 | (77) |
| Operating income | 683 | (8.2) | 744 |
| Impairment on financial assets not measured at fair value through profit or loss | (78) | (37.9) | (125) |
| Provisions or reversal of provisions and other results | (123) | 194.7 | (42) |
| Profit/(loss) before tax | 482 | (16.5) | 577 |
| Income tax | (137) | (20.7) | (172) |
| Profit/(loss) for the year | 345 | (14.7) | 405 |
| Non-controlling interests | (1) | (7.4) | (1) |
| Net attributable profit | 345 | (14.7) | 404 |
- (1) Includes premiums received net of estimated technical insurance reserves.
| Balance sheets | 31-03-19 | ∆% | 31-12-18 |
|---|---|---|---|
| Cash, cash balances at central banks and other demand deposits | 18,875 | (33.9) | 28,545 |
| Financial assets designated at fair value | 113,735 | 6.0 | 107,320 |
| of which loans and advances | 30,715 | 1.6 | 30,222 |
| Financial assets at amortized cost | 199,111 | 1.9 | 195,467 |
| of which loans and advances to customers | 170,893 | 0.3 | 170,438 |
| Inter-area positions | 13,173 | (6.1) | 14,026 |
| Tangible assets | 3,530 | 172.9 | 1,294 |
| Other assets | 8,129 | (1.5) | 8,249 |
| Total assets/liabilities and equity | 356,552 | 0.5 | 354,901 |
| Financial liabilities held for trading and designated at fair value through profit or loss | 70,283 | (1.1) | 71,033 |
| Deposits from central banks and credit institutions | 46,697 | 1.7 | 45,914 |
| Deposits from customers | 181,723 | (0.9) | 183,414 |
| Debt certificates | 31,490 | 0.4 | 31,352 |
| Inter-area positions | - | - | - |
| Other liabilities | 17,756 | 22.3 | 14,519 |
| Economic capital allocated | 8,602 | (0.8) | 8,670 |
| Relevant business indicators | 31-03-19 | ∆% | 31-12-18 |
|---|---|---|---|
| Performing loans and advances to customers under management (1) | 166,802 | 0.2 | 166,396 |
| Non-performing loans | 9,794 | (2.8) | 10,073 |
| Customer deposits under management (1) | 181,283 | (0.9) | 182,984 |
| Off-balance sheet funds (2) | 64,225 | 2.7 | 62,559 |
| Risk-weighted assets | 107,935 | 3.7 | 104,125 |
| Efficiency ratio (%) | 54.4 | 55.9 | |
| NPL ratio (%) | 4.9 | 5.1 | |
| NPL coverage ratio (%) | 58 | 57 | |
| Cost of risk (%) | 0.18 | 0.21 |
- (1) Excluding repos.
- (2) Includes mutual funds, pension funds and other off-balance-sheet funds.
Activity
The most relevant aspects related to the area’s activity during the first quarter of 2019 were:
- As of March 31, 2019 Lending (performing loans under management) stood at a similar level than the one registered on December 31, 2018 (up 0.2%). We highlight the positive evolution of consumer loans and credit cards (up 3.4%) as well as lending to medium-sized enterprises (up 2.1%) that offset the reduction in mortgage loans (down 0.5%). In year-on-year terms, lending activity grew by 1.8%.
- In terms of asset quality, non-performing loans showed a downward trend over the quarter, with a positive effect on the NPL ratio which stood at 4.9% as of March 31, 2019 (5.1% as of December 31,2018), mainly explained by a lower level of NPLs in the mortgage portfolios. The NPL coverage ratio stood at 58%, above the closing of 2018.
- Regarding customer deposits under management, it is important to highlight the good performance of demand deposits, which increased by 2.5% in the quarter (up 13.3% year-on-year), representing more than 80% of total deposits by March 2019. On the other hand, time deposits continued their downward trend (down 13.2% in the quarter, down 19.1% year-on-year). Overall, total deposits remained flat during the quarter while increasing by 5.2% in the last twelve months.
- Off-balance sheet funds showed a mild recovery (up 2.7% since December 31, 2018 and up 1.9% year-on-year), particularly evident in investment funds as a result of a good market performance during the quarter.
Results
In the first quarter of 2019, the net attributable profit of BBVA in Spain stood at €345m, a 14.7% decline compared to the same quarter of 2018 but an increase of 11.7% compared to the previous quarter. The main highlights of the area’s income statement are:
- Net interest income decreased by 4.9% year-on-year, strongly influenced by a lower contribution from the ALCO portfolio and the effect of the implementation of IFRS 16.
- Net fees and commissions remained stable year-on-year (up 0.3%).
- Lower NTI contribution (down 35.2% compared to the same quarter of 2018) due to uneven market performance in the quarter and lower portfolio sales.
- Growth in other operating income and expenses (up 14.0% year-on-year) was mainly due to the good performance of net earnings from the insurance business which showed an increase of 13.5%.
- Operating expenses decreased by 3.5% in the last twelve months, remaining flat over the last three months. Thus, the efficiency ratio stood at 54.4%, improving compared to the end of 2018.
- Operating expenses s decreased by 3.5% in the last twelve months, remaining flat over the last three months. Thus, the efficiency ratio stood at 54.4%, improving compared to the end of 2018.
- Decline in impairment losses on financial assets (down 37.9% year-on-year) as a result of lower loan-loss provisions of real-estate developer loans previously allocated to the former Non Core Real Estate area. As a result, the cumulative cost of risk stood at 0.18% as of March 31, 2019.
- Finally, provisions (net) and other gains (losses) showed a year-on-year increase due mainly to the positive valuation of assets in the former Non Core Real Estate area during the first quarter of last year.