
South America
Highlights
- Activity continues to grow at a good pace.
- Good performance of net interest income.
- Net attributable profit impacted by Argentina's hyperinflation adjustment.
- Positive trend in net attributable profit of the main countries in the region: Argentina, Colombia and Peru.
Business activity (1)
(Year-on-year change at constant exchange rates (2). Data as of 31-03-19)
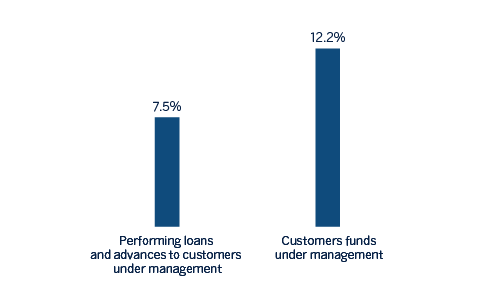
(1) Excluding repos.
(2) Excluding BBVA Chile of March 31, 2018.
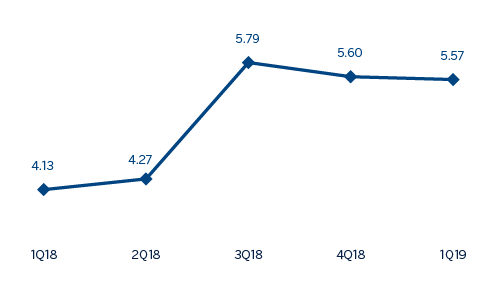
Net interest income/ATAs
(Percentage. Constant exchange rates)
Operating income
(Million euros at constant exchange rates)

(1)At current exchange rates: +15.9%.
Net attributable profit
(Million euros at constant exchange rates)
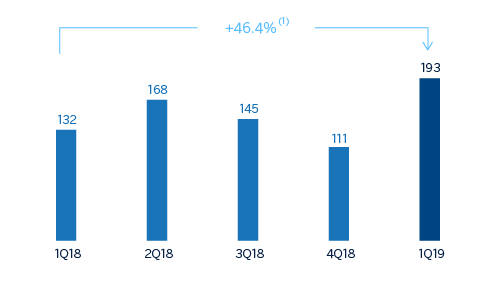
(1) At current exchange rates: +23.0%.
Financial statements and relevant business indicators (Millions of euros and percentage)
| Income statement | 1Q19 | ∆% | ∆% (1) | 1Q18 |
|---|---|---|---|---|
| Net interest income | 760 | (3.9) | 7.7 | 791 |
| Net fees and commissions | 135 | (17.4) | (5.9) | 163 |
| Net trading income | 206 | 84.9 | 121.1 | 112 |
| Other operating income and expenses | (116) | 100.0 | 77.0 | (58) |
| Gross income | 985 | (2.3) | 12.4 | 1,008 |
| Operating expenses | (379) | (21.9) | (8.2) | (485) |
| Personnel expenses | (195) | (20.9) | (6.0) | (246) |
| Other administrative expenses | (142) | (32.6) | (21.5) | (211) |
| Depreciation | (41) | 53.6 | 74.9 | (27) |
| Operating income | 606 | 15.9 | 30.6 | 523 |
| Impaiment on financial assets not measured at fair value through profit or loss | (177) | 6.1 | 10.2 | (167) |
| Provisions or reversal of provisions and other results | (12) | 14.6 | 80.5 | (11) |
| Profit/(loss) before tax | 417 | 20.7 | 40.5 | 345 |
| Income tax | (138) | 3.7 | 16.2 | (133) |
| Profit/(loss) for the year | 279 | 31.4 | 56.6 | 213 |
| Non-controlling interests | (86) | 55.1 | 85.8 | (56) |
| Net attributable profit | 193 | 23.0 | 46.4 | 157 |
| Balance sheets | 31-03-19 | ∆% | ∆% (1) | 31-12-18 |
|---|---|---|---|---|
| Cash, cash balances at central banks and other demand deposits | 8,830 | (1.7) | (0.4) | 8,987 |
| Financial assets designated at fair value | 6,861 | 21.8 | 20.3 | 5,634 |
| of which loans and advances | 125 | (2.9) | (7.0) | 129 |
| Financial assets at amortized cost | 37,986 | 3.6 | 2.4 | 36,649 |
| of which loans and advances to customers | 35,691 | 3.5 | 2.2 | 34,469 |
| Tangible assets | 972 | 19.6 | 20.2 | 813 |
| Other assets | 2,382 | 4.0 | 2.1 | 2,290 |
| Total assets/liabilities and equity | 57,031 | 4.9 | 4.1 | 54,373 |
| Financial liabilities held for trading and designated at fair value through profit or loss | 2,325 | 71.3 | 64.9 | 1,357 |
| Deposits from central banks and credit institutions | 3,154 | 2.5 | (0.1) | 3,076 |
| Deposits from customers | 37,236 | 3.9 | 3.5 | 35,842 |
| Debt certificates | 3,388 | 5.7 | 2.1 | 3,206 |
| Other liabilities | 8,501 | (0.4) | (0.9) | 8,539 |
| Economic capital allocated | 2,429 | 3.1 | 2.6 | 2,355 |
| Relevant business indicators | 31-03-19 | ∆% | ∆% (1) | 31-12-18 |
|---|---|---|---|---|
| Performing loans and advances to customers under management (2) | 35,434 | 2.7 | 1.3 | 34,518 |
| Non-performing loans | 1,827 | 4.6 | 1.9 | 1,747 |
| Customer deposits under management (3) | 37,341 | 3.8 | 3.4 | 35,984 |
| Off-balance sheet funds (4) | 12,481 | 7.0 | 5.4 | 11,662 |
| Risk-weighted assets | 44,964 | 5.2 | 4.9 | 42,724 |
| Efficiency ratio (%) | 38.4 | 46.2 | ||
| NPL ratio (%) | 4.4 | 4.3 | ||
| NPL coverage ratio (%) | 96 | 97 | ||
| Cost of risk (%) | 1.94 | 1.44 |
- (1) Figures at constant exchange rates.
- (2) Excluding repos.
- (3) Excluding repos and including specific marketable debt securities.
- (4) Includes mutual funds, pension funds and other off-balance sheet funds.
South America. Data per country (Millions of euros)
| Operating income | Net attributable profit | |||||||
|---|---|---|---|---|---|---|---|---|
| Country | 1Q19 | ∆% | ∆% (1) | 1Q18 | 1Q19 | ∆% | ∆% (1) | 1Q18 |
| Argentina | 174 | 181.3 | n.s. | 62 | 60 | n.s. | n.s. | 1 |
| Chile | 35 | (67.2) | (66.4) | 108 | 17 | (63.4) | (62.5) | 46 |
| Colombia | 169 | 6.2 | 7.8 | 159 | 58 | (6.4) | (5.0) | 62 |
| Peru | 194 | 19.2 | 13.0 | 162 | 43 | 21.3 | 15.1 | 35 |
| Other countries (2) | 35 | 8.7 | 11.5 | 32 | 16 | 25.9 | 31.1 | 13 |
| Total | 606 | 15.9 | 30.6 | 523 | 193 | 23.0 | 46.4 | 157 |
- (1) Figures at constant exchange rates.
- (2) Venezuela, Paraguay, Uruguay and Bolivia. Additionally, it includes eliminations and other charges.
South America. Relevant business indicators per country (Millions of euros)
| Argentina | Chile | Colombia | Peru | |||||
|---|---|---|---|---|---|---|---|---|
| 31-03-19 | 31-12-18 | 31-03-19 | 31-12-18 | 31-03-19 | 31-12-18 | 31-03-19 | 31-12-18 | |
| Performing loans and advances to customers under management (1)(2) | 3,891 | 3,731 | 2,117 | 2,127 | 12,199 | 12,365 | 14,290 | 13,833 |
| Non-performing loans and guarantees given (1) | 90 | 77 | 68 | 60 | 776 | 803 | 748 | 735 |
| Customer deposits under management (1)(3) | 5,683 | 5,291 | 11 | 11 | 12,799 | 13,104 | 14,356 | 13,306 |
| Off-balance sheet funds (1)(4) | 1,033 | 692 | - | - | 1,449 | 1,344 | 1,714 | 1,726 |
| Risk-weighted assets | 7,963 | 8,036 | 2,361 | 2,243 | 13,671 | 12,680 | 17,129 | 15,739 |
| Efficiency ratio (%) | 37.6 | 73.7 | 32.0 | 42.1 | 35.6 | 37.1 | 36.7 | 36.0 |
| NPL ratio (%) | 2.2 | 2.0 | 3.1 | 2.8 | 5.8 | 6.0 | 4.0 | 4.0 |
| NPL coverage ratio (%) | 110 | 111 | 89 | 93 | 98 | 100 | 95 | 93 |
| Cost of risk (%) | 2.13 | 1.60 | 2.34 | 0.81 | 2.30 | 2.16 | 1.60 | 0.98 |
- (1) Figures at constant exchange rates.
- (2) Excluding repos.
- (3) Excluding repos and including specific marketable debt securities.
- (4) Includes mutual funds, pension funds and other off-balance-sheet funds.
Activity and results
Unless expressly stated otherwise, all the comments below on rates of change, for both activity and results, will be given at constant exchange rates. These rates, together with changes at current exchange rates, can be found in the attached tables of financial statements and relevant business indicators.
The most relevant aspects related to the area’s activity in the first quarter of 2019 were:
- Lending (performing loans under management) increased by 1.3% compared to the closing of the previous year. By segments, the performance was especially positive in credit cards and enterprises.
- In asset quality, the NPL ratio stood at 4.4% at March 31, 2019 in line with the previous quarter, as well as the coverage ratio which stood at 96% (97% at December 31, 2018).
- Customer deposits increased 3.4% while off-balance sheet funds grew 5.4% during the quarter.
Regarding results, South America generated a cumulative net attributable profit of €193m in the first quarter of 2019, representing a year-on-year growth of 46.4% (23.0% at current exchange rates). This performance was negatively affected by the negative effect of the hyperinflation in Argentina on the region’s net attributable profit (down €49m). The highlights of the income statement in the quarter were:
- The more recurring revenue items rose 5.4% (down 6.2% in current), especially due to the growth of net interest income (up 7.7% year-on-year, down 3.9% in current).
- Good performance of financial transactions, obtaining some NTI which increased at a rate of 121.1% year-on-year (up 84.9% in current).
- Higher requirements for impairment on financial assets (up 10.2% year-on-year, up 6.1% current). As a result, the cumulative cost of risk as of March 2019 stood at 1.94%.
Excluding BBVA Chile from the 2018 comparison (the sale was completed in July 2018), the net attributable profit increased 50.9% in the first quarter of 2019, at current exchange rates, compared to the same figure in the previous year.
The most significant countries in the business area, Argentina, Colombia and Peru, showed the following activity and results evolution during the first quarter of 2019:
Argentina
- Growth of 4.3% in the quarter in lending activity mainly explained by the performance of consumer, credit cards and mortgages retail portfolios. As for asset quality, there was a slight increase in the NPL ratio to close at t 2.2% as of March 31, 2019.
- Customer deposits increased 7.4%, while off-balance sheet funds increased by 49.2%, both compared to 2018 year end figures.
- The net attributable profit stood at €60m, based both on the positive performance of the more recurring revenue items (driven by a greater contribution of the securities portfolio and an improvement in the customer spread) as well as in the positive impact arising from the stake sale in Prisma Medios de Pago S.A (€50m net of taxes).
Colombia
- Lending activity decreased by 1.3% in the quarter (up 2.1% year-on-year) due to consumer and enterprises while mortgages and credit cards remained flat. In terms of asset quality, the NPL ratio fell to 5.8% in the quarter due to the written-off a wholesale customer. .
- Although customer deposits fell 2.3%during the first quarter of 2019, they increased by 2.7% in year-on-year terms.
- Good year-on-year performance of net interest income, which grew 2.7% (up1.2% at current exchange rate) as a result of higher activity volumes and good management of customer spreads. This evolution of net interest income, together with a positive contribution from the NTI as a result of the profits steaming from the management of securities portfolio, along with a reduction in operating expenses, resulted in an increase of 7.8% in the operating income compared to the previous year. Net attributable profit stood at €58m, a year-on year reduction of 5.0%, derived from higher provisions due to the impact of write-offs mainly from the aforementioned customer.
Peru
- In the quarter, lending activity grew by 3.3%, explained by the good performance of both the retail (consumer, credit cards and mortgages) and wholesale portfolios. Asset quality indicators remained stable with respect the closing of 2018, with a NPL ratio of 4.0% and a coverage ratio of 95%.
- Customer deposits increased 7.9% in the first quarter of 2019 (up 14.5% year-on-year), supported by time deposits (up 20.3%).
- Net attributable profit was €43m, representing a year-on year increase of 15.1% due to the good performance of the more recurring revenue items, i.e. net interest income plus net fees and commissions (up15.0% and up 5.8%, respectively). This evolution offsets the slight increase on operating expenses and on the impairment on financial assets.