
Turkey
Highlights
- Positive trend in lending.
- Good performance of net interest income, as a result of the inflation-linked bonds performance.
- Operating expenses growth below the inflation rate.
- Net attributable profit affected by the impairment on financial assets associated to the macroeconomic environment.
Business activity (1)
(Year-on-year change at constant exchange rate. Data as of 31-03-19)
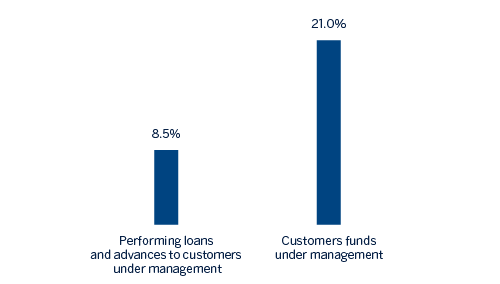
(1) Excluding repos.
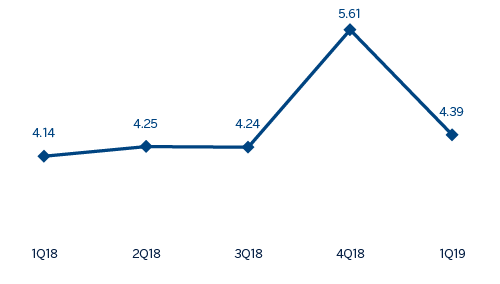
Net interest income/ATAs
(Percentage. Constant exchange rate)
Operating income
(Millions of Euros at constant exchange rate)

(1) At current exchange rate: -10.9%.
Net attributable profit
(Millions of Euros at constant exchange rate)
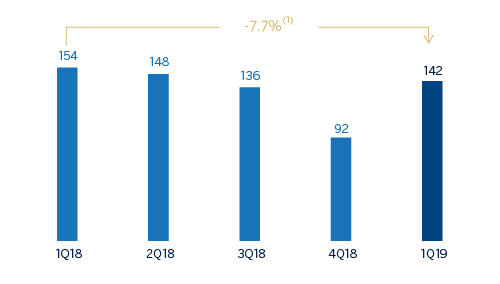
(1) At current exchange rate: -29.2%.
Financial statements and relevant business indicators (Millions of Euros and percentage)
| Income statement | 1Q19 | ∆% | ∆% (1) | 1Q18 |
|---|---|---|---|---|
| Net interest income | 695 | (7.7) | 20.2 | 753 |
| Net fees and commissions | 194 | (3.4) | 25.8 | 201 |
| Net trading income | (11) | n.s. | n.s. | 20 |
| Other operating income and expenses | 6 | (74.5) | (66.8) | 23 |
| Gross income | 884 | (11.3) | 15.5 | 996 |
| Operating expenses | (313) | (12.0) | 14.7 | (355) |
| Personnel expenses | (171) | (3.3) | 26.0 | (177) |
| Other administrative expenses | (97) | (29.4) | (8.1) | (138) |
| Depreciation | (44) | 9.5 | 42.6 | (40) |
| Operating income | 571 | (10.9) | 16.0 | 641 |
| Impaiment on financial assets not measured at fair value through profit or loss | (202) | 33.9 | 74.5 | (151) |
| Provisions or reversal of provisions and other results | (1) | n.s. | n.s. | 29 |
| Profit/(loss) before tax | 368 | (29.1) | (7.7) | 519 |
| Income tax | (79) | (30.0) | (8.8) | (113) |
| Profit/(loss) for the year | 289 | (28.9) | (7.4) | 406 |
| Non-controlling interests | (147) | (28.6) | (7.0) | (206) |
| Net attributable profit | 142 | (29.2) | (7.7) | 200 |
| Balance sheets | 31-03-19 | ∆% | ∆% (1) | 31-12-18 |
|---|---|---|---|---|
| Cash, cash balances at central banks and other demand deposits | 7,171 | (8.7) | (4.4) | 7,853 |
| Financial assets designated at fair value | 5,598 | 1.7 | 6.5 | 5,506 |
| of which loans and advances | 410 | 0.2 | 4.9 | 410 |
| Financial assets at amortized cost | 51,656 | 2.7 | 7.5 | 50,315 |
| of which loans and advances to customers | 42,025 | 1.3 | 6.1 | 41,478 |
| Tangible assets | 1,164 | 9.9 | 15.0 | 1,059 |
| Other assets | 1,541 | 1.6 | 6.4 | 1,517 |
| Total assets/liabilities and equity | 67,130 | 1.3 | 6.1 | 66,250 |
| Financial liabilities held for trading and designated at fair value through profit or loss | 1,792 | (3.2) | 1.3 | 1,852 |
| Deposits from central banks and credit institutions | 6,950 | 3.2 | 8.1 | 6,734 |
| Deposits from customers | 40,544 | 1.6 | 6.4 | 39,905 |
| Debt certificates | 6,335 | 6.2 | 11.2 | 5,964 |
| Other liabilities | 8,786 | (5.2) | (0.7) | 9,267 |
| Economic capital allocated | 2,723 | 7.7 | 12.7 | 2,529 |
| Relevant business indicators | 31-03-19 | ∆% | ∆% (1) | 31-12-18 |
|---|---|---|---|---|
| Performing loans and advances to customers under management (2) | 41,388 | 1.0 | 5.7 | 40,996 |
| Non-performing loans | 3,138 | 9.1 | 14.3 | 2,876 |
| Customer deposits under management (2) | 40,540 | 1.6 | 6.4 | 39,897 |
| Off-balance sheet funds (3) | 3,370 | 16.4 | 21.9 | 2,894 |
| Risk-weighted assets | 58,526 | 3.6 | 8.5 | 56,486 |
| Efficiency ratio (%) | 35.4 | 32.0 | ||
| NPL ratio (%) | 5.7 | 5.3 | ||
| NPL coverage ratio (%) | 78 | 81 | ||
| Cost of risk (%) | 1.82 | 2.44 |
(1) Figures at constant exchange rate.
(2) Excluding repos.
(3) Includes mutual funds, pension funds and other off-balance-sheet funds.
Activity
Unless expressly stated and communicated otherwise, rates of changes explained ahead, both for activity and for income, will be presented at constant exchange rates. These rates, together with changes at current exchange rates, can be observed in the attached tables of the financial statements and relevant business indicators.
The most relevant aspects related to the area’s activity year-to-date as of March 31, 2019 were:
- Lending activity (performing loans under management) grew by 5.7% in the quarter (up 8.5% year- on-year). Turkish-lira loan growth accelerated in this quarter by 7.2%, which grew above the sector after the deceleration observed during the last quarter of 2018. On the other hand, foreign-currency loans (in U.S. dollars) remained stable in this quarter.
- By segments, Garanti significantly outperformed in Turkish Lira Business Banking loans on a quarterly basis, thanks to the newly launched CGF- Credit Guarantee Fund (loans which are provided with Treasury-backed Credit Guarantee) to support SMEs and commercials. On the other hand, there is a decrease in consumer loans and mortgages during the quarter. In addition, credit cards remained stable in the quarter in line with the evolution of this segment as shown by the country’s private banks.
- In terms of asset quality, the NPL ratio stood at 5.7%, with lower provisions than those registered in the previous quarter due to a lower deterioration of the retail and wholesale portfolios. The NPL coverage ratio stood at 78%.
- Customer deposits (60% of total liabilities in the area as of March 31, 2019) remained the main source of funding for the balance sheet and grew by 6.4% in the quarter mainly supported by the growth of foreign currency deposits (in US dollars).
Results
In the first quarter of 2019, Turkey generated a cumulative net attributable profit of €142m representing a decrease of 7.7% year-on-year (up 54.8% in comparison with the previous quarter). The most significant aspects of the year-on-year evolution in the income statement are the following:
- Positive performance of net interest income (up 20.2%) mainly thanks to the significant income from inflation-linked bonds. Even though the customer spreads decreased slightly compared to the same quarter of last year, it is worth mentioning the good recovery compared to the last quarter due to declining cost of funding.
- Income from net fees and commissions grew by 25.8%. This significant increase was mainly driven by the positive performance in payment systems and money transfers.
- Decrease in NTI due to the unfavorable performance of the markets, which was not offset by the asset and liabilities management and derivative gains.
- Gross income grew 15.5% year-on-year, thanks to the increase in core banking activities and the aforementioned higher inflation-linked bonds contribution.
- Operating expenses increased by 14.7%, well below the average inflation rate (18.7%) and below the year-on-year growth rate in gross income. As a result of strict cost-control discipline, the efficiency ratio remained at low levels (35.4%).
- Impairment on financial assets increased year-on-year by 74.5% although it fell by 63.2% with respect to the previous quarter, mainly due to lower macro scenario adjustments and less deterioration of wholesale portfolios. As a result of the above, the cost of risk decreased 62 basis points in the quarter, which stood at 1.82%.