
Results
In the first quarter of 2019, BBVA Group obtained a net attributable profit of €1,164m. This figure represents an increase of 16.2% compared to the one obtained in the last quarter of 2018, although it is 9.8% lower than in the same quarter in the previous year (-8.1% at constant exchange rates). The good performance of recurring revenue items, particularly net interest income, as well as the evolution of operating expenses growing below gross income stand out.
Consolidated income statement: quarterly evolution (Millions of euros)
| 2019 | 2018 | ||||
|---|---|---|---|---|---|
| 1Q | 4Q | 3Q | 2Q | 1Q | |
| Net interest income | 4,420 | 4,692 | 4,309 | 4,302 | 4,287 |
| Net fees and commissions | 1,214 | 1,226 | 1,173 | 1,244 | 1,236 |
| Net trading income | 426 | 316 | 212 | 285 | 410 |
| Other operating income and expenses | 8 | (83) | 38 | 6 | 92 |
| Gross income | 6,069 | 6,151 | 5,733 | 5,838 | 6,026 |
| Operating expenses | (2,922) | (2,981) | (2,825) | (2,921) | (2,975) |
| Personnel expenses | (1,553) | (1,557) | (1,459) | (1,539) | (1,565) |
| Other administrative expenses | (977) | (1,119) | (1,061) | (1,087) | (1,106) |
| Depreciation | (392) | (305) | (304) | (295) | (304) |
| Operating income | 3,147 | 3,170 | 2,908 | 2,916 | 3,050 |
| Impairment on financial assets not measured at fair value through profit or loss | (1,023) | (1,353) | (1,023) | (783) | (823) |
| Provisions or reversal of provisions | (144) | (66) | (123) | (85) | (99) |
| Other gains (losses) | (22) | (183) | (36) | 67 | 41 |
| Profit/(loss) before tax | 1,957 | 1,568 | 1,727 | 2,115 | 2,170 |
| Income tax | (559) | (421) | (419) | (605) | (617) |
| Profit/(loss) after tax from ongoing operations | 1,398 | 1,147 | 1,308 | 1,510 | 1,553 |
| Results from corporate operations (1) | - | - | 633 | - | - |
| Profit/(loss) for the year | 1,398 | 1,147 | 1,941 | 1,510 | 1,553 |
| Non-controlling interests | (234) | (145) | (154) | (265) | (262) |
| Net attributable profit | 1,164 | 1,001 | 1,787 | 1,245 | 1,290 |
| Net attributable profit excluding results from corporate operations | 1,164 | 1,001 | 1,154 | 1,245 | 1,290 |
| Earning per share (euros) (2) | 0.16 | 0.14 | 0.26 | 0.17 | 0.18 |
- General note: the application of accounting for hyperinflation in Argentina was performed for the first time in September 2018 with accounting effects on January 1, 2018, recording the impact of the 9 months in the third quarter. In order to make the 2019 information comparable to 2018, the income statements for the first three quarters of 2018 have been reexpressed to reflect the impacts of inflation on their income and expenses.
- (1) Includes net capital gains from the sale of BBVA Chile.
- (2) Adjusted by additional Tier 1 instrument remuneration.
Consolidated income statement (Millions of euros)
| 1Q19 | ∆% | ∆% at constant exchange rates | 1Q18 | |
|---|---|---|---|---|
| Net interest income | 4,420 | 3.1 | 6.7 | 4,287 |
| Net fees and commissions | 1,214 | (1.8) | 1.3 | 1,236 |
| Net trading income | 426 | 3.9 | 8.4 | 410 |
| Other operating income and expenses | 8 | (91.3) | (90.2) | 92 |
| Gross income | 6,069 | 0.7 | 4.3 | 6,026 |
| Operating expenses | (2,922) | (1.8) | 1.1 | (2,975) |
| Personnel expenses | (1,553) | (0.8) | 2.1 | (1,565) |
| Other administrative expenses | (977) | (11.6) | (8.6) | (1,106) |
| Depreciation | (392) | 28.9 | 31.2 | (304) |
| Operating income | 3,147 | 3.2 | 7.4 | 3,050 |
| Impairment on financial assets not measured at fair value through profit or loss | (1,023) | 24.4 | 27.2 | (823) |
| Provisions or reversal of provisions | (144) | 45.1 | 52.7 | (99) |
| Other gains (losses) | (22) | n.s. | n.s. | 41 |
| Profit/(loss) before tax | 1,957 | (9.8) | (5.3) | 2,170 |
| Income tax | (559) | (9.4) | (5.7) | (617) |
| Profit/(loss) after tax from ongoing operations | 1,398 | (10.0) | (5.1) | 1,553 |
| Results from corporate operations | - | n.s. | n.s. | - |
| Profit/(loss) for the year | 1,398 | (10.0) | (5.1) | 1,553 |
| Non-controlling interests | (234) | (10.8) | 13.9 | (262) |
| Net attributable profit | 1,164 | (9.8) | (8.1) | 1,290 |
| Net attributable profit excluding results from corporate operations | 1,164 | (9.8) | (8.1) | 1,290 |
| Earning per share (euros) (1) | 0.16 | 0.18 |
- General note: the application of accounting for hyperinflation in Argentina was performed for the first time in September 2018 with accounting effects on January 1, 2018, recording the impact of the 9 months in the third quarter. In order to make the 2019 information comparable to 2018, the income statements for the first three quarters of 2018 have been reexpressed to reflect the impacts of inflation on their income and expenses.
- (1) Adjusted by additional Tier 1 instrument remuneration.
Unless expressly indicated otherwise, to better understand the changes in the main headings of the Group's income statement, the year-on-year percentage changes provided below refer to constant exchange rates.
Gross income
Gross income increased by 4.3% year-on-year, supported by the positive performance of net interest income.
Gross income (Millions of euros)
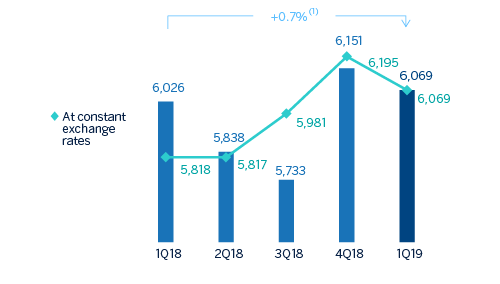
(1) At constant exchange rates: +4.3%.
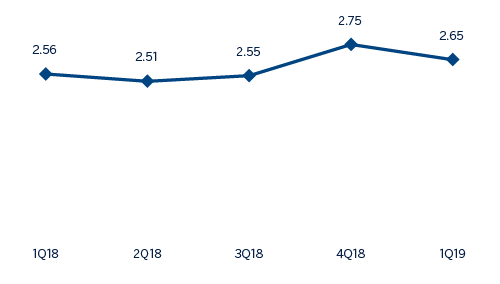
Net interest income registered a growth of 6.7% year-on-year, with increases in all business areas due to lower financing costs, except for Spain and Rest of Eurasia, which are more influenced by the interest rate situation in the Eurozone.
Net interest income/ATAs (Percentage)
On the other hand, cumulative net fees and commissions (up 1.3% year-on-year) also increased, thanks to their adequate diversification.
As a result, the more recurring revenues items (net interest income plus net fees and commissions) increased by 5.5% year-on-year.
Net interest income plus fees and commissions (Millions of euros)

(1) At constant exchange rates: +5.5%.
NTI between January and March 2019 was 8.4% higher than the figure obtained in the same quarter of 2018, supported by one-off transactions and in general by gains deriving from securities portfolio management, particularly in the United States and South America.
Other operating income and expenses decreased by 90.2% year-on-year, mainly as a result of higher levels of inflation. However, the net contribution of the insurance business grew by 10.3% year-on-year.
Operating income
Operating expenses in the first quarter of 2019 registered a growth of 1.1% year-on-year, considerably below the inflation rate recorded in the main countries where BBVA is present (down 1.8% at current exchange rates). The Group continues to apply strict cost discipline in all areas of the Group.
Operating expenses (Millions of euros)
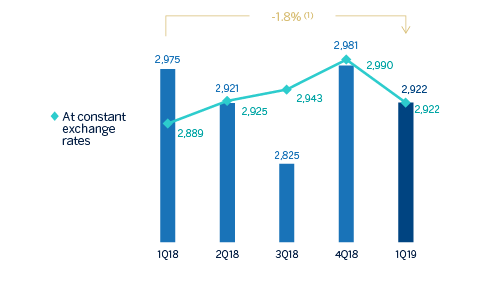
(1) At constant exchange rates: +1.1%.
As a consequence of this evolution of operating expenses, the efficiency ratio continued to improve and stood at 48.1%, below the level reached at the end of 2018 (49.3%), while operating income registered an increase of 7.4% year-on-year.
Efficiency ratio (Percentage)

Operating Income (Millions of euros)
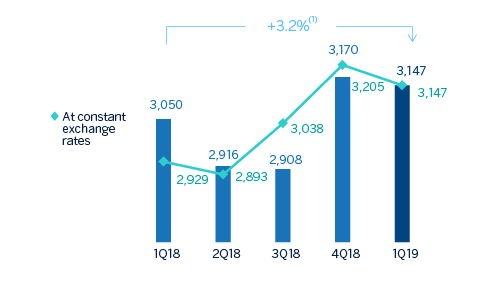
(1) At constant exchange rates: +7.4%.
Provisions and other
Impairment on financial assets not measured at fair value through profit or loss (impairment on financial assets) in the first three months of 2019 decreased by 24.3% compared to the fourth quarter of 2018, while it increased 27.2% compared to the first quarter of the same year. By business areas, there were higher loan-loss provisions in the United States due to the deterioration of some specific customers in the commercial portfolio and some write-offs in consumer, and in Turkey due to the deterioration of wholesale client portfolios. In addition, both countries are also located in geographic areas affected by the update of the macroeconomic outlook. On the contrary, Spain recognized lower loan-loss provisions, and Mexico remained at similar levels compared to the first quarter of last year.
Impairment on financial assests (net) (Millions of Euros)
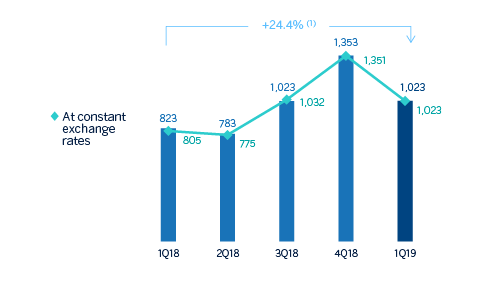
(1) At constant exchange rates: +27.2%.
Finally, the heading provisions or reversal of provisions (hereinafter, “provisions”) was 52.7% above the figure recognized in the same quarter of 2018.
Results
As a result of the above, the Group's net attributable profit in the first quarter of 2019 was 8.1% below that obtained in the same period of the previous year, characterized by stable levels of recurring revenue that were negatively impacted by higher loan-loss provisions.
Net attributable profit (Millions of Euros)
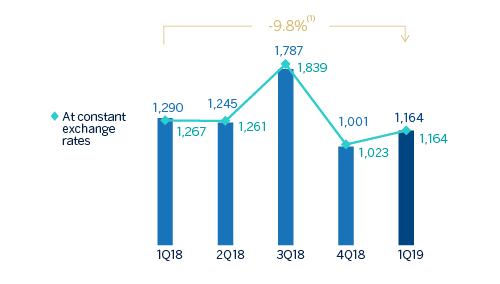
(1) At constant exchange rates: -8.1%.
By business area, Spain generated net attributable profit of €345m, the United States €127m, Mexico recorded a profit of €627m, Turkey contributed €142m, South America €193m, and Rest of Eurasia €16m.
Tangible book value per share and shareholder remuneration (Euros)

Earning per share (1) (Euros)
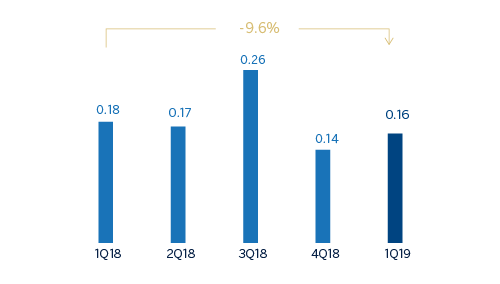
(1) Adjusted by additional Tier 1 instrument remuneration.
ROE and ROTE (1) (Percentage)
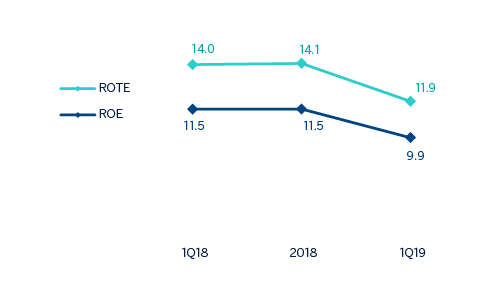
(1) The ROE and ROTE ratios include, in the denominator, the Group’s average shareholders’ funds and take into account the item called “Accumulated other comprehensive income”, which forms part of the equity. Excluding this item, the ROE would stand at 10.1% in 1Q18, 10.1% in 2018 and 8.6% in 1Q19; and the ROTE on 12.0%, 11.9% and 10.2%, respectively.
ROA and RORWA (Percentage)
