Business areas
Business areas
Spain
Millions of euros and year-on-year changes
Highlights
- Favorable trend of activity, especially in high profitable segments.
- Net Interest income affected by lower ALCO contribution and the impact of IFRS 16.
- The positive trend in operating expenses continues.
- Positive impact of the sale of NPL and write-off portfolios on loan loss provisions and risk indicators.
Results
Net interest income
1,808Gross income
2,818Operating income
1,190Net attributable profit
734Activity (2)
Performing loans and advances to customers under mangement
+0.8%Customers funds under management
+2.2%
Risks
NPL coverage ratio
NPL ratio
Cost of risk
(1) Year on year changes.
(2) Excluding repos.
The United States
Millions of euros and year-on-year changes at constant exchange rate
Highlights
- Good performance of retail lending.
- Positive trend in net interest income and customer spreads.
- The improvement in the efficiency ratio continues.
- Net attributable profit affected by the impairment on financial assets associated with specific customers of the commercial portfolio and to write-offs in consumer loans.
Results
Net interest income
1,217Gross income
1,615Operating income
655Net attributable profit
297Activity (2)
Performing loans and advances to customers under mangement
+3.7%Customers funds under management
+1.3%
Risks
NPL coverage ratio
NPL ratio
Cost of risk
(1) Year on year changes at constant exchange rate.
(2) Excluding repos.
Mexico
Millions of euros and year-on-year changes at constant exchange rate
Highlights
- Lending growth boosted by the retail portfolio.
- Favourable performance of customer funds especially in time deposits and off-balance sheet funds.
- Positive performance of net interest income growing above activity.
- Good asset quality indicators.
Results
Net interest income
3,042Gross income
3,901Operating income
2,611Net attributable profit
1,287Activity (2)
Performing loans and advances to customers under mangement
+5.9%Customers funds under management
+5.2%
Risks
NPL coverage ratio
NPL ratio
Cost of risk
(1) Year on year changes at constant exchange rate.
(2) Excluding repos.
Turkey
Millions of euros and year-on-year changes at constant exchange rate
Highlights
- Positive trend in activity.
- Good performance of net interest income, favored by the income from inflation-linked bonds.
- Operating expenses growth below the inflation rate.
- Positive evolution of the recurring revenue items offset by higher loan-loss provisions on financial assets.
Results
Net interest income
1,353Gross income
1,677Operating income
1,084Net attributable profit
282Activity (2)
Performing loans and advances to customers under mangement
-0.9%Customers funds under management
+14.1%
Risks
NPL coverage ratio
NPL ratio
Cost of risk
(1) Year on year changes at constant exchange rate.
(2) Excluding repos.
South America
Millions of euros and year-on-year changes at constant exchange rates
Highlights
- Positive trend of lending in the main countries.
- Good performance of net interest income is maintained.
- Net Attributable profit impacted by Argentina's hyperinflation adjustment.
- Positive contribution of the main countries: Argentina, Colombia and Peru to the Group’s attributable profit.
Results
Net interest income
1,613Gross income
1,994Operating income
1,215Net attributable profit (3)
404Activity (2) (3)
Performing loans and advances to customers under mangement
+6.3%Customers funds under management
+11.5%
Risks
NPL coverage ratio
NPL ratio
Cost of risk
(1) Year on year changes at constant exchange rates.
(2) Excluding repos.
(3) Excluding BBVA Chile as of June 30, 2018.
Rest of Eurasia
Millions of euros and year-on-year changes
Highlights
- Good performance in lending.
- Positive trend of net interest income, in an environment of negative interest rates.
- Moderated growth of the operating expenses.
- Improvement of asset quality indicators.
Results
Net interest income
84Gross income
220Operating income
78Net attributable profit
55Activity (2)
Performing loans and advances to customers under mangement
+5.5%Customers funds under management
-15.5%
Risks
NPL coverage ratio
NPL ratio
Cost of risk
(1) Year on year changes.
(2) Excluding repos.
(1) Gross income. Year-on-year change.
(2) Gross income. Year-on-year change at constant exchange rate.
(3) Gross income. Year-on-year changes at constant exchange rates.
Business Areas
Spain (1)
€2,818 Mill.
-6.8%
Millions of euros and year-on-year changes
Highlights
- Favorable trend of activity, especially in high profitable segments.
- Net Interest income affected by lower ALCO contribution and the impact of IFRS 16.
- The positive trend in operating expenses continues.
- Positive impact of the sale of NPL and write-off portfolios on loan loss provisions and risk indicators.
Results
Net interest income
1,808Gross income
2,818Operating income
1,190Net attributable profit
734Activity (2)
Performing loans and advances to customers under mangement
+0.8%Customers funds under management
+2.2%
Risks
NPL coverage ratio
NPL ratio
Cost of risk
(1) Year on year changes.
(2) Excluding repos.
The United States (2)
€1,615 Mill.
+5.1%
Millions of euros and year-on-year changes at constant exchange rate
Highlights
- Good performance of retail lending.
- Positive trend in net interest income and customer spreads.
- The improvement in the efficiency ratio continues.
- Net attributable profit affected by the impairment on financial assets associated with specific customers of the commercial portfolio and to write-offs in consumer loans.
Results
Net interest income
1,217Gross income
1,615Operating income
655Net attributable profit
297Activity (2)
Performing loans and advances to customers under mangement
+3.7%Customers funds under management
+1.3%
Risks
NPL coverage ratio
NPL ratio
Cost of risk
(1) Year on year changes at constant exchange rate.
(2) Excluding repos.
Mexico (2)
€3,901 Mill.
+5.6%
Millions of euros and year-on-year changes at constant exchange rate
Highlights
- Lending growth boosted by the retail portfolio.
- Favourable performance of customer funds especially in time deposits and off-balance sheet funds.
- Positive performance of net interest income growing above activity.
- Good asset quality indicators.
Results
Net interest income
3,042Gross income
3,901Operating income
2,611Net attributable profit
1,287Activity (2)
Performing loans and advances to customers under mangement
+5.9%Customers funds under management
+5.2%
Risks
NPL coverage ratio
NPL ratio
Cost of risk
(1) Year on year changes at constant exchange rate.
(2) Excluding repos.
Turkey (2)
€1,677 Mill.
+11.9%
Millions of euros and year-on-year changes at constant exchange rate
Highlights
- Positive trend in activity.
- Good performance of net interest income, favored by the income from inflation-linked bonds.
- Operating expenses growth below the inflation rate.
- Positive evolution of the recurring revenue items offset by higher loan-loss provisions on financial assets.
Results
Net interest income
1,353Gross income
1,677Operating income
1,084Net attributable profit
282Activity (2)
Performing loans and advances to customers under mangement
-0.9%Customers funds under management
+14.1%
Risks
NPL coverage ratio
NPL ratio
Cost of risk
(1) Year on year changes at constant exchange rate.
(2) Excluding repos.
South America (3)
€1,994 Mill.
+9.7%
Millions of euros and year-on-year changes at constant exchange rates
Highlights
- Positive trend of lending in the main countries.
- Good performance of net interest income is maintained.
- Net Attributable profit impacted by Argentina's hyperinflation adjustment.
- Positive contribution of the main countries: Argentina, Colombia and Peru to the Group’s attributable profit.
Results
Net interest income
1,613Gross income
1,994Operating income
1,215Net attributable profit (3)
404Activity (2) (3)
Performing loans and advances to customers under mangement
+6.3%Customers funds under management
+11.5%
Risks
NPL coverage ratio
NPL ratio
Cost of risk
(1) Year on year changes at constant exchange rates.
(2) Excluding repos.
(3) Excluding BBVA Chile as of June 30, 2018.
Rest of Eurasia (1)
€220 Mill.
+1.4%
Millions of euros and year-on-year changes
Highlights
- Good performance in lending.
- Positive trend of net interest income, in an environment of negative interest rates.
- Moderated growth of the operating expenses.
- Improvement of asset quality indicators.
Results
Net interest income
84Gross income
220Operating income
78Net attributable profit
55Activity (2)
Performing loans and advances to customers under mangement
+5.5%Customers funds under management
-15.5%
Risks
NPL coverage ratio
NPL ratio
Cost of risk
(1) Year on year changes.
(2) Excluding repos.
(1) Gross income. Year-on-year change.
(2) Gross income. Year-on-year change at constant exchange rate.
(3) Gross income. Year-on-year changes at constant exchange rates.
This section presents and analyzes the most relevant aspects of the Group's different business areas. Specifically, for each one of them, it shows a summary of the income statement and balance sheet, the business activity figures and the most significant ratios.
In 2019, BBVA Group’s business areas reporting structure of the BBVA Group's business areas differs from the one presented at the end of 2018, as a result of the integration of the Non-Core Real Estate business area into Banking Activity in Spain, now reported as “Spain”. In order to make the 2019 information comparable to 2018, the figures for both areas have been reexpressed.
In the second quarter of the year, the Group carried out the unification of the BBVA brand in the countries in which it operates, discontinuing the local brand names in Argentina (Francés), the United States (Compass), Mexico (Bancomer), and Peru (Continental). The franchise in Turkey has been renamed Garanti BBVA.
BBVA Group's business areas are summarized below:
- Spain mainly includes the banking and insurance businesses that the Group carries out in this country.
- The United States includes the financial business activity that BBVA carries out in the country and the activity of the BBVA, S.A branch in New York.
- Mexico includes banking and insurance businesses in this country as well as the activity that BBVA Mexico carries out through its branch in Houston.
- Turkey reports the activity of BBVA Garanti group that is mainly carried out in this country and, to a lesser extent, in Romania and the Netherlands.
- South America basically includes banking and insurance businesses in the region.
- Rest of Eurasia includes the banking business activity carried out in Asia and in Europe, excluding Spain.
The Corporate Center exercises centralized Group functions, including: the costs of the head offices with a corporate function; management of structural exchange rate positions; some equity instruments issuances to ensure an adequate management of the Group's global solvency. It also includes portfolios whose management is not linked to customer relationships, such as industrial holdings; certain tax assets and liabilities; funds due to commitments to employees; goodwill and other intangible assets.
In addition to these geographical breakdowns, supplementary information is provided for the wholesale business carried out by BBVA, i.e. Corporate & Investment Banking (CIB), in the countries where it operates. This business is relevant to have a broader understanding of the Group's activity and results due to the important features of the type of customers served, products offered and risks assumed.
The information by business areas is based on units at the lowest level and/or companies that comprise the Group, which are assigned to the different areas according to the main region or company group in which they carry out their activity.
As usual, in the case of the different business areas in America and Turkey and in CIB, the results of applying constant exchange rates are given as well as the year-on-year variations at current exchange rates.
Major income statement items by business area (Millions of euros)
| Business areas | ||||||||||
|---|---|---|---|---|---|---|---|---|---|---|
| BBVA Group |
Spain | The United States |
Mexico | Turkey | South America |
Rest of Eurasia |
∑ Business areas | Corporate Center | ||
| 1H19 | ||||||||||
| Net interest income | 8,987 | 1,808 | 1,217 | 3,042 | 1,353 | 1,613 | 84 | 9,118 | (132) | |
| Gross income | 11,989 | 2,818 | 1,615 | 3,901 | 1,677 | 1,994 | 220 | 12,225 | (236) | |
| Operating income | 6,115 | 1,190 | 655 | 2,611 | 1,084 | 1,215 | 78 | 6,833 | (718) | |
| Profit/(loss) before tax | 4,052 | 1,027 | 363 | 1,783 | 726 | 847 | 69 | 4,814 | (762) | |
| Net attributable profit | 2,442 | 734 | 297 | 1,287 | 282 | 404 | 55 | 3,058 | (616) | |
| 1H18 (1) (2) | ||||||||||
| Net interest income | 8,590 | 1,852 | 1,082 | 2,648 | 1,510 | 1,553 | 83 | 8,727 | (137) | |
| Gross income | 11,863 | 3,023 | 1,437 | 3,465 | 1,924 | 1,987 | 217 | 12,052 | (188) | |
| Operating income | 5,967 | 1,336 | 544 | 2,309 | 1,245 | 1,078 | 77 | 6,588 | (621) | |
| Profit/(loss) before tax | 4,286 | 1,056 | 493 | 1,654 | 964 | 724 | 93 | 4,984 | (698) | |
| Net attributable profit | 2,536 | 746 | 385 | 1,200 | 372 | 332 | 60 | 3,094 | (558) | |
- (1) The impact derived from the accounting for hyperinflation in Argentina for the first nine months of 2018 was recorded for the first time in the third quarter of the year, with accounting effects on January 1, 2018. In order to make the 2019 information comparable to the 2018, the income statements for the first three quarters of the 2018 fiscal year have been reexpressed to reflect the impacts of inflation on their income and expenses.
- (2) The income statements for 2018 were reexpressed due to changes in the reallocation of some expenses related to global projects and activities between the Corporate Center and the business areas incorporated in 2019.
Gross income (1), operating income (1) and net attributable profit breakdown (1) (Percentage. 1H19)
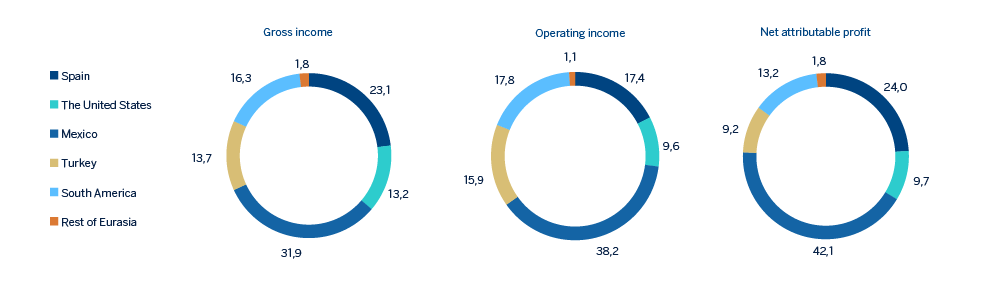
(1) Excludes the Corporate Center.
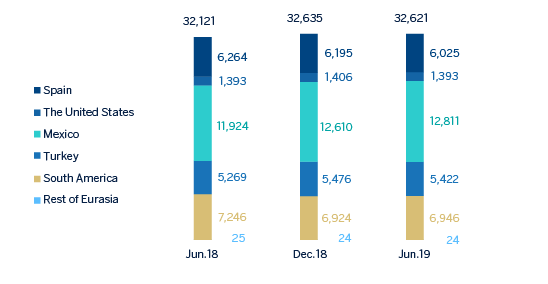
Major balance-sheet items and risk-weighted assets by business area (Millions of euros)
| Business areas | ||||||||||
|---|---|---|---|---|---|---|---|---|---|---|
| BBVA Group |
Spain | The United States |
Mexico | Turkey | South America |
Rest of Eurasia |
∑ Business areas | Corporate Center | Deletions | |
| 30-06-19 | ||||||||||
| Loans and advances to customers |
377,155 | 171,081 | 60,130 | 54,432 | 39,286 | 35,712 | 17,552 | 378,193 | 349 | (1,386) |
| Deposits from customers | 375,104 | 180,434 | 63,122 | 52,960 | 39,456 | 36,896 | 4,294 | 377,162 | 302 | (2,361) |
| Off-balance sheet funds | 103,804 | 64,370 | - | 23.419 | 2,983 | 12,577 | 454 | 103,804 | - | - |
| Total assets/liabilities and equity |
697,626 | 368,982 | 86,229 | 105,366 | 64,641 | 56,433 | 20,209 | 701,860 | 10,567 | (14,801) |
| Risk-weighted assets | 360,069 | 107,486 | 62,383 | 55,919 | 57,551 | 43,995 | 16,405 | 343,739 | 16,331 | - |
| 31-12-18 (1) | ||||||||||
| Loans and advances to customers |
374,027 | 170,438 | 60,808 | 51,101 | 41,478 | 34,469 | 16,598 | 374,893 | 990 | (1,857) |
| Deposits from customers | 375,970 | 183,414 | 63,891 | 50,530 | 39,905 | 35,842 | 4,876 | 378,456 | 36 | (2,523) |
| Off-balance sheet funds | 98,150 | 62,559 | - | 20,647 | 2,894 | 11,662 | 388 | 98,150 | - | - |
| Total assets/liabilities and equity |
676,689 | 354,901 | 82,057 | 97,432 | 66,250 | 54,373 | 18,834 | 673,848 | 16,281 | (13,440) |
| Risk-weighted assets | 348,264 | 104,113 | 64,175 | 53,177 | 56,486 | 42,724 | 15,476 | 336,151 | 12,113 | - |
- (1) The impact derived from the accounting for hyperinflation in Argentina for the first nine months of 2018 was recorded for the first time in the third quarter of the year, with accounting effects on January 1, 2018. In order to make the 2019 information comparable to the 2018, the balance sheets of the first three quarters of the 2018 have been reexpressed to reflect the impacts of inflation on their assets and liabilities.
Since 2019, a column has been included in the balance sheet, which includes the deletions and balance adjustments between different business areas, especially in terms of the relationship between the areas in which the parent company operates, i.e. Spain, Rest of Eurasia and Corporate Center. In previous years, these deletions were allocated to the different areas, mainly in Banking Activity in Spain. Accordingly, the figures from the previous year have been reexpressed to show comparable series.
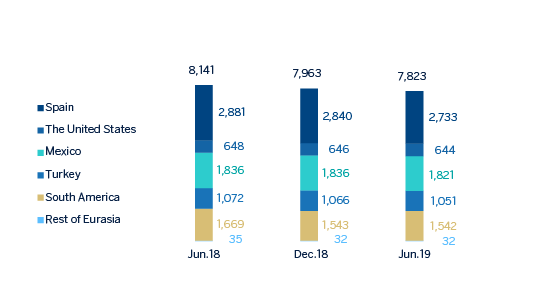
Number of employees

Number of branches
Number of ATMs