
Mexico
Highlights
- Good performance of the lending activity, boosted by growth in the retail portfolio.
- Positive trend of customer funds especially in time deposits and off-balance sheet funds.
- Net interest income growing in line with the activity.
- NTI recovery in the third quarter.
- Higher provisions due to the increase in loan portfolios mainly in consumer.
Business activity (1)
(Year-on-year change at constant exchange rate. Data as of 30-09-19)
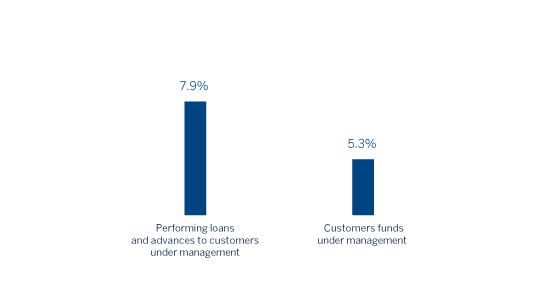
(1) Excluding repos.
Net interest income/ATAs
(Percentage. Constant exchange rate)

Operating income
(Millions of euros at constant exchange rate)

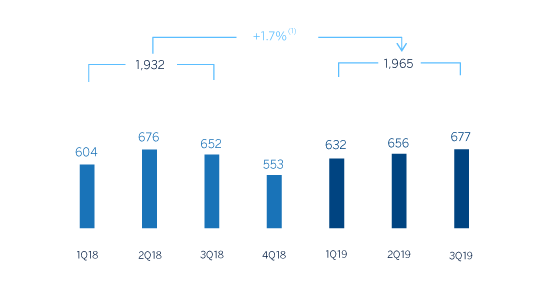
Net attributable profit
(Millions of euros at constant exchange rate)
(1) At current exchange rate: +11.0%.
(1) At current exchange rate: +6.9%.
Financial statements and relevant business indicators (Millions of euros and percentage)
| Income statement | Jan.-Sep. 19 | ∆% | ∆% (1) | Jan.-Sep. 18 |
|---|---|---|---|---|
| Net interest income | 4,599 | 11.9 | 6.5 | 4,110 |
| Net fees and commissions | 952 | 5.7 | 0.6 | 900 |
| Net trading income | 241 | 21.3 | 15.4 | 199 |
| Other operating income and expenses | 121 | (8.0) | (12.5) | 131 |
| Gross income | 5,912 | 10.7 | 5.3 | 5,340 |
| Operating expenses | (1,958) | 10.2 | 4.8 | (1,777) |
| Personnel expenses | (832) | 9.3 | 4.0 | (761) |
| Other administrative expenses | (866) | 4.5 | (0.5) | (829) |
| Depreciation | (260) | 38.3 | 31.6 | (188) |
| Operating income | 3,954 | 11.0 | 5.6 | 3,562 |
| Impairment on financial assets not measured at fair value through profit or loss | (1,238) | 17.3 | 11.6 | (1,055) |
| Provisions or reversal of provisions and other results | (14) | n.s. | n.s. | 32 |
| Profit/(loss) before tax | 2,702 | 6.4 | 1.2 | 2,539 |
| Income tax | (737) | 5.1 | (0.0) | (701) |
| Profit/(loss) for the year | 1,965 | 6.9 | 1.7 | 1,838 |
| Non-controlling interests | (0) | 8.4 | 3.2 | (0) |
| Net attributable profit | 1,965 | 6.9 | 1.7 | 1,838 |
| Balance sheets | 30-09-19 | ∆% | ∆% (1) | 31-12-18 |
|---|---|---|---|---|
| Cash. cash balances at central banks and other demand deposits | 6,831 | (17.4) | (21.3) | 8,274 |
| Financial assets designated at fair value | 30,669 | 17.9 | 12.4 | 26,022 |
| Of which loans and advances | 2,014 | n.s. | n.s. | 72 |
| Financial assets at amortized cost | 64,580 | 11.9 | 6.7 | 57,709 |
| Of which loans and advances to customers | 56,510 | 10.6 | 5.5 | 51,101 |
| Tangible assets | 1,997 | 11.7 | 6.5 | 1,788 |
| Other assets | 3,054 | (16.1) | (19.9) | 3,639 |
| Total assets/liabilities and equity | 107,131 | 10.0 | 4.9 | 97,432 |
| Financial liabilities held for trading and designated at fair value through profit or loss | 22,831 | 26.6 | 20.8 | 18,028 |
| Deposits from central banks and credit institutions | 2,105 | 208.0 | 193.7 | 683 |
| Deposits from customers | 52,826 | 4.5 | (0.3) | 50,530 |
| Debt certificates | 9,343 | 9.1 | 4.0 | 8,566 |
| Other liabilities | 15,591 | 0.7 | (4.0) | 15,485 |
| Economic capital allocated | 4,436 | 7.1 | 2.2 | 4,140 |
| Relevant business indicators | 30-09-19 | ∆% | ∆% (1) | 31-12-18 |
|---|---|---|---|---|
| Performing loans and advances to customers under management (2) | 57,040 | 11.0 | 5.9 | 51,387 |
| Non-performing loans | 1,462 | 28.5 | 22.5 | 1,138 |
| Customer deposits under management (2) | 52,390 | 5.3 | 0.5 | 49,740 |
| Off-balance sheet funds (3) | 24,155 | 17.0 | 11.6 | 20,647 |
| Risk-weighted assets | 57,454 | 8.0 | 3.0 | 53,177 |
| Efficiency ratio (%) | 33.1 | 33.3 | ||
| NPL ratio (%) | 2.4 | 2.1 | ||
| NPL coverage ratio (%) | 136 | 154 | ||
| Cost of risk (%) | 2.98 | 3.07 |
(1) Figures at constant exchange rate.
(2) Excluding repos.
(3) Includes mutual funds, pension funds and other off-balance sheet funds.
Activity
Unless expressly stated otherwise, all the comments below on rates of change, for both activity and results, will be given at constant exchange rates. These rates, together with changes at current exchange rates, can be found in the attached tables of financial statements and relevant business indicators. In addition, the quarterly variations are from the quarter ending with respect to the previous quarter.
The most relevant aspects related to the area's activity as of September 30, 2019 were:
- Lending activity (performing loans under management) increased by 5.9% during the first nine months of the year (up 7.9% year-on-year). Despite a complex environment and low economic growth, BBVA has retained its leading position in Mexico, with a market share of 22.5% in performing loans according to local figures from the National Banking and Securities Commission (CNBV) at the end of August 2019.
- The wholesale portfolio, which represents 50% of total lending, showed an increase of 0.3% in the first nine months of the year, driven mainly by the good performance of corporate loans which also grew by 0.3% during the same time horizon. The retail portfolio maintained a positive growth trend (up 6.8% compared to December 2018), strongly supported by consumer loans (mainly payroll and car-purchase loans) and mortgages (up 12.1% and 8.1% respectively compared to December 2018). This performance confirms the bank’s strategy of increasing the placement of these products among its customer base, despite the fall in sales in the automotive sector and the slowdown in the construction sector.
- In terms of asset quality indicators, the NPL ratio stood at 2.4% while the NPL coverage ratio stood at 136%.
- Total customer funds (customer deposits under management, mutual funds and other off-balance sheet funds) grew by 3.7% in the first nine months of the year (up 5.3% year-on-year), despite the highly competitive market. The increase is mostly explained by an 11.1% increase in time deposits (up 7.2% year-on-year), mainly driven by the corporate segment, and a 14.3% increase in mutual funds during the same period (up 9.3% year-on-year). Demand deposits continue representing 74% of total customer deposits under management, despite the transfer of demand deposits to time deposits and mutual funds, favored by high interest rates.
Results
BBVA in Mexico showed a net attributable profit of €1,965m in the first nine months of 2019, an increase of 1.7% year-on-year. In the third quarter of the year the net attributable profit recorded an improved performance (up 3.3% on a quarterly variation). The most relevant aspects related to the income statement are summarized below:
- Strong performance of net interest income that registered a year-on-year growth of 6.5%, driven by higher income from the retail portfolio.
- Net fees and commissions registered a slight year-on-year improvement of 0.6% due to a higher dynamism in investment banking activities and, credit card, mainly due to higher revenue.
- NTI grew by 15.4% thanks to the continued contribution of exchange differences; additionally, during the third quarter of the year, extraordinary revenues were recorded from sales of securities held for trading and those available-for-sale.
- The other operating income and expenses line registered a year-on-year decrease of 12.5%, mainly due to a higher contribution to the Deposit Guarantee Fund.
- Gross income grew by 5.3% year-on-year, which is higher than the increase registered in operating expenses (up 4.8%) that despite being heavily influenced by the effect of doubling the contribution to the BBVA Bancomer Foundation, remain subject to a strict cost control policy. As a result, the efficiency ratio improved slightly in the first nine months of 2019 standing at 33.1%.
- The impairment on financial assets line grew by 11.6% due to the higher provisions required by the consumer portfolio, caused by higher origination and the negative impact of the deterioration in the macro scenario. The cumulative cost of risk stood at 2.98% during the first nine months of 2019, improving slightly from the 3.07% in 2018.
- In the provisions (net) and other gains (losses) line, the comparison was negative due to extraordinary income in the first half of 2018 from the sale of holdings in real estate developments by BBVA in Mexico.