
The United States
Highlights
- Moderation of the activity growth rate.
- Good performance of the recurring revenue items.
- Continued improvement of the efficiency ratio.
- Net attributable profit affected by the impairment on financial assets.
Business activity (1)
(Year-on-year change at constant exchange rate. Data as of 30-09-19)
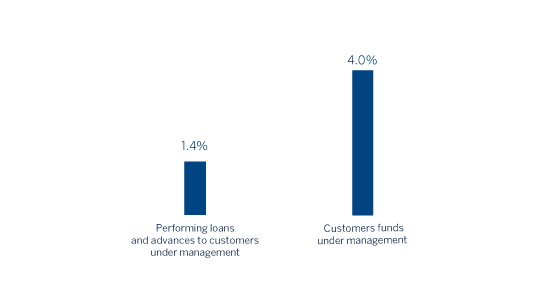
(1) Excluding repos.
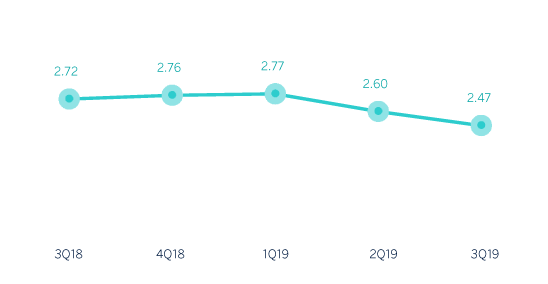
Net interest income/ATAs
(Percentage. Constant exchange rate)
Operating income
(Millions of euros at constant exchange rate)
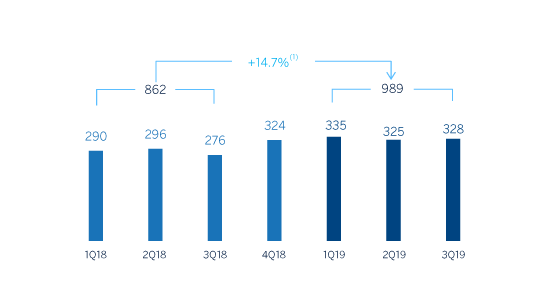
(1) At current exchange rate: +21.9%.
Net attributable profit
(Millions of euros at constant exchange rate)
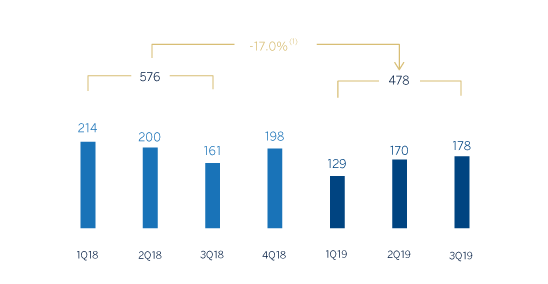
(1) At current exchange rate: -11.8%.
Financial statements and relevant business indicators
(Millions of euros and percentage)
| Income statement | Jan.-Sep. 19 | ∆% | ∆% (1) | Jan.-Sep. 18 |
|---|---|---|---|---|
| Net interest income | 1,813 | 8.9 | 2.4 | 1,665 |
| Net fees and commissions | 489 | 9.0 | 2.5 | 448 |
| Net trading income | 139 | 99.8 | 88.0 | 69 |
| Other operating income and expenses | 2 | n.s. | n.s. | (0) |
| Gross income | 2,442 | 11.9 | 5.3 | 2,182 |
| Operating expenses | (1,454) | 6.0 | (0.3) | (1,372) |
| Personnel expenses | (839) | 7.1 | 0.7 | (784) |
| Other administrative expenses | (449) | (1.5) | (7.3) | (456) |
| Depreciation | (165) | 25.4 | 18.0 | (132) |
| Operating income | 989 | 21.9 | 14.7 | 811 |
| Impaiment on financial assets not measured at fair value through profit or loss | (406) | 194.6 | 177.1 | (138) |
| Provisions or reversal of provisions and other results | 5 | (64.3) | (66.4) | 14 |
| Profit/(loss) before tax | 588 | (14.4) | (19.5) | 687 |
| Income tax | (110) | (24.2) | (28.7) | (145) |
| Profit/(loss) for the year | 478 | (11.8) | (17.0) | 542 |
| Non-controlling interests | - | - | - | - |
| Net attributable profit | 478 | (11.8) | (17.0) | 542 |
| Balance sheets | 30-09-19 | ∆% | ∆%(1) | 31-12-18 |
|---|---|---|---|---|
| Cash. cash balances at central banks and other demand deposits | 7,666 | 58.5 | 50.8 | 4,835 |
| Financial assets designated at fair value | 8,346 | (20.4) | (24.3) | 10,481 |
| Of which: Loans and advances | 246 | 57.3 | 49.6 | 156 |
| Financial assets at amortized cost | 69,343 | 9.1 | 3.8 | 63,539 |
| Of which: Loans and advances to customers | 63,210 | 3.9 | (1.1) | 60,808 |
| Inter-area positions | - | - | - | - |
| Tangible assets | 951 | 42.3 | 35.4 | 668 |
| Other assets | 2,425 | (4.3) | (9.0) | 2,534 |
| Total assets/liabilities and equity | 88,730 | 8.1 | 2.8 | 82,057 |
| Financial liabilities held for trading and designated at fair value through profit or loss | 249 | 6.2 | 1.0 | 234 |
| Deposits from central banks and credit institutions | 4,049 | 20.2 | 14.3 | 3,370 |
| Deposits from customers | 67,376 | 5.5 | 0.3 | 63,891 |
| Debt certificates | 3,710 | 3.1 | (2.0) | 3,599 |
| Inter-area positions | 3,024 | 57.0 | 49.3 | 1,926 |
| Other liabilities | 6,654 | 17.7 | 11.9 | 5,654 |
| Economic capital allocated | 3,668 | 8.4 | 3.1 | 3,383 |
| Relevant business indicators | 30-09-19 | ∆% | ∆% (1) | 31-12-18 |
|---|---|---|---|---|
| Performing loans and advances to customers under management (2) | 63,326 | 4.2 | (0.9) | 60,784 |
| Non-performing loans | 727 | (9.3) | (13.7) | 802 |
| Customer deposits under management (2) | 67,374 | 5.5 | 0.3 | 63,888 |
| Off-balance sheet funds (3) | - | - | - | - |
| Risk-weighted assets | 65,902 | 2.7 | (2.3) | 64,175 |
| Efficiency ratio (%) | 59.5 | 62.2 | ||
| NPL ratio (%) | 1.1 | 1.3 | ||
| NPL coverage ratio (%) | 102 | 85 | ||
| Cost of risk (%) | 0.87 | 0.39 |
- (1) Figures at constant exchange rate.
- (2) Excluding repos.
- (3) Includes mutual funds, pension funds and other off-balance-sheet funds.
Activity
Unless expressly stated otherwise, all the comments below on rates of change, for both activity and earnings, will be given at constant exchange rate. These rates, together with changes at current exchange rate, can be seen in the attached tables of financial statements and relevant business indicators. In addition, the quarterly variations are from the quarter ending with respect to the previous quarter.
The most relevant aspects related to the evolution of the area’s activity during the first nine months of 2019 were:
- Lending activity (performing loans under management) showed a slight decrease compared to the close of 2018 (down 0.9%), mainly due to a lower dynamism in the commercial portfolio and the contraction in the retail portfolio. On a quarterly basis lending activity showed flat growth that led to a year-on-year growth rate of 1.4%.
- The commercial portfolio showed a flat evolution in the first nine months (up 0.5%) but increased year-on-year (up 2.4%). The rest of retail portfolios, credit cards and consumer loan portfolios, that have higher margins and are increasingly being granted through digital channels, showed a decrease in the last nine months of 2.4%, but increased by 1.6% year-on-year.
- Regarding risk indicators, non-performing loans showed a significant reduction in the quarter, causing the NPL ratio to stand at 1.1% as of September 30, 2019 while the NPL coverage ratio improved to 102%.
- As the competition for deposits continue to be intense, customer deposits under management remained flat during the first nine months of 2019 (up 0.3%) but increased 4.0% year-on-year, mainly due to the increase in demand deposits (up 6.6%), which offset the decrease registered in time deposits (down 3.4%).
Results
The United States generated a cumulative net attributable profit of €478m during the first nine months of 2019, down 17.0% year-on-year, as a result of higher impairments on financial assets in comparison to the same period of the previous year. The most relevant aspects of the evolution of the results are summarized below:
- Net interest income continued to perform positively, with an increase of 2.4% on year-on-year basis, thanks to the updating of yields in the performing loan portfolio and to higher volumes, despite a higher cost of deposits and wholesale funding.
- Net fees and commissions increased by 2.5% year-on-year, mainly due to the increase in those fees related with investment banking, credit cards, merchants and, to a lesser extent, those associated to syndicated loans.
- Higher contribution from NTI, as a result of higher gains in the ALCO portfolio sales.
- Operating expenses remained flat (down 0.3%), which along with the performance of gross income (up 5.3%) led to a further improvement in the efficiency ratio that stood at 59.5%.
- Impairment on financial assets increased by 177.1% in the first nine months of 2019, due to provisions for some specific customers in the commercial portfolio, increased write-offs in consumer loans, and to a lesser extent, the macro scenario adjustments. In addition, the comparison is affected by the release of provisions related to the hurricanes in 2018. As a result, the cumulative cost of risk on September 30, 2019 increased to 0.87% compared to 0.39% on December 31, 2018.