
South America
Highlights
- Positive evolution of activity in the main countries: Argentina, Colombia and Peru.
- Improved efficiency ratio, supported by the growth in net interest income and the reduction in operating expenses.
- Higher contribution from the NTI in the third quarter due to the positive performance of foreign currencies operations.
- Net attributable profit impacted by Argentina's inflation adjustment.
- Positive contribution of the main countries to the Group's attributable profit.
Business activity (1)
(Year-on-year change at constant exchange rates (2). Data as of 30-09-19)
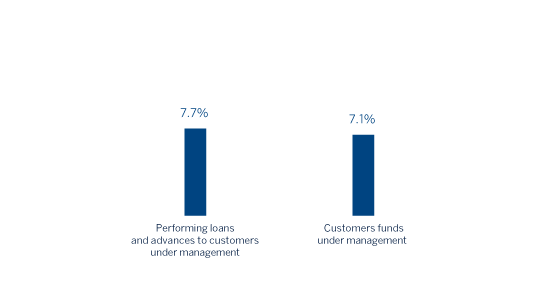
(1) Excluding repos.
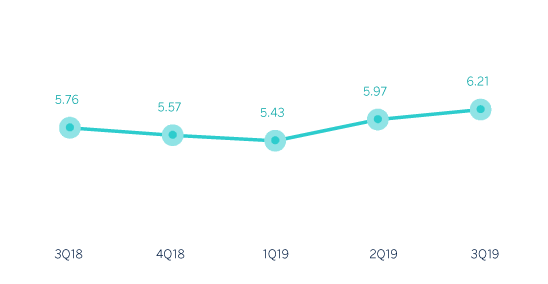
Net interest income/ATAs
(Percentage. Constant exchange rates)
Operating income
(Millions of euros at constant exchange rates)
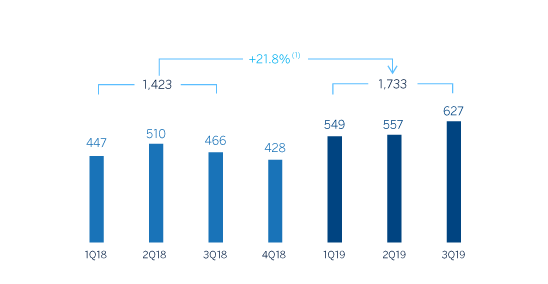
(1) At current exchange rate: +14.6%.
Net attributable profit
(Millions of euros at constant exchange rates)
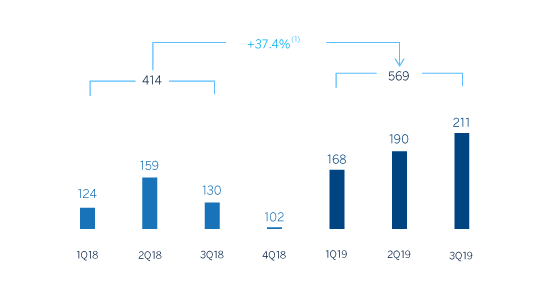
(1) At current exchange rate: +24.5%
Financial statements and relevant business indicators (Millions of euros and percentage)
| Income statement | Jan.-Sep. 19 | ∆% | ∆% (1) | Jan.-Sep. 18 |
|---|---|---|---|---|
| Net interest income | 2,376 | 6.7 | 12.9 | 2,226 |
| Net fees and commissions | 424 | (6.8) | (2.1) | 455 |
| Net trading income | 417 | 37.9 | 48.8 | 303 |
| Other operating income and expenses | (333) | 60.5 | 54.7 | (207) |
| Gross income | 2,884 | 3.9 | 10.8 | 2,777 |
| Operating expenses | (1,151) | (9.0) | (2.5) | (1,264) |
| Personnel expenses | (584) | (6.8) | 0.3 | (626) |
| Other administrative expenses | (444) | (18.8) | (13.2) | (547) |
| Depreciation | (123) | 35.4 | 41.3 | (91) |
| Operating income | 1,733 | 14.6 | 21.8 | 1,513 |
| Impaiment on financial assets not measured at fair value through profit or loss | (563) | 12.1 | 16.3 | (502) |
| Provisions or reversal of provisions and other results | (34) | (11.4) | 3.1 | (38) |
| Profit/(loss) before tax | 1,137 | 16.9 | 25.5 | 972 |
| Income tax | (321) | (4.0) | (0.2) | (334) |
| Profit/(loss) for the year | 816 | 27.9 | 39.6 | 638 |
| Non-controlling interests | (247) | 36.4 | 45.0 | (181) |
| Net attributable profit | 569 | 24.5 | 37.4 | 457 |
| Balance sheets | 30-09-19 | ∆% | ∆% (1) | 31-12-18 |
|---|---|---|---|---|
| Cash, cash balances at central banks and other demand deposits | 7,163 | (20.3) | (13.9) | 8,987 |
| Financial assets designated at fair value | 7,101 | 26.0 | 30.8 | 5,634 |
| Of which loans and advances | 302 | 134.3 | 135.9 | 129 |
| Financial assets at amortized cost | 38,231 | 4.3 | 7.3 | 36,649 |
| Of which loans and advances to customers | 35,875 | 4.1 | 7.0 | 34,469 |
| Tangible assets | 961 | 18.3 | 23.1 | 813 |
| Other assets | 2,518 | 9.9 | 11.8 | 2,290 |
| Total assets/liabilities and equity | 55,973 | 2.9 | 6.8 | 54,373 |
| Financial liabilities held for trading and designated at fair value through profit or loss | 1,641 | 21.0 | 22.3 | 1,357 |
| Deposits from central banks and credit institutions | 3,682 | 19.7 | 18.5 | 3,076 |
| Deposits from customers | 36,159 | 0.9 | 5.6 | 35,842 |
| Debt certificates | 3,307 | 3.2 | 1.4 | 3,206 |
| Other liabilities | 8,808 | 3.1 | 7.3 | 8,539 |
| Economic capital allocated | 2,375 | 0.9 | 6.0 | 2,355 |
| Relevant business indicators | 30-09-19 | ∆% | ∆% (1) | 31-12-18 |
|---|---|---|---|---|
| Performing loans and advances to customers under management (2) | 35,598 | 3.1 | 6.0 | 34,518 |
| Non-performing loans | 1,862 | 6.6 | 6.9 | 1,747 |
| Customer deposits under management (3) | 36,164 | 0.5 | 5.2 | 35,984 |
| Off-balance sheet funds (4) | 12,986 | 11.4 | 9.1 | 11,662 |
| Risk-weighted assets | 45,284 | 6.0 | 11.0 | 42,724 |
| Efficiency ratio (%) | 39.9 | 46.2 | ||
| NPL ratio (%) | 4.4 | 4.3 | ||
| NPL coverage ratio (%) | 97 | 97 | ||
| Cost of risk (%) | 1.91 | 1.44 |
- (1) Figures at constant exchange rates.
- (2) Excluding repos.
- (3) Excluding repos and including specific marketable debt securities.
- (4) Includes mutual funds, pension funds and other off-balance sheet funds.
South America. Data per country (Millions of euros)
| Operating income | Net attributable profit | |||||||
|---|---|---|---|---|---|---|---|---|
| Country | Jan.-Sep. 19 | ∆% | ∆% (1) | Jan.-Sep. 18 | Jan.-Sep. 19 | ∆% | ∆% (1) | Jan.-Sep. 18 |
| Argentina | 421 | 230.6 | n.s. | 127 | 117 | n.s. | n.s. | (4) |
| Chile | 103 | (59.2) | (58.1) | 254 | 47 | (59.1) | (58.0) | 116 |
| Colombia | 483 | 1.7 | 7.3 | 475 | 198 | 12.2 | 18.4 | 177 |
| Peru | 624 | 17.6 | 12.9 | 531 | 153 | 22.8 | 17.8 | 125 |
| Other countries (2) | 101 | (19.5) | (16.4) | 126 | 53 | 20.5 | 28.8 | 44 |
| Total | 1,733 | 14.6 | 21.8 | 1,513 | 569 | 24.5 | 37.4 | 457 |
- (1) Figures at constant exchange rates.
- (2) Venezuela, Paraguay, Uruguay and Bolivia. Additionally, it includes eliminations and other charges.
South America. Relevant business indicators per country (Millions of euros)
| Argentina | Chile | Colombia | Peru | |||||
|---|---|---|---|---|---|---|---|---|
| 30-09-19 | 31-12-18 | 30-09-19 | 31-12-18 | 30-09-19 | 31-12-18 | 30-09-19 | 31-12-18 | |
| Performing loans and advances to customers under management (1) (2) | 3,332 | 2,928 | 2,036 | 2,059 | 12,240 | 11,759 | 15,035 | 14,010 |
| Non-performing loans and guarantees given (1) | 129 | 60 | 68 | 58 | 703 | 763 | 817 | 744 |
| Customer deposits under management (1) (3) | 4,392 | 4,152 | 9 | 10 | 12,564 | 12,462 | 14,629 | 13,476 |
| Off-balance sheet funds (1) (4) | 658 | 543 | - | - | 1,473 | 1,278 | 1,802 | 1,748 |
| Risk-weighted assets | 6,070 | 8,036 | 2,248 | 2,243 | 14,051 | 12,680 | 19,130 | 15,739 |
| Efficiency ratio (%) | 44.5 | 73.7 | 33.1 | 42.1 | 35.9 | 37.1 | 35.3 | 36.0 |
| NPL ratio (%) | 3.7 | 2.0 | 3.2 | 2.8 | 5.2 | 6.0 | 4.1 | 4.0 |
| NPL coverage ratio (%) | 133 | 111 | 89 | 93 | 96 | 100 | 95 | 93 |
| Cost of risk (%) | 4.49 | 1.60 | 2.36 | 0.81 | 1.66 | 2.16 | 1.50 | 0.98 |
- (1) Figures at constant exchange rates.
- (2) Excluding repos.
- (3) Excluding repos and including specific marketable debt securities.
- (4) Includes mutual funds, pension funds and other off-balance-sheet funds.
Activity and results
Unless expressly stated otherwise, all the comments below on rates of change, for both activity and results, will be given at constant exchange rates. These rates, together with changes at current exchange rates, can be found in the attached tables of financial statements and relevant business indicators. In addition, the quarterly variations are from the quarter ending with respect to the previous quarter.
The most relevant aspects related to the area's activity as of September 30, 2019 were:
- Lending activity (performing loans under management) remains above the end of the previous year, increasing by 6.0%. Strong performance of the retail portfolio (especially positive in consumer loans and credit cards).
- With regard to asset quality, the NPL ratio stood at 4.4% as of September 30, 2019, slightly higher than the balance as of December 31, 2018, while the coverage stood at 97%, in line with the end of the previous year.
- In terms of customer funds, customer deposits increased by 5.2% in the first nine months, mainly due to the growth of time deposits and, to a lesser extent, demand deposits. Off-balance sheet funds grew by 9.1% in the same period.
With respect to results, South America generated cumulative net attributable profit of €569m in the first nine months of 2019, representing a year-on-year increase of 37.4% (up 24.5% at current exchange rates). The cumulative impact from January to September 2019 of the inflation in Argentina on the area's net attributable profit was -€72m.
The most relevant aspects of the income statement are summarized below:
- Continued growth of recurring revenue items, that is, net interest income and net fees and commissions, which grew as a whole by 10.3% in the last twelve months (up 4.4% at current exchange rates).
- Higher contribution from NTI (up 48.8%, and 37.9% at current exchange rates) due to the positive contribution, especially in the third quarter, of foreign exchange operations.
- Reduction of operating costs compared to the same period in the previous financial year (down 2.5%, and down 9.0% at current exchange rates).
- Impairment on financial assets increased (up 16.3%, and up 12.1% at current exchange rates), bringing the cumulative cost of risk to 1.91% at the end of September 2019.
- Higher provisions (net) and other gains (losses) compared to the same period of the previous year (up 3.1%, down 11.4% at constant exchange rates).
On homogeneous comparison, excluding BBVA Chile due to the sale completed in July 2018, net attributable profit grew by 45.0% year-on-year in the first nine months of 2019 at current exchange rates (up 62.0% at constant exchange rates).
The most significant countries in the business area, Argentina, Colombia and Peru, performed as follows in the first nine months of 2019 in terms of activity and results:
Argentina
- Lending activity grew by 13.8% during the first nine months of 2019, driven by the growth in retail consumer portfolios, credit cards and, to a lesser extent, mortgages. With regard to asset quality, there was an increase in the non-performing loan ratio, which stood at 3.7% as of September 30, 2019, although it continues to perform better than the system.
- In terms of customer funds, customer deposits increased by 5.8%, mainly supported by demand deposits, while off-balance sheet funds increased by 21.1%, both compared to the figures of December 2018.
- Net attributable profit stood at €117m, supported by the strong performance of net interest income (driven by an increased contribution from the securities portfolios and a better customer spread) as well as an increase in NTI (positively impacted by the sale of the holding in Prisma Medios de Pago S.A. in the first quarter of 2019 and foreign exchange operations). This strong performance was partially offset by an increase in operating expenses, significantly influenced by the high levels of inflation and greater requirements due to impairment on financial assets as a result of the recent downgrading of the country's rating.
Colombia
- Lending activity grew by 4.1% in the first nine months of the year, driven by the performance of retail portfolios (mainly consumer loans and mortgages). In terms of asset quality, the NPL ratio fell to 5.2% as of September 2019.
- Customer deposits increased slightly (up 0.8%) compared to the end of the 2018 financial year (up 1.8% year-on-year).
- The net attributable profit stood at €198m, with an increase of 18.4% year-on-year, driven by the growth of recurring revenue items, the good performance from NTI (up 18.3%), portfolio sales of inflation-linked assets and the valuation of the securities portfolio, the cost containment efforts and lower impairments on financial assets and provisions (down 10.7%).
Peru
- Lending activity was 7.3% higher than the end of the financial year 2018, mainly due to the wholesale portfolio and also supported by the strong performance of the retail portfolio (mainly consumer lending and mortgages). With regards to asset quality, there was a slight increase in both the NPL and NPL coverage ratios to 4.1% and 95%, respectively.
- Customer deposits increased by 8.6% in the first nine months of 2019, mainly due to time deposits (up 24.8% in the last nine months).
- Double-digit growth in net interest income, which grew by 11.6% year-on-year due to higher activity volumes in both the wholesale and retail portfolios. Increase from NTI year-on-year (up 19.8%) due to the growth of foreign exchange operations. As a result, the net attributable profit stood at €153m, with a year-on-year growth of 17.8%.