
Spain
Highlights
- Activity affected by the seasonality of the third quarter.
- Net Interest income influenced by lower ALCO contribution and the impact of IFRS 16.
- Continued decrease in operating expenses.
- Positive impact of the sale of non-performing and write-off portfolios on loan loss provisions and risk indicators.
Business activity (1)
(Year-on-year change. Data as of 30-09-19)
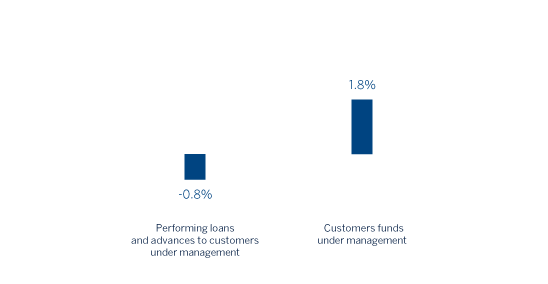
(1) Excluding repos.
Net interest income/ATAs
(Percentage)

Operating income (Millions of euros)

Net attributable profit (Millions of euros)

Financial statements and relevant business indicators (Millions of euros and percentage)
| Income statement | Jan.-Sep. 19 | ∆% | Jan.-Sep. 18 |
|---|---|---|---|
| Net interest income | 2,721 | (1.9) | 2,775 |
| Net fees and commissions | 1,287 | 1.3 | 1,271 |
| Net trading income | 121 | (62.5) | 324 |
| Other operating income and expenses | 177 | 42.5 | 124 |
| Of which insurance activities (1) | 385 | 8.1 | 356 |
| Gross income | 4,307 | (4.2) | 4,494 |
| Operating expenses | (2,441) | (3.0) | (2,518) |
| Personnel expenses | (1,414) | (0.2) | (1,416) |
| Other administrative expenses | (668) | (23.3) | (871) |
| Depreciation | (359) | 56.1 | (230) |
| Operating income | 1,866 | (5.6) | 1,976 |
| Impairment on financial assets not measured at fair value through profit or loss | (106) | (63.0) | (287) |
| Provisions or reversal of provisions and other results | (271) | 30.0 | (208) |
| Profit/(loss) before tax | 1,489 | 0.6 | 1,481 |
| Income tax | (423) | 9.3 | (387) |
| Profit/(loss) for the year | 1,066 | (2.5) | 1,094 |
| Non-controlling interests | (2) | (20.8) | (2) |
| Net attributable profit | 1,064 | (2.5) | 1,092 |
- (1) Includes premiums received net of estimated technical insurance reserves.
| Balance sheets | 30-09-19 | ∆% | 31-12-18 |
|---|---|---|---|
| Cash, cash balances at central banks and other demand deposits | 12,719 | (55.4) | 28,545 |
| Financial assets designated at fair value | 132,383 | 23.4 | 107,320 |
| Of which: Loans and advances | 35,587 | 17.8 | 30,222 |
| Financial assets at amortized cost | 196,380 | 0.5 | 195,467 |
| Of which: Loans and advances to customers | 166,217 | (2.5) | 170,438 |
| Inter-area positions | 19,145 | 36.5 | 14,026 |
| Tangible assets | 3,405 | 163.3 | 1,294 |
| Other assets | 8,129 | (1.5) | 8,249 |
| Total assets/liabilities and equity | 372,162 | 4.9 | 354,901 |
| Financial liabilities held for trading and designated at fair value through profit or loss | 80,835 | 13.8 | 71,033 |
| Deposits from central banks and credit institutions | 46,720 | 1.8 | 45,914 |
| Deposits from customers | 180,653 | (1.5) | 183,414 |
| Debt certificates | 33,562 | 7.0 | 31,352 |
| Inter-area positions | - | - | - |
| Other liabilities | 21,508 | 48.1 | 14,519 |
| Economic capital allocated | 8,883 | 2.5 | 8,670 |
| Relevant business indicators | 30-09-19 | ∆% | 31-12-18 |
|---|---|---|---|
| Performing loans and advances to customers under management (1) | 162,860 | (2.1) | 166,396 |
| Non-performing loans | 8,836 | (12.3) | 10,073 |
| Customer deposits under management (1) | 180,653 | (1.3) | 182,984 |
| Off-balance sheet funds (2) | 64,728 | 3.5 | 62,559 |
| Risk-weighted assets | 105,866 | 1.7 | 104,113 |
| Efficiency ratio (%) | 56.7 | 55.9 | |
| NPL ratio (%) | 4.6 | 5.1 | |
| NPL coverage ratio (%) | 59 | 57 | |
| Cost of risk (%) | 0.08 | 0.21 |
- (1) Excluding repos.
- (2) Includes mutual funds, pension funds and other off-balance-sheet funds.
Activity
The most relevant aspects related to the area's activity as of September 30, 2019 were:
- Lending activity (performing loans under management) was below the figure seen at the end of 2018 (down 2.1% in the last nine months, down 0.8% year-on-year), affected by the seasonality of the third quarter and despite the very positive performance of consumer loans (including credit cards, up 10.8% in the last nine months, up 15.6% year-on-year) and retail and medium-sized enterprises (up 2.6% in the last nine months, up 4.5% year-on-year), which could not offset the reduction seen in both the mortgage and institutions loans (down 2.8% and down 5.7% respectively in the last nine months, down 3.9% and down 8.0% respectively year-on-year).
- In asset quality, the reduction in NPL balances continued over the quarter, with a positive impact on the area's NPL ratio, which fell by two basis points to 4.6% as of September 30, 2019 (5.1% as of December 31, 2018). This evolution was mainly explained by the sale of non-performing real estate developer loans and write-offs in the second quarter, as well as a lower level of non-performing mortgage loans. The coverage stood at 59%, above the closing of 2018 (57%).
- Customer deposits under management closed the quarter in line with the balance at the end of June 2019, with a slight growth in demand deposits (up 0.4% in the quarter, up 7.2% year-on-year), and a decrease in time deposits of 1.1% (down 16.5% year-on-year). Total deposits, however, decreased compared to the end of December 2018 (down 1.3%) and grew by 2.1% year-on-year. Demand deposits now account for more than 82% of total customer deposits.
- Off-balance sheet funds performed well (up 3.5% since December 31, 2018 and up 0.9% year-on-year), in both mutual and pension funds.
Results
The net attributable profit generated by BBVA in Spain in the first nine months of 2019 was €1,064m, below the figure registered in the same period of the previous year (down 2.5%).
The main highlights of the area's income statement are:
- Net interest income decreased by 1.9% year-on-year, strongly influenced by the lower contribution from the ALCO portfolios and the effect of IFRS 16 implementation on January 1, 2019.
- Net fees and commissions were 1.3% higher compared to the registered in the same period of the previous year, thanks to a good performance in credit cards, fees charged for insurance sales and those charged to wholesale customers.
- Positive performance from NTI in the quarter with a contribution of €30m to the profit and loss account, compared to- €16m between April and June. The year-on-year comparison for the first nine months of 2019 was unfavorable (down 62.5%) due to the uneven market performance in 2019, and lower portfolio sales.
- Other operating income and expenses showed a year-on-year growth (up 42.5%) driven by the strong performance of the net earnings from the insurance business and the lower costs associated with the real estate business, which offset the greater contribution to the Single Resolution Fund (SRF) carried out in the second quarter of 2019.
- The positive trend in operating expenses (down 3.0% year-on-year) continued as a result of cost reduction plans driving the efficiency ratio to stand at 56.7%.
- The impairment on financial assets (down 63.0% year-on-year) is positively affected by the aforementioned sale of non-performing loans and write-offs from real estate developers loans carried out in the second quarter of the year.
- Finally, provisions (net) and other gains (losses) closed at -€271m and showed a year-on-year increase of 30.0%, partly due to higher provisions for contingent liabilities, as well as for real estate assets.