
Results
The BBVA Group generated a net attributable loss of €1,792m in the first quarter of 2020. The strong performance of the recurring revenue items (net interest income and fees and commissions), net trading income (NTI) and the other income line was offset by a higher impairments on financial assets, mainly due to the deterioration of the macroeconomic scenario resulting from COVID-19 and higher provisions, and, in addition, to the goodwill impairment in the United States in the first quarter of 2020 of €2,084m included in Other gains (losses) also caused by the COVID-19 pandemic. The comparison with the same period in 2019 is impacted by those two factors. Without taking into account the goodwill impairment in the United States, the Group's net attributable profit stood at €292m which corresponds to a decrease of 75.3% compared to the first quarter of 2019.
Consolidated income statement: quarterly evolution (Millions of euros)
| 2020 | 2019 | ||||
|---|---|---|---|---|---|
| 1Q | 4Q | 3Q | 2Q | 1Q | |
| Net interest income | 4,556 | 4,709 | 4,473 | 4,544 | 4,398 |
| Net fees and commissions | 1,258 | 1,290 | 1,273 | 1,256 | 1,214 |
| Net trading income | 594 | 490 | 351 | 116 | 426 |
| Other operating income and expenses | 75 | (89) | 22 | (18) | 8 |
| Gross income | 6,484 | 6,400 | 6,120 | 5,897 | 6,046 |
| Operating expenses | (2,918) | (3,082) | (2,946) | (2,952) | (2,922) |
| Personnel expenses | (1,532) | (1,637) | (1,572) | (1,578) | (1,553) |
| Other administrative expenses | (988) | (1,039) | (971) | (976) | (977) |
| Depreciation | (397) | (406) | (403) | (398) | (392) |
| Operating income | 3,566 | 3,317 | 3,174 | 2,945 | 3,124 |
| Impairment on financial assets not measured at fair value through profit or loss | (2,575) | (1,169) | (1,172) | (731) | (1,001) |
| Provisions or reversal of provisions | (312) | (243) | (113) | (117) | (144) |
| Other gains (losses) | (2,113) | (1,444) | (4) | (3) | (22) |
| Profit/(loss) before tax | (1,435) | 460 | 1,886 | 2,095 | 1,957 |
| Income tax | (186) | (430) | (488) | (595) | (541) |
| Profit/(loss) for the year | (1,621) | 31 | 1,398 | 1,500 | 1,416 |
| Non-controlling interests | (172) | (186) | (173) | (241) | (234) |
| Net attributable profit | (1,792) | (155) | 1,225 | 1,260 | 1,182 |
| Earning per share (euros) (1) | 0.29 | (0.04) | 0.17 | 0.17 | 0.16 |
| Of which: | |||||
| Goodwill impairment in the United States | (2,084) | (1,318) | |||
| Net attributable profit excluding the goodwill impairment in the United States | 292 | 1,163 | 1,225 | 1,260 | 1,182 |
| Earning per share excluding the goodwill impairment in the United States (euros) (1) | 0.03 | 0.16 | 0.17 | 0.17 | 0.16 |
- General note: as a result of the decision taken by the International Financial Reporting Standards Interpretations Committee (IFRIC) regarding the collecting of interests of written-off financial assets for the purpose of IFRS 9, those collections are presented as reduction of the credit allowances and not as a higher interest income, recognition method applied until December 2019. Therefore, and in order to make the information comparable, the quarterly information of the 2019 income statements has been restated.
- (1) Adjusted by additional Tier 1 instrument remuneration.
Consolidated income statement (Millions of euros)
| 1Q 2020 | ∆% | ∆% at constant exchange rates |
1Q 2019 | |
|---|---|---|---|---|
| Net interest income | 4,556 | 3.6 | 7.5 | 4,398 |
| Net fees and commissions | 1,258 | 3.6 | 6.3 | 1,214 |
| Net trading income | 594 | 39.5 | 54.6 | 426 |
| Other operating income and expenses | 75 | n.s. | n.s. | 8 |
| Gross income | 6,484 | 7.2 | 11.4 | 6,046 |
| Operating expenses | (2.918) | (0.1) | 2.2 | (2.922) |
| Personnel expenses | (1,532) | (1.3) | 1.0 | (1,553) |
| Other administrative expenses | (988) | 1.1 | 3.7 | (977) |
| Depreciation | (397) | 1.3 | 3.1 | (392) |
| Operating income | 3,566 | 14.1 | 20.3 | 3,124 |
| Impairment on financial assets not measured at fair value through profit or loss | (2,575) | 157.3 | 166.6 | (1,001) |
| Provisions or reversal of provisions | (312) | 117.0 | 119.7 | (144) |
| Other gains (losses) | (2.113) | n.s. | n.s. | (22) |
| Profit/(loss) before tax | (1.435) | n.s. | n.s. | 1,957 |
| Income tax | (186) | (65.6) | (63.4) | (541) |
| Profit/(loss) for the year (1) | (1,621) | n.s. | n.s. | 1,416 |
| Non-controlling interests | (172) | (26.6) | (15.7) | (234) |
| Net attributable profit | (1,792) | n.s. | n.s. | 1,182 |
| Earning per share (euros) (1) | (0.29) | 0.16 | ||
| Of which: | ||||
| Goodwill impairment in the United States | (2,084) | |||
| Net attributable profit excluding the goodwill impairment in the United States | 292 | (75,3) | (74,0) | 1.182 |
| Earning per share excluding the goodwill impairment in the United States (euros) (1) | 0.03 | 0.16 |
- General note: as a result of the decision taken by the International Financial Reporting Standards Interpretations Committee (IFRIC) regarding the collecting of interests of written-off financial assets for the purpose of IFRS 9, those collections are presented as reduction of the credit allowances and not as a higher interest income, recognition method applied until December 2019. Therefore, and in order to make the information comparable, the quarterly information of the 2019 income statements has been restated.
- (1) Adjusted by additional Tier 1 instrument remuneration.
Unless expressly indicated otherwise, to better understand the changes in the main headings of the Group's income statement, the year-on-year percentage changes provided below refer to constant exchange rates.
Gross income
Gross income increased by 11.4% year-on-year, supported by the good performance of net interest income and NTI and, to a lesser extent, the growth in net fees and commissions and the other operating income and expenses line.
Gross income (Millions of euros)
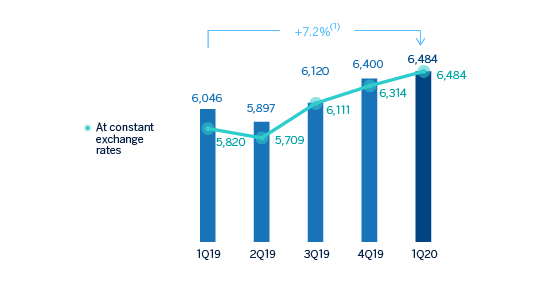
(1) At constant exchange rates: +11.4%.
Net interest income grew by 7.5% year-on-year, fostered by the good performance from Turkey, South America and, to a lesser extent, Mexico, which compensated the lower contribution from the United States as a result of the Fed’s interest-rate cuts in the second half of 2019.
Net fees and commissions also performed well and grew by 6.3% year-on-year, thanks to the strong contribution from Spain and the United States.
As a result, the more recurring revenue items grew in all geographical areas, with the exception of the United States, and ended the quarter with a year-on-year increase of 7.2%.
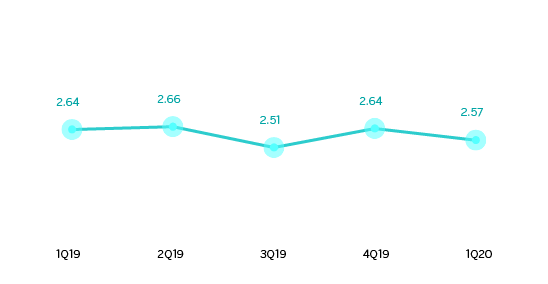
Net interest income/ATAs (Percentage)
Net interest income plus fees and commissions (Millions of euros)
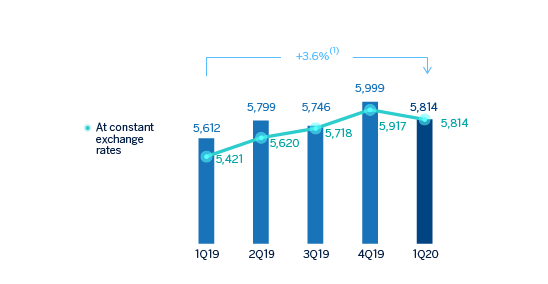
(1) At constant exchange rates: +7.2%.
NTI recorded a year-on-year increase of 54.6% mainly due to the foreign-exchange rate hedging gains registered at the Corporate Center, and, to a lesser extent, the earnings generated mainly from Turkey and the United States.
The other operating income and expenses line closed the first quarter of the year at €75m, which compares very positively with the €8m recorded in the same period of 2019, mostly due to the evolution of the insurance business in Mexico.
Operating income
Operating expenses increased by 2.2% between January and March 2020 (down 0.1% at current exchange rates) showing a variation below the inflation in most of the countries where BBVA is present. The main drivers are the reduction in expenses in Spain and the Corporate Center, as a result of the cost discipline plans.
Operating expenses (Millions of euros)
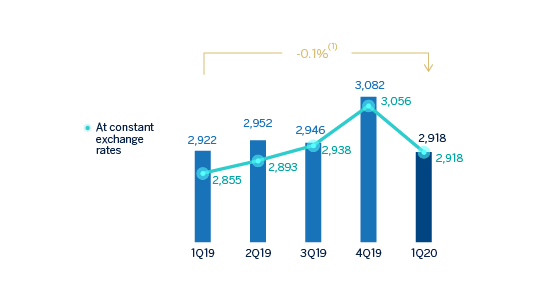
(1) At constant exchange rates: +2.2%.
The efficiency ratio stood at 45.0% at the end of the quarter, significantly below the level reached at the end of March 2019 (48.3%). As a result of gross income growing faster than expenses, the operating income line increased by 20.3% year-on-year.
Efficiency ratio (Percentage)
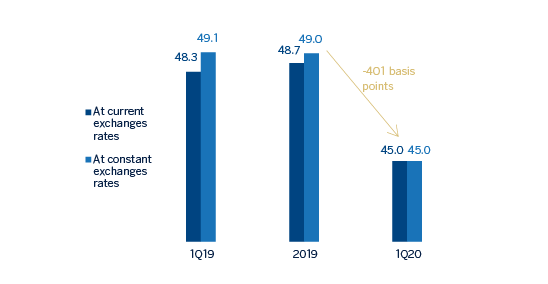
Operating Income (Millions of euros)
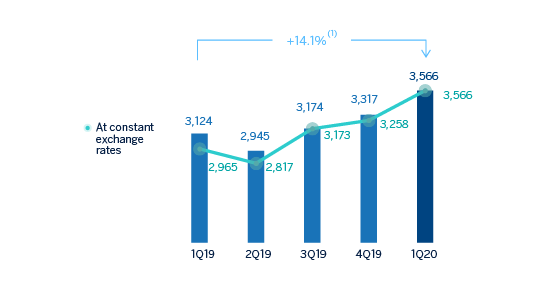
(1) At constant exchange rates: +20.3%.
Provisions and other
The impairment on financial assets not measured at fair value through profit or loss (impairment on financial assets) increased by 166.6% in the first quarter of 2020, mainly due to the negative impact of the deterioration in the macroeconomic scenario resulting from COVID-19, and had an impact at Group level of €-1,433m.
Impairment on financial assests (Millions of euros)
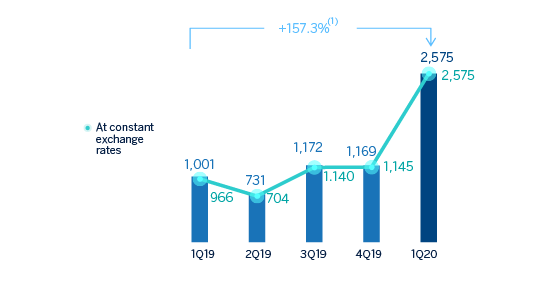
(1) At constant exchange rates: +166.6%.
Provisions or reversal of provisions (hereafter provisions) closed the quarter with a negative balance of €312m, 119.7% higher than the figure recorded in the same period of 2019, mainly due to higher provisions in Spain and additional provisions of €27m for COVID-19.
On the other hand, other gains (losses) mainly reflects the above mentioned goodwill impairment in the United States closing with a loss of €-2,113m.
Results
As a result of the above, the Group's net attributable loss for the first quarter of 2020 amounted to €1,792m, which compares negatively with the profit of €1,182m obtained in the same quarter of 2019. This comparison is affected by the increase in the impairment on financial assets as well as by the goodwill impairment in the United States, both related to the impact of COVID-19.
Net attributable profit (Millions of euros)
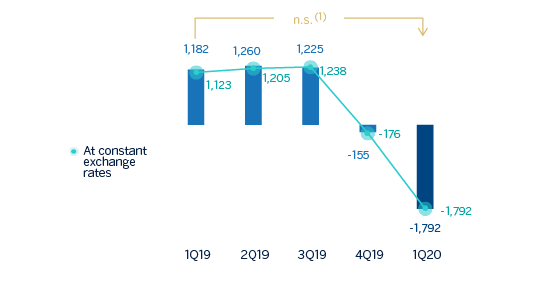
(1) At constant exchange rates: n.s.
Net attributable profit excluding The United States goodwill impairment (Millions of euros)
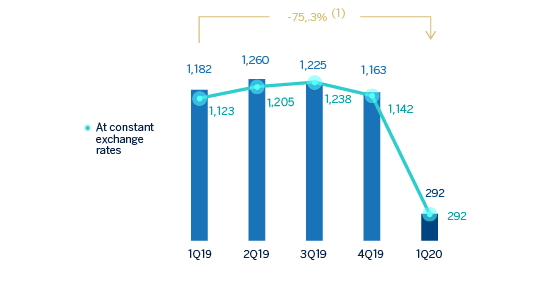
(1) At constant exchange rates: +74.0%.
By business areas, and in millions of euros, Spain and the United States had a net attributable loss of 141 and 100, respectively, and Mexico, Turkey, South America and the Rest of Eurasia recorded a net attributable profit of 372, 129, 70 and 44, respectively.
Tangible book value per share and dividends (1) (Euros)
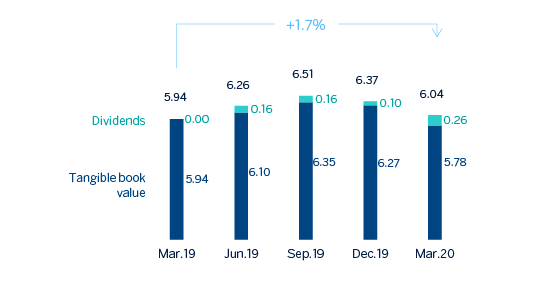
(1) Adjusted by additional Tier 1 instrument remuneration.
Earning per share (1) (Euros)
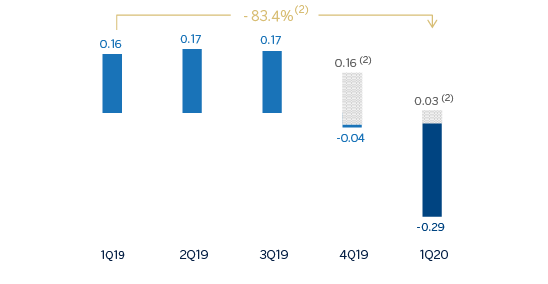
(1) Adjusted by additional Tier 1 instrument remuneration.
(2) Excluding the goodwill impairment in the United States in 4Q19 and 1Q20.
ROE and ROTE (1) (Percentage)
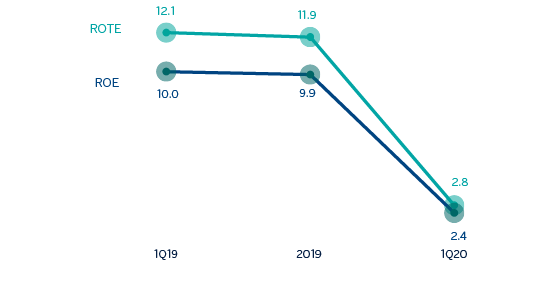
(1) Ratios excluding the goodwill impairment in the United States in 2019 and 1Q20.
ROA and RORWA (Percentage)
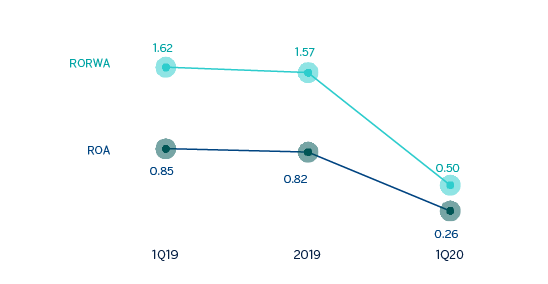
(1) Ratios excluding the goodwill impairment in the United States in 2019 and 1Q20.