
Mexico
Highlights
- Evolution of activity supported by the good performance of the wholesale portfolio.
- Improvement in the risk indicators.
- Stability of the main margins.
- Net attributable profit affected by the significant increase in the impairment on financial assets line.
Business activity (1)
(Year-on-year change at constant exchange rate. Data as of 30-09-20)
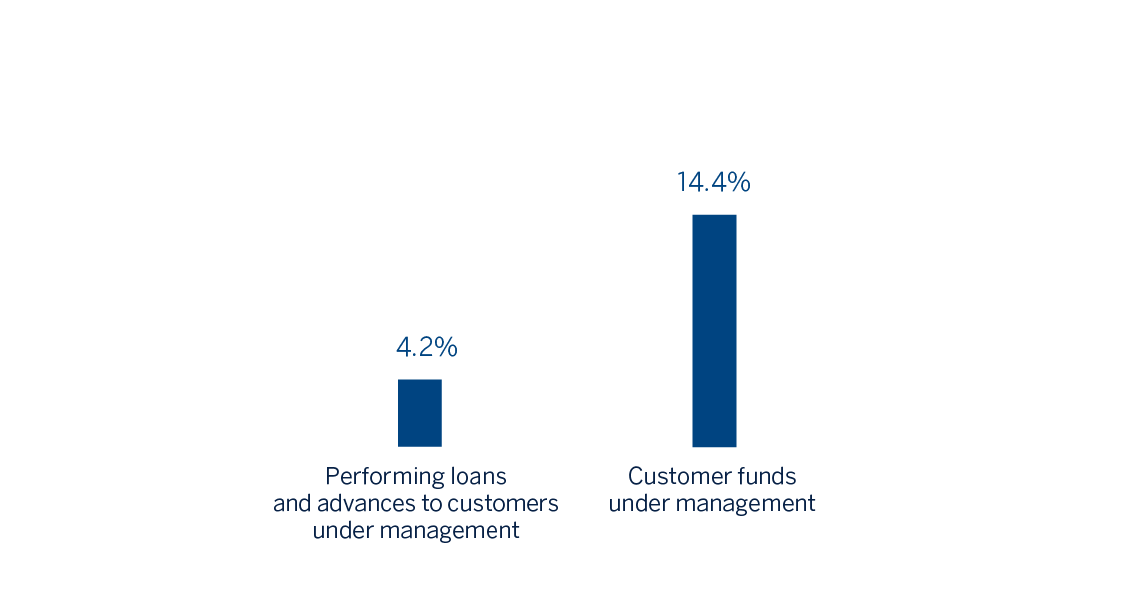
(1) Excluding repos.
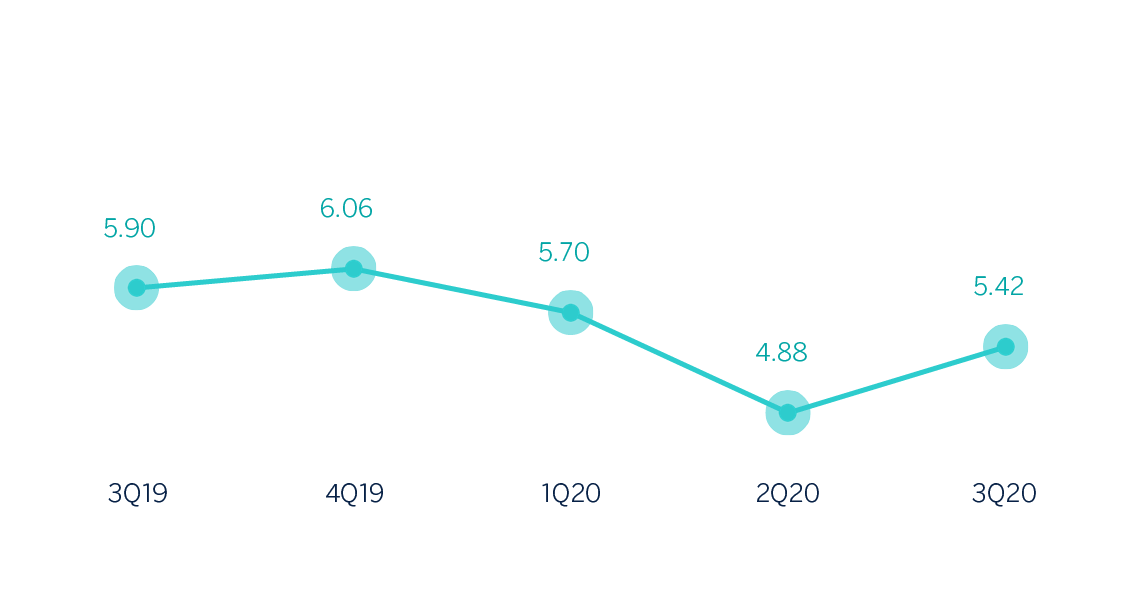
Net interest income/ATAs
(Percentage. Constant exchange rate)
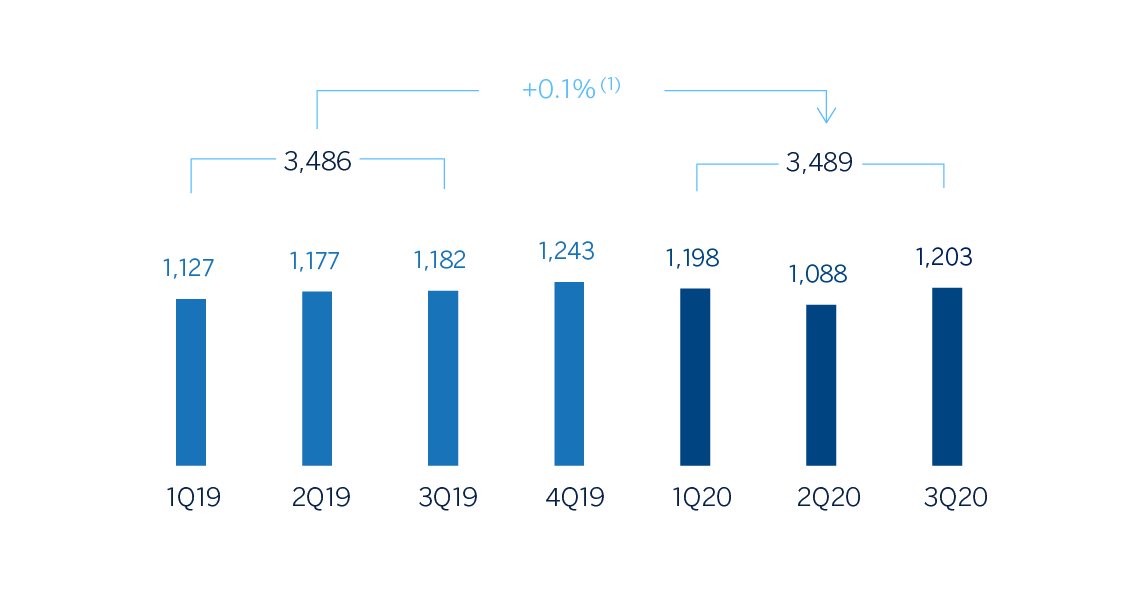
Operating income
(Millions of euros at constant exchange rate)
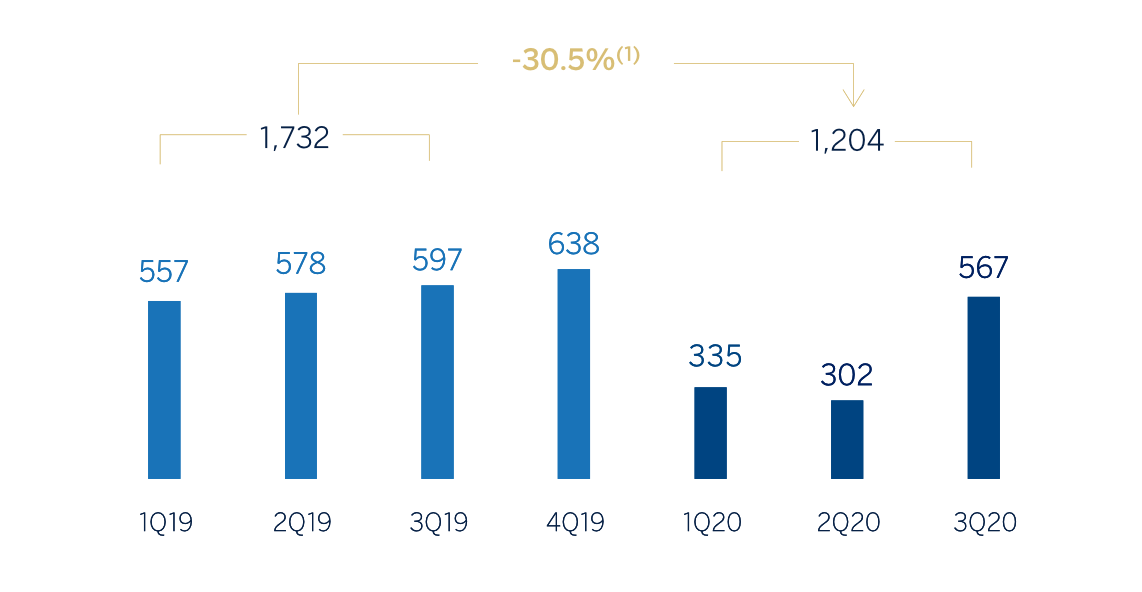
Net attributable profit
(Millions of euros at constant exchange rate)
(1) At current exchange rate: -11.8%.
(1) At current exchange rate: -38.7%.
Financial statements and relevant business indicators (Millions of euros and percentage)
| Income statement | Jan.-Sep. 20 | ∆% | ∆% (1) | Jan.-Sep. 19 |
|---|---|---|---|---|
| Net interest income | 4,036 | (12.2) | (0.4) | 4,599 |
| Net fees and commissions | 766 | (19.5) | (8.7) | 952 |
| Net trading income | 330 | 36.9 | 55.3 | 241 |
| Other operating income and expenses | 99 | (18.0) | (7.0) | 121 |
| Gross income | 5,231 | (11.5) | 0.4 | 5,912 |
| Operating expenses | (1,742) | (11.0) | 0.9 | (1,958) |
| Personnel expenses | (716) | (13.9) | (2.4) | (832) |
| Other administrative expenses | (793) | (8.5) | 3.8 | (866) |
| Depreciation | (233) | (10.4) | 1.7 | (260) |
| Operating income | 3,489 | (11.8) | 0.1 | 3,954 |
| Impairment on financial assets not measured at fair value through profit or loss | (1,749) | 41.3 | 60.3 | (1,238) |
| Provisions or reversal of provisions and other results | (48) | 238.4 | 283.9 | (14) |
| Profit/(loss) before tax | 1,692 | (37.4) | (29.0) | 2,702 |
| Income tax | (487) | (33.9) | (25.0) | (737) |
| Profit/(loss) for the year | 1,204 | (38.7) | (30.5) | 1,965 |
| Non-controlling interests | - | - | - | - |
| Net attributable profit | 1,204 | (38.7) | (30.5) | 1,965 |
| Balance sheets | 30-09-20 | ∆% | ∆% (1) | 31-12-19 |
|---|---|---|---|---|
| Cash, cash balances at central banks and other demand deposits | 7,989 | 23.1 | 51.9 | 6,489 |
| Financial assets designated at fair value | 31,938 | 1.7 | 25.5 | 31,402 |
| Of which loans and advances | 920 | 18.5 | 46.2 | 777 |
| Financial assets at amortized cost | 56,832 | (14.1) | 6.0 | 66,180 |
| Of which loans and advances to customers | 47,788 | (17.7) | 1.5 | 58,081 |
| Tangible assets | 1,538 | (24.0) | (6.2) | 2,022 |
| Other assets | 3,119 | 4.5 | 28.9 | 2,985 |
| Total assets/liabilities and equity | 101,416 | (7.0) | 14.7 | 109,079 |
| Financial liabilities held for trading and designated at fair value through profit or loss | 21,572 | (1.0) | 22.2 | 21,784 |
| Deposits from central banks and credit institutions | 3,460 | 63.4 | 101.6 | 2,117 |
| Deposits from customers | 50,770 | (9.2) | 12.0 | 55,934 |
| Debt certificates | 7,469 | (15.5) | 4.3 | 8,840 |
| Other liabilities | 13,086 | (15.7) | 4.1 | 15,514 |
| Economic capital allocated | 5,059 | 3.5 | 27.7 | 4,889 |
| Relevant business indicators | 30-09-20 | ∆% | ∆% (1) | 31-12-19 |
|---|---|---|---|---|
| Performing loans and advances to customers under management (2) | 48,681 | (17.0) | 2.5 | 58,617 |
| Non-performing loans | 1,196 | (19.1) | (0.2) | 1,478 |
| Customer deposits under management (3) | 50,432 | (8.9) | 12.5 | 55,331 |
| Off-balance sheet funds | 21,328 | (12.8) | 7.6 | 24,464 |
| Risk-weighted assets | 53,443 | (9.9) | 11.2 | 59,299 |
| Efficiency ratio (%) | 33.3 | 32.9 | ||
| NPL ratio (%) | 2.3 | 2.4 | ||
| NPL coverage ratio (%) | 170 | 136 | ||
| Cost of risk (%) | 4.27 | 3.01 |
(1) Figures at constant exchange rate.
(2) Excluding repos.
(3) Includes mutual funds, pension funds and other off-balance sheet funds.
Activity
Unless expressly stated otherwise, all the comments below on rates of change, for both activity and results, will be given at constant exchange rates. These rates, together with changes at current exchange rates, can be found in the attached tables of financial statements and relevant business indicators.
The most relevant aspects related to the area's activity during the first nine months of 2020 were:
- Lending activity (performing loans under management) increased 2.5%, supported by the 4.9% growth in the wholesale portfolio, which was driven by the strong drawdowns during the first quarter of the year to deal with the pandemic, and continues to offset the reductions in the second and third quarters. It is worth mentioning that the growth of BBVA Mexico's wholesale portfolio outperformed the market, allowing it to gain 69 basis points of market share, to reach 20.6%, in this segment over the last twelve months, according to the latest available data at the end of August 3 . The balance of the retail portfolio was in line with the December 2019 figure (up 0.3%) and the highest growth was in the mortgage portfolio (up 5.7%), as the consumer and credit card portfolios recorded lower balances, affected by the lower economic activity resulting from the pandemic.
- Improvement in terms of the asset quality indicators with respect to the end of 2019. As a result, the NPL ratio stood at 2.3% and the coverage ratio at 170%.
- Customer deposits under management increased by 12.5%, supported by the growth of both demand deposits and, to a lesser extent, time deposits. Off-balance sheet funds also performed well in the first nine months of 2020 (up 7.6%) due to a greater customer preference for these products in their search for more profitable investment alternatives.
Results
BBVA Mexico achieved a net attributable profit of €1,204m between January and September 2020, which is a 30.5% reduction compared to the same period of the previous year. This was due to the increase in the impairment on financial assets, generated by additional provisions made during the first half of the year as a result of COVID-19. In the quarter, there was a recovery in recurring income, that is, net interest income and commissions, which together increased by 11.7%. The most relevant aspects related to the income statement are summarized below:
- Net interest income closed in line with that reached between January and September 2019 (down 0.4%) since higher level of activity was partially offset by a reduction of 300 basis points in the benchmark rates over the first nine months of 2020 (75 basis points in the third quarter). Additionally, this reflects the change in the portfolio mix, with a higher percentage of wholesale customers, as well as the application of customer support programs during the first half.
- Net fees and commissions fell (down 8.7%), mainly as a result of lower fees and commissions for credit card and investment banking transactions, and an increase in transactions made through digital channels, which do not generate fees and commissions for individual customers.
- NTI continued to perform well, with a 55.3% year-on-year growth, mainly derived from the result of the Global Markets unit, as well as greater earnings from foreign exchange operations and capital gains on portfolio sales in the quarter.
- The other operating income and expenses line registered a year-on-year fall of 7.0%, as a result of a greater contribution to the Deposit Guarantee Fund due to the higher volume deposited by customers.
- Operating expenses showed a moderate growth of 0.9%, reflecting the effort to maintain strict control, despite additional expenses to ensure the health and safety of the employees and customers.
- The impairment on financial assets line increased by 60.3%, fundamentally due to the additional provisions caused by COVID-19, mainly registered in the first half of 2020, which include the deterioration in the macroeconomic scenario compared to the one originally forecasted in early 2020. With regard to payment deferrals or moratoriums, virtually all retail customer payment deferments have expired, and are showing much better than expected payment dynamics. This has resulted in an improvement in the cumulative cost of risk to September 2020, which stood at 4.27%, down from 4.95% at the end of June.
- The provisions and other results line performed unfavorably and includes greater provisions for the contingent risks arising from COVID-19.