
Turkey
Highlights
- Credit growth driven by Turkish lira loans. Strong growth in foreign currency deposits.
- Outstanding performance of recurring revenue and efficiency ratio improvement.
- Small rise in the NPL ratio year-to-date.
- Double digit growth in the main income statement margins.
Business activity (1)
(Year-on-year change at constant exchange rate. Data as of 30-09-20)
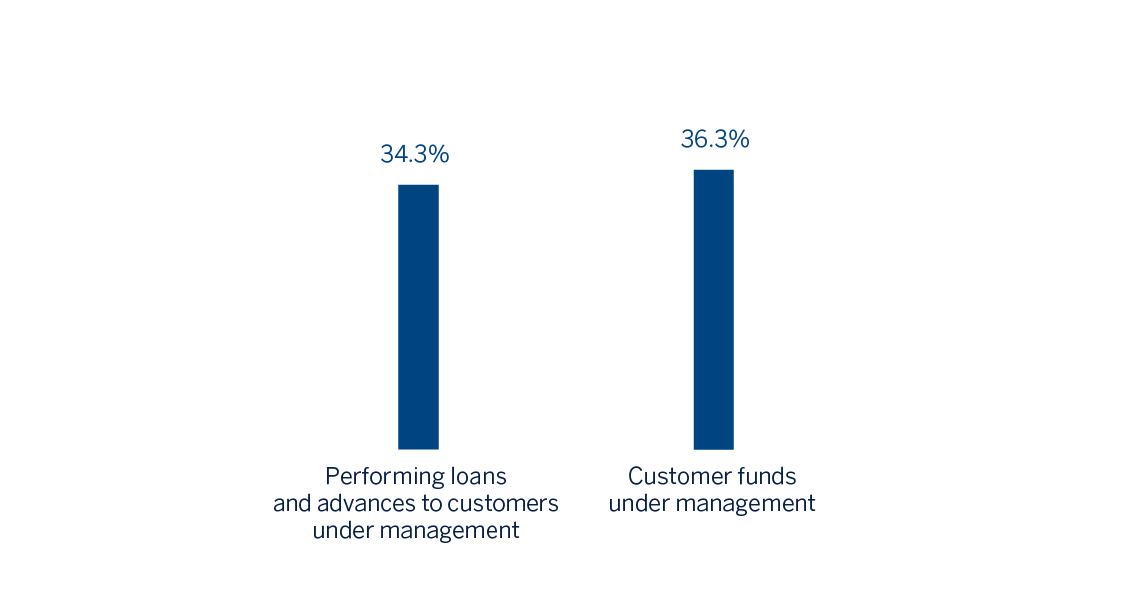
(1) Excluding repos.
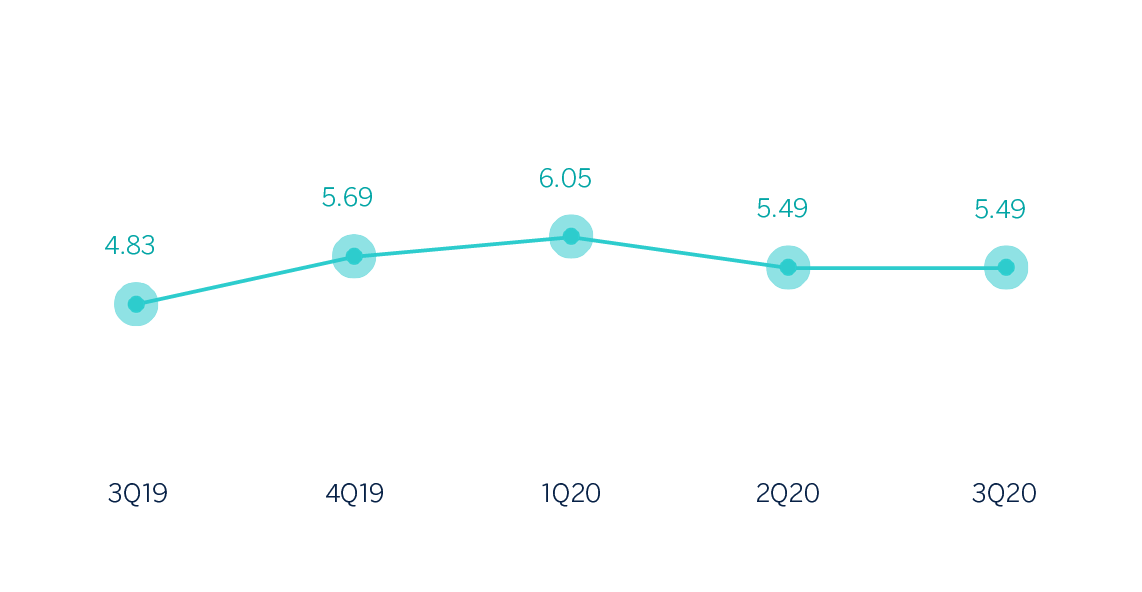
Net interest income/ATAs
(Percentage. Constant exchange rate)
Operating income
(Millions of euros at constant exchange rate)
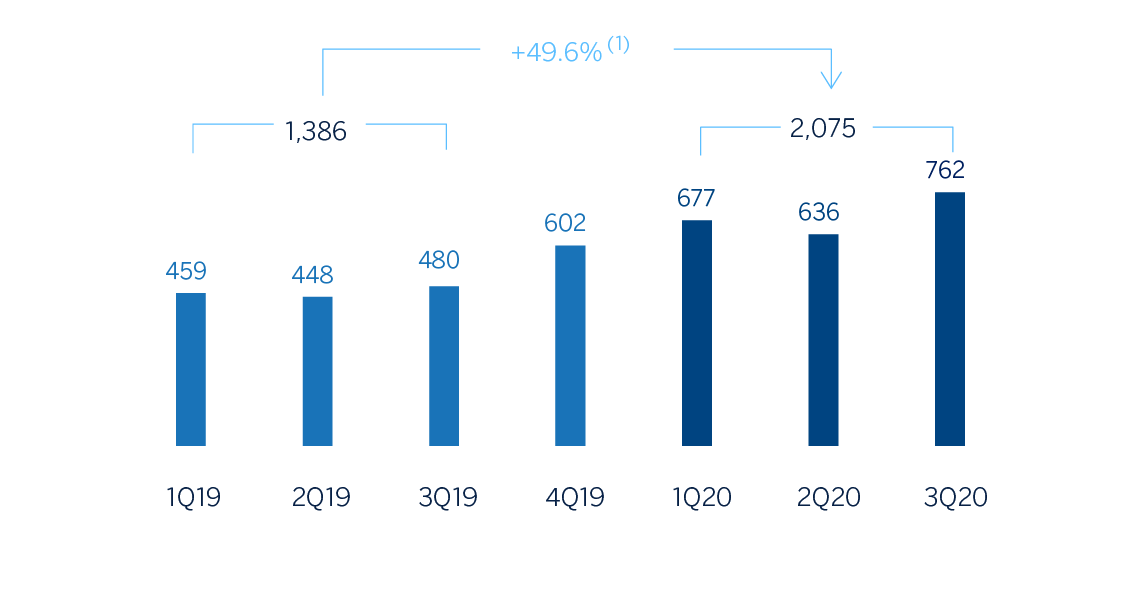
(1) At current exchange rate: +24.9%.
Net attributable profit
(Millions of euros at constant exchange rate)
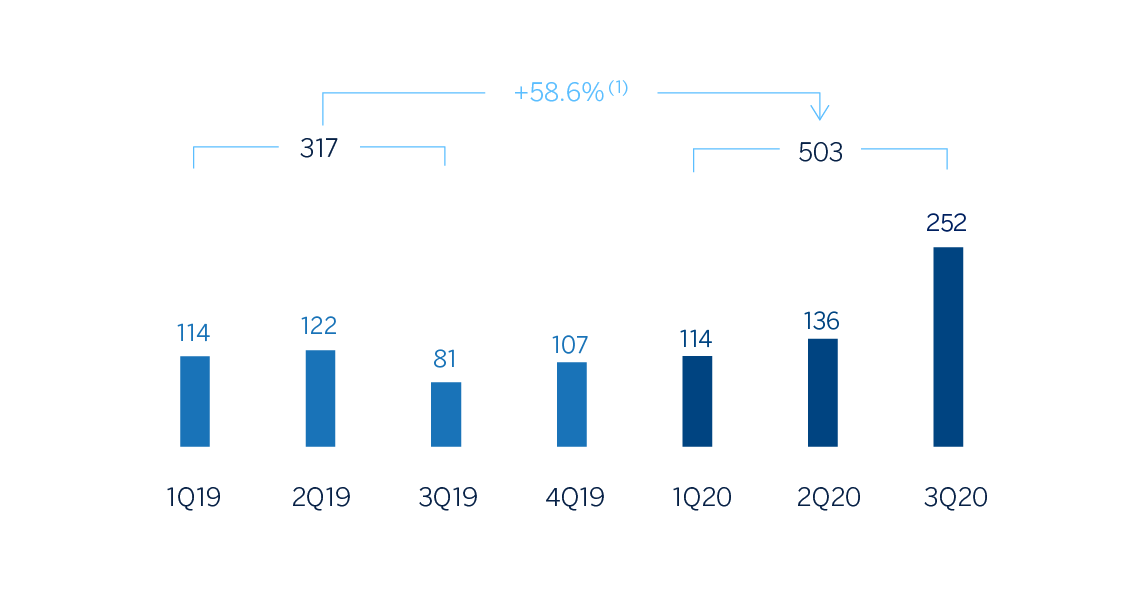
(1) At current exchange rate: +32.4%.
Financial statements and relevant business indicators (Millions of euros and percentage)
| Income statement | Jan.-Sep. 20 | ∆% | ∆% (1) | Jan.-Sep. 19 |
|---|---|---|---|---|
| Net interest income | 2,218 | 9.3 | 31.0 | 2,029 |
| Net fees and commissions | 391 | (28.5) | (14.3) | 547 |
| Net trading income | 206 | n.s. | n.s. | (65) |
| Other operating income and expenses | 51 | 38.6 | 66.1 | 37 |
| Gross income | 2,866 | 12.5 | 34.8 | 2,548 |
| Operating expenses | (792) | (10.7) | 7.0 | (886) |
| Personnel expenses | (437) | (13.7) | 3.5 | (507) |
| Other administrative expenses | (236) | (4.7) | 14.3 | (247) |
| Depreciation | (119) | (10.5) | 7.3 | (132) |
| Operating income | 2,075 | 24.9 | 49.6 | 1,661 |
| Impairment on financial assets not measured at fair value through profit or loss | (680) | 5.5 | 26.4 | (645) |
| Provisions or reversal of provisions and other results | (70) | 103.2 | 143.5 | (34) |
| Profit/(loss) before tax | 1,325 | 34.9 | 61.6 | 982 |
| Income tax | (308) | 46.8 | 76.0 | (209) |
| Profit/(loss) for the year | 1,017 | 31.6 | 57.7 | 773 |
| Non-controlling interests | (515) | 30.9 | 56.9 | (393) |
| Net attributable profit | 503 | 32.4 | 58.6 | 380 |
| Balance sheets | 30-09-20 | ∆% | ∆% (1) | 31-12-19 |
|---|---|---|---|---|
| Cash, cash balances at central banks and other demand deposits | 5,510 | 0.4 | 36.7 | 5,486 |
| Financial assets designated at fair value | 5,430 | 3.1 | 40.3 | 5,268 |
| Of which loans and advances | 434 | (2.3) | 33.0 | 444 |
| Financial assets at amortized cost | 45,251 | (11.8) | 20.1 | 51,285 |
| Of which loans and advances to customers | 36,797 | (9.1) | 23.7 | 40,500 |
| Tangible assets | 827 | (26.0) | 0.7 | 1,117 |
| Other assets | 1,110 | (11.9) | 19.9 | 1,260 |
| Total assets/liabilities and equity | 58,128 | (9.8) | 22.8 | 64,416 |
| Financial liabilities held for trading and designated at fair value through profit or loss | 2,164 | (0.9) | 34.9 | 2,184 |
| Deposits from central banks and credit institutions | 3,726 | (16.7) | 13.4 | 4,473 |
| Deposits from customers | 38,130 | (7.8) | 25.6 | 41,335 |
| Debt certificates | 3,650 | (14.5) | 16.3 | 4,271 |
| Other liabilities | 7,880 | (16.9) | 13.1 | 9,481 |
| Economic capital allocated | 2,577 | (3.6) | 31.3 | 2,672 |
| Relevant business indicators | 30-09-20 | ∆% | ∆% (1) | 31-12-19 |
|---|---|---|---|---|
| Performing loans and advances to customers under management (2) | 36,185 | (8.8) | 24.2 | 39,662 |
| Non-performing loans | 3,378 | (7.8) | 25.5 | 3,663 |
| Customer deposits under management (2) | 38,125 | (7.7) | 25.6 | 41,324 |
| Off-balance sheet funds (3) | 3,431 | (12.2) | 19.6 | 3,906 |
| Activos ponderados por riesgo | 50,131 | (11.5) | 20.5 | 56,642 |
| Efficiency ratio (%) | 27.6 | 33.8 | ||
| NPL ratio (%) | 7.1 | 7.0 | ||
| NPL coverage ratio (%) | 82 | 75 | ||
| Cost of risk (%) | 2.00 | 2.07 |
(1) Figures at constant exchange rate.
(2) Excluding repos.
(3) Includes mutual funds, pension funds and other off-balance sheet funds.
Activity
Unless expressly stated otherwise, all comments below on rates of changes for both activity and income, will be presented at constant exchange rates. These rates, together with changes at current exchange rates, can be observed in the attached tables of the financial statements and relevant business indicators.
The most relevant aspects related to the area’s activity during the first nine months of 2020 were:
- Lending activity (performing loans under management) increased by 24.2% year-to-date mainly driven by a growth in Turkish lira loans (up 26.0%) which was supported by commercial and consumer loans. Foreign-currency loans (in U.S. dollars) fell during the first nine months of 2020 (down 2.3%).
- By segments, despite remaining stable in the third quarter, Turkish lira commercial loans performed remarkably well year-to-date (up 43.7%) mainly thanks to the Credit Guarantee Fund (hereafter CGF) utilizations and short term commercial lending in the second quarter. In addition, consumer loans in Turkish lira continued growing at 22.2% year-to-date, thanks to the good origination in the third quarter mainly driven by the General Purpose Loans, auto and mortgage. Also, credit cards in Turkish lira showed significant improvement (up 13.3%) and supported lending volume in the third quarter (up 15.4%) thanks to the recovering economic activity with the steps taken towards new normal in the COVID-19 environment.
- In terms of asset quality, the NPL ratio increased slightly from December 2019 and stood at 7.1%. The NPL coverage ratio improved to 82% as of September 30, 2020.
- Customer deposits under management (66% of total liabilities in the area as of September 30, 2020) remained the main source of funding for the balance sheet and increased by 25.6% year-to-date. It is worth mentioning the positive performance of demand deposits which increased by 69.0% year-to-date and now represent 51.2% of total customer deposits, as well as the off-balance sheet funds which grew by 19.6% during the same period. Foreign currency demand deposit grew by 74.6% year-to-date, with a remarkable increase in the third quarter by 18.5% mainly due to the dollarization impact and increasing demand towards gold deposits.
Results
Turkey generated a net attributable profit of €503m in the first nine months of 2020, 58.6% higher than the same period of the previous year, with a significant increase in the quarter (up 84.8%). The most significant aspects of the year-on-year evolution in the income statement are the following:
- Net interest income grew (up 31.0%) mainly due to higher Turkish lira customer spreads and higher loan volume, which was partially offset by a lower contribution from inflation-linked bonds.
- Net fees and commissions contracted by 14.3% on a year-on-year basis, mainly due to the changes in fees regulation that came into force in March 2020 and lower activity levels due to the impact of COVID-19. On a quarterly basis, this line recorded significant growth (up 39.6%), thanks to the recovery of the economic activity with the gradual steps taken towards normalization.
- Good performance of the NTI, which contributed €206m between January and September 2020, and compares favorably with the losses of the same period of 2019. This is mainly the result of the good performance of hedging activities, foreign currency position and trading operations.
- Other income and operating expenses increased by 66.1% compared to the same period of 2019, mainly due to the positive contribution of non-financial activities (renting activity) and higher insurance activity net results.
- Operating expenses increased by 7.0%, significantly below the average inflation rate (11.5%), which is also supported by the reduction in some discretionary expenses due to COVID-19. As a result of the growth of the gross income well above the growth of expenses, the efficiency ratio continued to improve (27.6%).
- Impairment losses on financial assets increased by 26.4% due to provisions for specific clients in the commercial portfolio and, especially, to the adjustment in the macro scenario due to the negative effects of COVID-19, mainly in the first half of 2020. It is worth mentioning, in terms of year-on-year comparative, that this line registered some negative impacts from the deterioration of retail portfolio in 2019. For its part, the cumulative cost of risk at the end of September continued the downward trend and stood at 2.00% down 71 basis points during the quarter.
- The line provisions and other results closed the first nine months of 2020 with a loss of €70m and compares adversely to the loss registered the same period of the previous year, which amounted to €-34m, mainly due to higher provisions for special funds and for contingent liabilities and commitments.