Balance sheet and business activity
The most relevant aspects related to the evolution of the Group's balance sheet and business activity as of December 31, 2021 are summarized below:
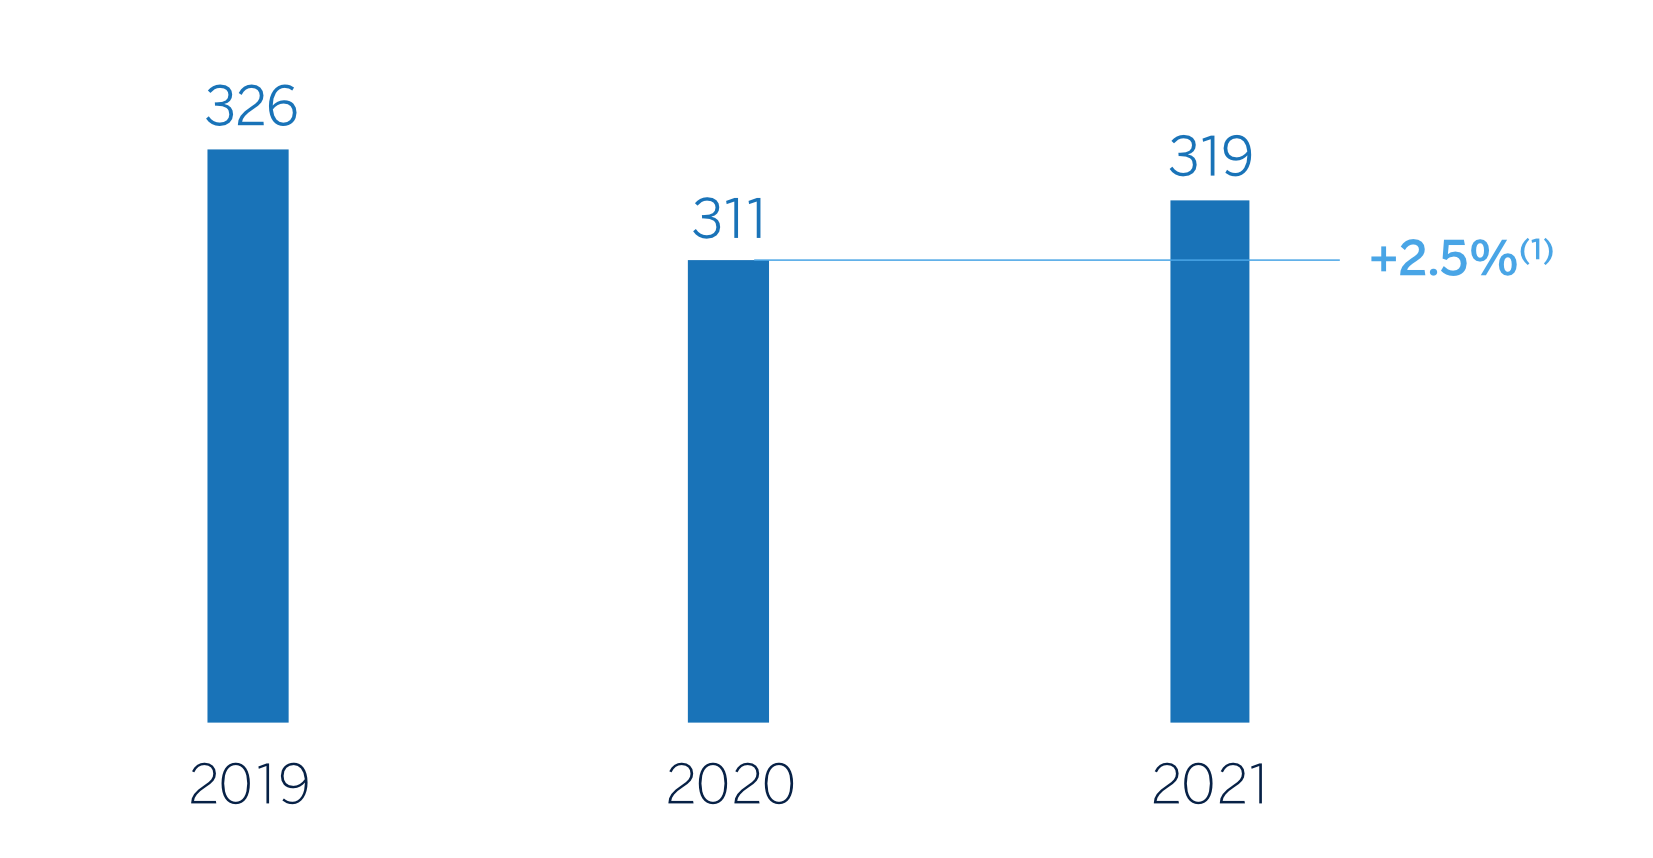
- Loans and advances to customers recorded a growth of 2.5% compared to the end of December 2020, mainly due to the performance of business loans (+3.0%) and, to a lesser extent, loans to individuals (+1.5% in the year), which were strongly supported by consumer loans and credit cards (+5.7 overall).
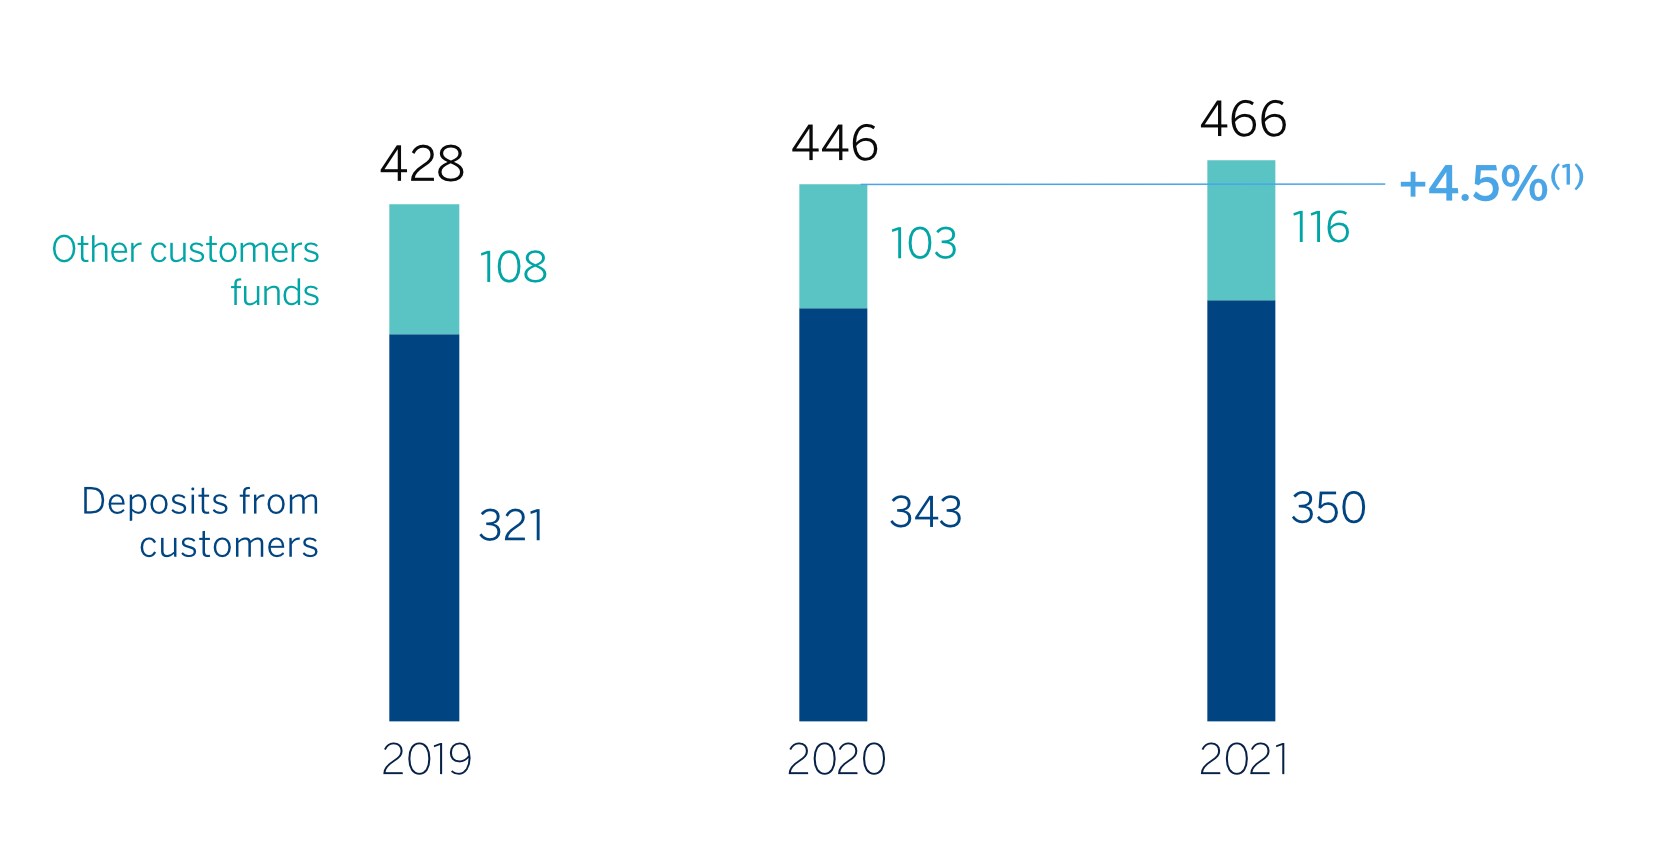
- Customer funds showed an increase of 4.5% compared to the end of December 2020, thanks to the good performance of both deposits from customers (+2.1%) and off-balance sheet funds (+12.5%). The interest rate situation has led to customers' preference for demand deposits and mutual funds (which grew by 15.3% compared to the end of the previous year) over time deposits (which decreased by 27.2% compared to December 2020), mainly in Spain, Turkey and Rest of Business. This evolution was offset by growth in demand deposits (+10.1%) in the main geographical areas, with the exception of Turkey, and growth in mutual funds (+15.3%), with Spain, Mexico and, to a lesser extent, Turkey standing out.
- The year-on-year decrease in the BBVA Group’s total assets (-9.7%) and liabilities (-10.2%) is explained by the sale of BBVA USA and the rest of the companies in the United States included in the agreement with PNC, which materialized on June 1, 2021.
CONSOLIDATED BALANCE SHEET (MILLIONS OF EUROS)
| 31-12-21 | ∆% | 31-12-20 | ||
|---|---|---|---|---|
| Cash, cash balances at central banks and other demand deposits | 67,799 | 3.5 | 65,520 | |
| Financial assets held for trading | 123,493 | 16.6 | 105,878 | |
| Non-trading financial assets mandatorily at fair value through profit or loss | 6,086 | 17.1 | 5,198 | |
| Financial assets designated at fair value through profit or loss | 1,092 | (2.2) | 1,117 | |
| Financial assets at fair value through accumulated other comprehensive income | 60,421 | (13.0) | 69,440 | |
| Financial assets at amortized cost | 372,676 | 1.4 | 367,668 | |
| Loans and advances to central banks and credit institutions | 18,957 | (8.8) | 20,784 | |
| Loans and advances to customers | 318,939 | 2.5 | 311,147 | |
| Debt securities | 34,781 | (2.7) | 35,737 | |
| Investments in subsidiaries, joint ventures and associates | 900 | (37.3) | 1,437 | |
| Tangible assets | 7,298 | (6.7) | 7,823 | |
| Intangible assets | 2,197 | (6.3) | 2,345 | |
| Other assets | 20,923 | (80.5) | 107,373 | |
| Total assets | 662,885 | (9.7) | 733,797 | |
| Financial liabilities held for trading | 91,135 | 8.4 | 84,109 | |
| Other financial liabilities designated at fair value through profit or loss | 9,683 | (3.6) | 10,050 | |
| Financial liabilities at amortized cost | 487,893 | (0.6) | 490,606 | |
| Deposits from central banks and credit institutions | 67,185 | (7.7) | 72,806 | |
| Deposits from customers | 349,761 | 2.1 | 342,661 | |
| Debt certificates | 55,763 | (9.7) | 61,780 | |
| Other financial liabilities | 15,183 | 13.7 | 13,358 | |
| Liabilities under insurance and reinsurance contracts | 10,865 | 9.2 | 9,951 | |
| Other liabilities | 14,549 | (83.7) | 89,061 | |
| Total liabilities | 614,125 | (10.2) | 683,777 | |
| Non-controlling interests | 4,853 | (11.3) | 5,471 | |
| Accumulated other comprehensive income | (16,476) | 14.8 | (14,356) | |
| Shareholders’ funds | 60,383 | 2.5 | 58,904 | |
| Total equity | 48,760 | (2.5) | 50,020 | |
| Total liabilities and equity | 662,885 | (9.7) | 733,797 | |
| Memorandum item: | ||||
| Guarantees given | 45,956 | 6.1 | 43,294 |
- General note: in 2020, the "Other assets" and "Other liabilities" figures mainly include the non-current assets and liabilities held for sale related to BBVA USA and the rest of the companies sold to PNC on June 1, 2021.
LOANS AND ADVANCES TO CUSTOMERS (MILLIONS OF EUROS)
| 31-12-21 | ∆% | 31-12-20 | |
|---|---|---|---|
| Public sector | 19,656 | 1.5 | 19,363 |
| Individuals | 146,433 | 1.5 | 144,304 |
| Mortgages | 91,324 | (0.1) | 91,428 |
| Consumer | 31,026 | 4.9 | 29,571 |
| Credit cards | 12,936 | 7.7 | 12,016 |
| Other loans | 11,146 | (1.3) | 11,289 |
| Business | 149,309 | 3.0 | 144,912 |
| Non-performing loans | 14,657 | (0.1) | 14,672 |
| Loans and advances to customers (gross) | 330,055 | 2.1 | 323,252 |
| Allowances (1) | (11,116) | (8.2) | (12,105) |
| Loans and advances to customers | 318,939 | 2.5 | 311,147 |
- (1) Allowances include the valuation adjustments for credit risk during the expected residual life of those financial instruments which have been acquired (mainly originated from the acquisition of Catalunya Banc, S.A.). As of December 31, 2021 and December 31, 2020 the remaining amount was €266m and €363m, respectively.
The evolution of loans and advances to customers and the customer funds of the BBVA Group for the years 2019, 2020 and 2021 is shown below. For a more homogeneous comparison, the balances of the entire series exclude BBVA USA and the rest of the companies in the United States sold to PNC on June 1, 2021.
LOANS AND ADVANCES TO CUSTOMERS
(BILLIONS OF EUROS)

(1) At constant exchange rates: +7.0%
CUSTOMER FUNDS
(BILLIONS OF EUROS)

(1) At constant exchange rates: +7.7%
CUSTOMER FUNDS (MILLIONS OF EUROS)
| 31-12-21 | ∆% | 31-12-20 | |
|---|---|---|---|
| Deposits from customers | 349,761 | 2.1 | 342,661 |
| Current accounts | 293,015 | 10.1 | 266,250 |
| Time deposits | 55,059 | (27.2) | 75,610 |
| Other deposits | 1,687 | 110.6 | 801 |
| Other customer funds | 115,767 | 12.5 | 102,947 |
| Mutual funds and investment companies | 74,810 | 15.3 | 64,869 |
| Pension funds | 38,763 | 7.0 | 36,215 |
| Other off-balance sheet funds | 2,195 | 17.8 | 1,863 |
| Total customer funds | 465,529 | 4.5 | 445,608 |
