

7. Risk management
7.1 General risk management and control model
The BBVA Group has an overall control and risk management model (hereinafter 'the model') tailored to their business, their organization and the geographies in which it operates, allowing them to develop their activity in accordance with their strategy and policy control and risk management defined by the governing bodies of the Bank and adapt to a changing economic and regulatory environment, tackling risk management globally and adapted to the circumstances of each instance. The model establishes a system of appropriate risk management regarding risk profile and strategy of the Group.
This model is applied comprehensively in the Group and consists of the basic elements listed below:
- Governance and organization.
- Risk appetite.
- Decisions and processes.
- Assessment, monitoring and reporting.
- Infrastructure.
The Group encourages the development of a risk culture to ensure consistent application of the control and risk management Modell in the Group, and to ensure that the risk function is understood and assimilated at all levels of the organization.
7.1.1 Governance and organization
The governance model for risk management at BBVA is characterized by a special involvement of its corporate bodies, both in setting the risk strategy and in the ongoing monitoring and supervision of its implementation.
Thus, as developed below, the corporate bodies are the ones that approve this risk strategy and corporate policies for the different types of risk, being the risk function responsible for the management, its implementation and development, reporting to the governing bodies.
The responsibility for the daily management of the risks lies on the businesses which abide in the development of their activity to the policies, standards, procedures, infrastructure and controls, based on the framework set by the governing bodies, which are defined by the function risk.
To perform this task properly, the risk function in the BBVA Group is configured as a single, comprehensive and independent role of commercial areas.
Corporate governance system
BBVA Group has developed a corporate governance system that is in line with the best international practices and adapted to the requirements of the regulators in the countries in which its different business units operate.
The Board of Directors (hereinafter also referred to as "the Board") approves the risk strategy and supervises the internal control and management systems. Specifically, the strategy approved by the Board includes, at least, the Group's Risk Appetite statement, the fundamental metrics and the basic structure of limits by geographies, types of risk and asset classes, as well as the bases of the control and risk management model. The Board ensures that the budget is in line with the approved risk appetite.
On the basis established by the Board of Directors, the Executive Committee approves specific corporate policies for each type of risk. Furthermore, the committee approves the Group's risk limits and monitors them, being informed of both limits excess occurrences and, where applicable, the appropriate corrective measures taken.
Lastly, the Board of Directors has set up a Board committee specializing in risks, the Risk Committee. This committee is responsible for analyzing and regularly monitoring risks within the remit of the corporate bodies and assists the Board and the SC in determining and monitoring the risk strategy and the corporate policies, respectively. Another task of special relevance it carries out is detailed control and monitoring of the risks that affect the Group as a whole, which enables it to supervise the effective integration of the risk strategy management and the application of corporate policies approved by the corporate bodies.
The head of the risk function in the executive hierarchy is the Group’s Chief Risk Officer (“CRO”), who carries out its functions with independence, authority, capacity and resources to do so. He is appointed by the Board of Directors of the Bank as a member of its Senior Management, and has direct access to its corporate bodies (Board of Directors, Executive Standing Committee and Risk Committee), who reports regularly on the status of risks to the Group.
The Chief Risk Officer, for the utmost performance of its functions, is supported by a cross composed set of units in corporate risk and the specific risk units in the geographical and / or business areas of the Group structure. Each of these units is headed by a Risk Officer for the geographical and/or business area who, within his/her field of competence, carries out risk management and control functions and is responsible for applying the corporate policies and rules approved at Group level in a consistent manner, adapting them if necessary to local requirements and reporting to the local corporate bodies.
The Risk Officers of the geographical and/or business areas report both to the Group's Chief Risk Officer and to the head of their geographical and/or business area. This dual reporting system aims to ensure that the local risk management function is independent from the operating functions and that it is aligned with the Group's corporate risk policies and goals.
Organizational structure and committees
The risk management function, as defined above, consists of risk units from the corporate area, which carry out cross-cutting functions, and risk units from the geographical and/or business areas.
- The corporate area's risk units develop and present the Group's risk appetite proposal, corporate policies, rules and global procedures and infrastructures to the CRO, within the action framework approved by the corporate bodies, ensure their application, and report either directly or through the CRO to the Bank's corporate bodies.
Their functions include:
- Management of the different types of risks at Group level in accordance with the strategy defined by the corporate bodies.
- Risk planning aligned with the risk appetite principles defined by the Group.
- Monitoring and control of the Group's risk profile in relation to the risk appetite approved by the Bank's corporate bodies, providing accurate and reliable information with the required frequency and in the necessary format.
- Prospective analyses to enable an evaluation of compliance with the risk appetite in stress scenarios and the analysis of risk mitigation mechanisms.
- Management of the technological and methodological developments required for implementing the Model in the Group.
- Design of the Group's Internal Risk Control model and definition of the methodology, corporate criteria and procedures for identifying and prioritizing the risk inherent in each unit's activities and processes.
- Validation of the models used and the results obtained by them in order to verify their adaptation to the different uses to which they are applied.
- The risk units in the business units develop and present to the Risk Officer of the geographical and/or business area the risk appetite proposal applicable in each geographical and/or business area, independently and always within the Group's risk appetite. They also ensure that the corporate policies and rules approved consistently at a Group level are applied, adapting them if necessary to local requirements; they are provided with appropriate infrastructures for managing and controlling their risks; and they report to their corporate bodies and/or to senior management, as appropriate.
The local risk units thus work with the corporate area risk units in order to adapt to the risk strategy at Group level and share all the information necessary for monitoring the development of their risks.
The risk function has a decision-making process to perform its functions, underpinned by a structure of committees, where the Global Risk Management Committee (GRMC) acts as the highest committee within Risk. It proposes, examines and, where applicable, approves, among others, the internal risk regulatory framework and the procedures and infrastructures needed to identify, assess, measure and manage the material risks faced by the Group in its businesses. The members of this Committee are the Group's CRO and the heads of the risk units of the corporate area and of the most representative geographical and/or business areas.
The GRMC carries out its functions assisted by various support committees which include:
- Global Technical Operations Committee: It is responsible for decision-making related to wholesale credit risk admission in certain customer segments.
- Monitoring, Assessment & Reporting Committee: It guarantees and ensures the appropriate development of aspects related to risk identification, assessment, monitoring and reporting, with an integrated and cross-cutting vision.
- Asset Allocation Committee: The executive body responsible for analysis and decision-making on all credit risk matters related to the processes intended for obtaining a balance between risk and return in accordance with the Group's risk appetite.
- Technology and Methodologies Committee: It determines the need for new models and infrastructures and channels the decision-making related to the tools needed for managing all the risks to which the Group is exposed.
- Corporate Technological Risks and Operational Control Committee: It approves the Technological Risks and Operational Control Management Frameworks in accordance with the General Risk Management Model's architecture and monitors metrics, risk profiles and operational loss events.
- Global Market Risk Unit Committee: It is responsible for formalizing, supervising and communicating the monitoring of trading desk risk in all the Global Markets business units.
- Corporate Operational and Outsourcing Risk Admission Committee: It identifies and assesses the operational risks of new businesses, new products and services, and outsourcing initiatives.
Each geographical and/or business area has its own risk management committee (or committees), with objectives and contents similar to those of the corporate area, which perform their duties consistently and in line with corporate risk policies and rules.
Under this organizational scheme, the risk management function ensures the risk strategy, the regulatory framework, and standardized risk infrastructures and controls are integrated and applied across the entire Group. It also benefits from the knowledge and proximity to customers in each geographical and/or business area, and transmits the corporate risk culture to the Group's different levels.
Internal Risk Control and Internal Validation
The Group has a specific Internal Risk Control unit whose main function is to ensure there is an adequate internal regulatory framework in place, together with a process and measures defined for each type of risk identified in the Group, (and for other types of risk that could potentially affect the Group, to oversee their application and operation, and to ensure that the risk strategy is integrated into the Group's management. The Internal Risk Control unit is independent from the units that develop risk models, manage running processes and controls. Its scope is global both geographically and in terms of type of risk.
The Director of Group Internal Control Risk is responsible for the function, and reports its activities and work plans to the CRO and the Risk Committee of the Board, besides attending to it on issues deemed necessary.
For this purpose, the Risk area also has a Technical area independent from the units that develop risk models, manage running processes and controls, which gives the Risk Committee of the Board the necessary technical support to better perform their functions.
The unit has a structure of teams at both corporate level and in the most relevant geographical areas in which the Group operates. As in the case of the corporate area, local units are independent of the business areas that execute the processes, and of the units that execute the controls. They report functionally to the Internal Risk Control unit. This unit's lines of action are established at Group level, and it is responsible for adapting and executing them locally, as well as for reporting the most relevant aspects.
Additionally, the Group has an Internal Validation unit, also independent rom the units that develop risk models and of those who use them to manage. Its functions include, among others, review and independent validation, internally, of the models used for the control and management of the Group's risks.
7.1.2 Risk appetite
The Group's risk appetite, approved by the Board of Directors, determines the risks (and their level) that the Group is willing to assume to achieve its business targets. These are expressed in terms of capital, financial structure, profitability, recurrent earnings, cost of risk or other metrics. The definition of the risk appetite has the following goals:
- To express the Group's strategy and the maximum levels of risk it is willing to assume, at both Group and geographical and/or business area level.
- To establish a set of guidelines for action and a management framework for the medium and long term that prevent actions from being taken (at both Group and geographical and/or business area level) which could compromise the future viability of the Group.
- To establish a framework for relations with the geographical and/or business areas that, while preserving their decision-making autonomy, ensures they act consistently, avoiding uneven behavior.
- To establish a common language throughout the organization and develop a compliance-oriented risk culture.
- Alignment with the new regulatory requirements, facilitating communication with regulators, investors and other stakeholders, thanks to an integrated and stable risk management framework.
Risk appetite is expressed through the following elements:
- Risk appetite statement: sets out the general principles of the Group's risk strategy and the target risk profile.
- BBVA's risk policy aims to maintain the risk profile set out in the Group's risk appetite statement, which is reflected in a series of metrics (fundamental metrics and limits).
- Fundamental metrics: they reflect, in quantitative terms, the principles and the target risk profile set out in the risk appetite statement.
- Limits: they establish the risk appetite at geographical and/or business area, legal entity and risk type level, or any other level deemed appropriate, enabling its integration into management.
The corporate risk area works with the various geographical and/or business areas to define their risk appetite, which will be coordinated with and integrated into the Group's risk appetite to ensure that its profile fits as defined.
The BBVA Group assumes a certain degree of risk to be able to provide financial services and products to its customers and obtain attractive returns for its shareholders. The organization must understand, manage and control the risks it assumes.
The aim of the organization is not to eliminate all risks faced, but to assume a prudent level of risks that allows it to generate returns while maintaining acceptable capital and fund levels and generating recurrent earnings.
The risk appetite defined by the Group expresses the levels and types of risk that the Bank is willing to assume to be able to implement its strategic plan with no relevant deviations, even in situations of stress. The risk appetite is integrated in the management and determines the basic lines of activity of the Group, because it sets the framework within the budget is developed.
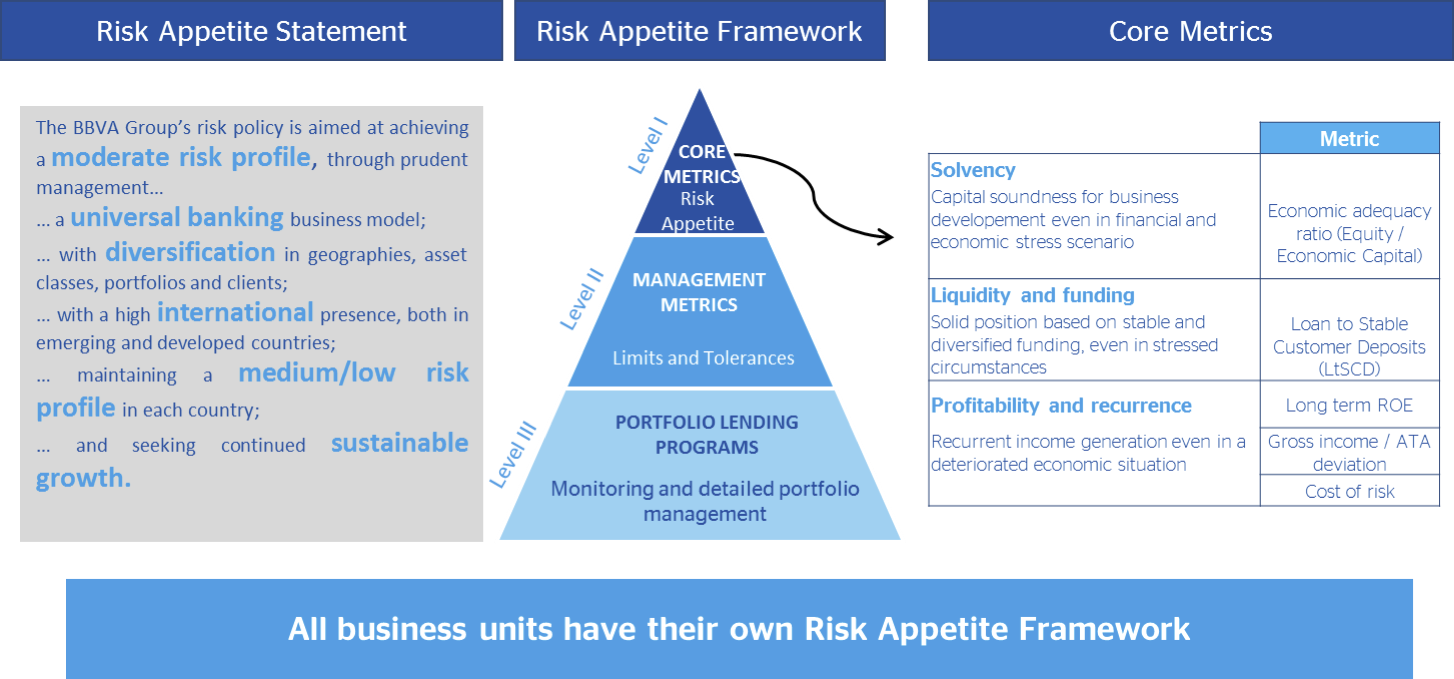
Fundamental metrics
Those metrics that characterize the Group's objective behavior (as defined in the statement), enabling the expression of the risk culture at all levels in a structured and understandable manner. They summarize the Group's goals, and are therefore useful for communication to the stakeholders.
The fundamental metrics are strategic in nature. They are disseminated throughout the Group, understandable and easy to calculate, and objectifiable at business and/or geographical area level, so they can be subject to future projections.
Limits
Limits are metrics that determine the Group’s strategic positioning for the different types of risk: credit, ALM (Asset Liability Management), liquidity, markets, operational. They differ from the fundamental metrics in the following respects:
- They are levers, not the result. They are a management tool related to a strategic positioning that must be geared toward ensuring compliance with the fundamental metrics, even in an adverse scenario.
- Risk metrics: a higher level of specialization, they do not necessarily have to be disseminated across the Group.
- Independent of the cycle: they can include metrics with little correlation with the economic cycle, thus allowing comparability that is isolated from the specific macroeconomic situation.
Thus, they are levers for remaining within the thresholds defined in the fundamental metrics and are used for day-to-day risk management. They include tolerance limits, sub-limits and alerts established at the level of business and/or geographical areas, portfolios and products. During 2015, the Risk Appetite metrics evolved in line with the set profile.
7.1.3 Decisions and processes
The transfer of risk appetite to ordinary management is supported by three basic aspects:
- A standardized set of regulations
- Risk planning
- Integrated management of risks over their life cycle
Standardized regulatory framework
The corporate GRM area is responsible for proposing the definition and development of the corporate policies, specific rules, procedures and schemes of delegation based on which risk decisions should be taken within the Group.
This process aims for the following objectives:
- Hierarchy and structure: well-structured information through a clear and simple hierarchy creating relations between documents that depend on each other.
- Simplicity: an appropriate and sufficient number of documents.
- Standardization: a standardized name and content of document.
- Accessibility: ability to search for, and easy access to, documentation through the corporate risk management library.
The approval of corporate policies for all types of risks corresponds to the corporate bodies of the Bank, while the corporate risk area endorses the remaining regulations.
Risk units of geographical and / or business areas continue to adapt to local requirements the regulatory framework for the purpose of having a decision process that is appropriate at local level and aligned with the Group policies. If such adaptation is necessary, the local risk area must inform the corporate GRM area, which must ensure the consistency of the set of regulations at the level of the entire Group, and thus must give its approval prior to any modifications proposed by the local risk areas.
Risk planning
Risk planning ensures that the risk appetite is integrated into management, through a cascade process for establishing limits, in which the function of the corporate area risk units and the geographical and/or business areas is to guarantee the alignment of this process against the Group's risk appetite.
It has tools in place that allow the risk appetite defined at aggregate level to be assigned and monitored by business areas, legal entities, types of risk, concentrations and any other level considered necessary.
The risk planning process is present within the rest of the Group's planning framework so as to ensure consistency among all of them.
Daily risk management
All risks must be managed integrally during their life cycle, and be treated differently depending on the type.
The risk management cycle is composed of 5 elements:
- Planning: with the aim of ensuring that the Group's activities are consistent with the target risk profile and guaranteeing solvency in the development of the strategy.
- Assessment: a process focused on identifying all the risks inherent to the activities carried out by the Group.
- Formalization: includes the risk origination, approval and formalization stages.
- Monitoring and reporting: continuous and structured monitoring of risks and preparation of reports for internal and/or external (market, investors, etc.) consumption.
- Active portfolio management: focused on identifying business opportunities in existing portfolios and new markets, businesses and products.
7.1.4 Assessment, monitoring and reporting
Assessment, monitoring and reporting is a cross-cutting element that should ensure that the Model has a dynamic and proactive vision to enable compliance with the risk appetite approved by the corporate bodies, even in adverse scenarios. The materialization of this process covers all the categories of material risks and has the following objectives:
- Assess compliance with the risk appetite at the present time, through monitoring of the fundamental management metrics and limits.
- Assess compliance with the risk appetite in the future, through the projection of the risk appetite variables, in both a baseline scenario determined by the budget and a risk scenario determined by the stress tests.
- Identify and assess the risk factors and scenarios that could compromise compliance with the risk appetite, through the development of a risk repository and an analysis of the impact of those risks.
- Act to mitigate the impact in the Group of the identified risk factors and scenarios, ensuring this impact remains within the target risk profile.
- Supervise the key variables that are not a direct part of the risk appetite, but that condition its compliance. These can be either external or internal.
The following phases need to be developed for undertaking this process:
- Identification of risk factors, aimed at generating a map with the most relevant risk factors that can compromise the Group's performance in relation to the thresholds defined in the risk appetite.
- Impact evaluation. This involves evaluating the impact that the materialization of one (or more) of the risk factors identified in the previous phase could have on the risk appetite metrics, through the occurrence of a given scenario.
- Response to undesired situations and realignment measures. Exceeding the parameters will trigger an analysis of the realignment measures to enable dynamic management of the situation, even before it occurs.
- Monitoring. The aim is to avoid losses before they occur by monitoring the Group's current risk profile and the identified risk factors.
- Reporting. This aims to provide information on the assumed risk profile by offering accurate, complete and reliable data to the corporate bodies and to senior management, with the frequency and completeness appropriate to the nature, significance and complexity of the risks.
7.1.5 Infrastructure
The infrastructure is an element that must ensure that the Group has the human and technological resources needed for effective management and supervision of risks in order to carry out the functions set out in the Group's risk Model and the achievement of their objectives.
With respect to human resources, the Group's risk function will have an adequate workforce, in terms of number, skills and experience.
With regards to technology, the Group ensures the integrity of management information systems and the provision of the infrastructure needed for supporting risk management, including tools appropriate to the needs arising from the different types of risks for their admission, management, assessment and monitoring.
The principles that govern the Group risk technology are:
- Standardization: the criteria are consistent across the Group, thus ensuring that risk handling is standardized at geographical and/or business area level.
- Integration in management: the tools incorporate the corporate risk policies and are applied in the Group's day-to-day management.
- Automation of the main processes making up the risk management cycle.
- Appropriateness: provision of adequate information at the right time.
Through the “Risk Analytics” function, the Group has a corporate framework in place for developing the measurement techniques and models. It covers all the types of risks and the different purposes and uses a standard language for all the activities and geographical/business areas and decentralized execution to make the most of the Group's global reach. The aim is to continually evolve the existing risk models and generate others that cover the new areas of the businesses that develop them, so as to reinforce the anticipation and proactiveness that characterize the Group's risk function.
Also the risk units of geographical and / or business areas shall ensure that they have sufficient means from the point of view of resources, structures and tools to develop a risk management in line with the corporate model.
7.1.6 Risk culture
BBVA considers risk culture to be an essential element for consolidating and integrating the other components of the Model. The culture transfers the implications that are involved in the Group's activities and businesses to all the levels of the organization. The risk culture is organized through a number of levers, including the following:
- Communication: promotes the dissemination of the Model, and in particular the principles that must govern risk management in the Group, in a consistent and integrated manner across the organization, through the most appropriate channels.
GRM has a number of communication channels to facilitate the transmission of information and knowledge among the various teams in the function and the Group, adapting the frequency, formats and recipients based on the proposed goal, in order to strengthen the basic principles of the risk function. The risk culture and the management model thus emanate from the Group's corporate bodies and senior management and are transmitted throughout the organization.
- Training: its main aim is to disseminate and establish the model of risk management across the organization, ensuring standards in the skills and knowledge of the different persons involved in the risk management processes.
Well defined and implemented training ensures continuous improvement of the skills and knowledge of the Group's professionals, and in particular of the GRM area, and is based on four aspects that aim to develop each of the needs of the GRM group by increasing its knowledge and skills in different fields such as: finance and risks, tools and technology, management and skills, and languages.
- Motivation: the aim in this area is for the incentives of the risk function teams to support the strategy for managing those teams and the function's values and culture at all levels. Includes compensation and all those elements related to motivation – working environment, etc. which contribute to the achievement Model objectives.
7.2 Risk events
As mentioned earlier, BBVA has processes in place for identifying risks and analyzing scenarios that enable the Group to manage risks in a dynamic and proactive way.
The risk identification processes are forward looking to ensure the identification of emerging risks and take into account the concerns of both the business areas, which are close to the reality of the different geographical areas, and the corporate areas and senior management.
Risks are captured and measured consistently using the methodologies deemed appropriate in each case. Their measurement includes the design and application of scenario analyses and stress testing and considers the controls to which the risks are subjected.
As part of this process, a forward projection of the risk appetite variables in stress scenarios is conducted in order to identify possible deviations from the established thresholds. If any such deviations are detected, appropriate measures are taken to keep the variables within the target risk profile.
To this extent, there are a number of emerging risks that could affect the Group’s business trends. These risks are described in the following main blocks:
- Macroeconomic and geopolitical risks
- The increased economic slowdown in China's economy and its impact on other emerging economies through energy prices and raw materials, along with possible difficulties in the European economic recovery meant key points for the Group.
- In addition, financial institutions are exposed to the risks of political and social instability in the countries in which they operate, which can have significant effects on their economies and even regionally.
In this regard the Group's geographical diversification is a key to achieving a high level of recurring revenues, despite environmental conditions and economic cycles of the economies in which it operates.
- Regulatory, legal, tax and reputational risks
- Financial institutions are exposed to a complex and ever-changing regulatory and legal environment defined by governments and regulators. This can affect their ability to grow and the capacity of certain businesses to develop, and result in stricter liquidity and capital requirements with lower profitability ratios. The Group constantly monitors changes in the regulatory framework that allow for anticipation and adaptation to them in a timely manner, adopt best practices and more efficient and rigorous criteria in its implementation.
- The financial sector is under ever closer scrutiny by regulators, governments and society itself. Negative news or inappropriate behavior can significantly damage the Group's reputation and affect its ability to develop a sustainable business. The attitudes and behaviors of the group and its members are governed by the principles of integrity, honesty, long-term vision and best practices through, inter alia, internal control Model, the Code of Conduct, tax strategy and Responsible Business Strategy of the Group.
- The financial sector is exposed to increasing litigation, so the financial institutions are having to face a large number of proceedings whose economic consequences are difficult to determine. The Group manages and monitors these proceedings to defend its interests, where necessary allocating the corresponding provisions to cover them, following the expert criteria of internal lawyers and external attorneys responsible for the legal handling of the procedures, in accordance with applicable legislation.
- Business and operational risks
- New technologies and forms of customer relationships: Developments in the digital world and in information technologies pose significant challenges for financial institutions, entailing threats (new competitors, disintermediation…) but also opportunities (new framework of relations with customers, greater ability to adapt to their needs, new products and distribution channels...). Digital transformation is a priority for the Group as it aims to lead digital banking of the future as one of its objectives.
- Technological risks and security breaches: The Group is exposed to new threats such as cyber-attacks, theft of internal and customer databases, fraud in payment systems, etc. that require major investments in security from both the technological and human point of view. The Group gives great importance to the active operational and technological risk management and control. One example was the early adoption of advanced models for management of these risks (AMA - Advanced Measurement Approach).
7.3 Credit risk
Credit risk arises from the probability that one party to a financial instrument will fail to meet its contractual obligations for reasons of insolvency or inability to pay and cause a financial loss for the other party.
It is the most important risk for the Group and includes counterparty risk, issuer risk, settlement risk and country risk management.
The principles underpinning credit risk management in BBVA are as follows:
- Availability of basic information for the study and proposal of risk, and supporting documentation for approval, which sets out the conditions required by the internal relevant body.
- Sufficient generation of funds and asset solvency of the customer to assume principal and interest repayments of loans owed.
- Establishment of adequate and sufficient guarantees that allow effective recovery of the operation, this being considered a secondary and exceptional method of recovery when the first has failed.
Credit risk management in the Group has an integrated structure for all its functions, allowing decisions to be taken objectively and independently throughout the life cycle of the risk.
- At Group level: frameworks for action and standard rules of conduct are defined for handling risk, specifically, the circuits, procedures, structure and supervision.
- At the business area level: they are responsible for adapting the Group's criteria to the local realities of each geographical area and for direct management of risk according to the decision-making circuit:
- Retail risks: in general, the decisions are formalized according to the scoring tools, within the general framework for action of each business area with regard to risks. The changes in weighting and variables of these tools must be validated by the corporate GRM area.
- Wholesale risks: in general, the decisions are formalized by each business area within its general framework for action with regard to risks, which incorporates the delegation rule and the Group's corporate policies.
7.3.1 Credit risk exposure
In accordance with IFRS 7, “Financial Instruments: Disclosures” the BBVA Group’s maximum credit risk exposure (see definition below) by headings in the balance sheets as of December 31, 2015, 2014 and 2013 is provided below. It does not consider the availability of collateral or other credit enhancements to guarantee compliance with payment obligations. The details are broken down by financial instruments and counterparties.
 Download Excel
| Maximum Credit Risk Exposure | Millions of euros | |||
|---|---|---|---|---|
| Notes | 2015 | 2014 | 2013 | |
| Financial assets held for trading |
|
37,424 | 39,028 | 34,473 |
| Debt securities | 10 | 32,826 | 33,883 | 29,601 |
| Government |
|
29,454 | 28,212 | 24,696 |
| Credit institutions |
|
1,766 | 3,048 | 2,734 |
| Other sectors |
|
1,606 | 2,623 | 2,172 |
| Equity instruments |
|
4,534 | 5,017 | 4,766 |
| Customer lending |
|
65 | 128 | 107 |
| Other financial assets designated at fair value through profit or loss |
|
2,311 | 2,761 | 2,413 |
| Loans and advances to credit institutions |
|
62 | - | - |
| Debt securities | 11 | 173 | 737 | 663 |
| Government |
|
132 | 141 | 142 |
| Credit institutions |
|
29 | 16 | 16 |
| Other sectors |
|
11 | 580 | 506 |
| Equity instruments |
|
2,075 | 2,024 | 1,750 |
| Available-for-sale financial assets |
|
113,710 | 95,049 | 77,972 |
| Debt securities | 12 | 108,448 | 87,679 | 71,861 |
| Government |
|
81,579 | 63,764 | 48,728 |
| Credit institutions |
|
8,069 | 7,377 | 10,431 |
| Other sectors |
|
18,800 | 16,538 | 12,702 |
| Equity instruments |
|
5,262 | 7,370 | 6,111 |
| Loans and receivables |
|
476,396 | 386,653 | 365,941 |
| Loans and advances to credit institutions | 13.1 | 33,014 | 27,089 | 22,902 |
| Loans and advances to customers | 13.2 | 432,856 | 352,900 | 338,558 |
| Government |
|
38,611 | 37,113 | 32,601 |
| Agriculture |
|
4,315 | 4,348 | 5,008 |
| Industry |
|
56,913 | 37,580 | 28,829 |
| Real estate and construction |
|
38,964 | 33,152 | 40,699 |
| Trade and finance |
|
43,576 | 43,880 | 47,417 |
| Loans to individuals |
|
194,288 | 158,586 | 150,678 |
| Other |
|
56,188 | 38,242 | 33,325 |
| Debt securities | 13.3 | 10,526 | 6,663 | 4,481 |
| Government |
|
3,275 | 5,608 | 3,175 |
| Credit institutions |
|
125 | 81 | 297 |
| Other sectors |
|
7,126 | 975 | 1,009 |
| Derivatives (trading and hedging) |
|
49,350 | 47,248 | 41,294 |
| Total Financial Assets Risk |
|
679,193 | 570,739 | 522,093 |
| Financial guarantees (Bank guarantees, letter of credits,..) |
|
49,876 | 33,741 | 33,543 |
| Drawable by third parties |
|
123,620 | 96,714 | 87,542 |
| Government |
|
2,570 | 1,359 | 4,354 |
| Credit institutions |
|
921 | 1,057 | 1,583 |
| Other sectors |
|
120,129 | 94,299 | 81,605 |
| Other contingent commitments |
|
12,113 | 9,537 | 6,628 |
| Total Contingent Risks and Commitments | 32 | 185,609 | 139,993 | 127,712 |
| Total Maximum Credit Exposure |
|
864,802 | 710,732 | 649,805 |
The maximum credit exposure presented in the table above is determined by type of financial asset as explained below:
- In the case of financial assets recognized in the consolidated balance sheets, exposure to credit risk is considered equal to its carrying amount (not including impairment losses), with the sole exception of trading and hedging derivatives.
- The maximum credit risk exposure on financial guarantees granted is the maximum that the Group would be liable for if these guarantees were called in, and that is their carrying amount.
- Our calculation of risk exposure for derivatives is based on the sum of two factors: the derivatives fair value and their potential risk (or "add-on").
- The first factor, market value, reflects the difference between original commitments and market values on the reporting date (mark-to-market). As indicated in Note 2.2.1, derivatives are accounted for as of each reporting date at fair value in accordance with IAS 39.
- The second factor, potential risk (‘add-on’), is an estimate of the maximum increase to be expected on risk exposure over a derivative market value (at a given statistical confidence level) as a result of future changes in the fair value over the remaining term of the derivatives.
The consideration of the potential risk ("add-on") relates the risk exposure to the exposure level at the time of a customer’s default. The exposure level will depend on the customer’s credit quality and the type of transaction with such customer. Given the fact that default is an uncertain event which might occur any time during the life of a contract, the BBVA Group has to consider not only the credit exposure of the derivatives on the reporting date, but also the potential changes in exposure during the life of the contract. This is especially important for derivatives, whose valuation changes substantially throughout their terms, depending on the fluctuation of market prices.
7.3.2 Mitigation of credit risk, collateralized credit risk and other credit enhancements
In most cases, maximum credit risk exposure is reduced by collateral, credit enhancements and other actions which mitigate the Group’s exposure. The BBVA Group applies a credit risk hedging and mitigation policy deriving from a banking approach focused on relationship banking. The existence of guarantees could be a necessary but not sufficient instrument for accepting risks, as the assumption of risks by the Group requires prior evaluation of the debtor’s capacity for repayment, or that the debtor can generate sufficient resources to allow the amortization of the risk incurred under the agreed terms.
The policy of accepting risks is therefore organized into three different levels in the BBVA Group:
- Analysis of the financial risk of the operation, based on the debtor’s capacity for repayment or generation of funds;
- The constitution of guarantees that are adequate, or at any rate generally accepted, for the risk assumed, in any of the generally accepted forms: monetary, secured, personal or hedge guarantees; and finally,
- Assessment of the repayment risk (asset liquidity) of the guarantees received.
The procedures for the management and valuation of collaterals are set out in the Corporate Policies (retail and wholesale), which establish the basic principles for credit risk management, including the management of collaterals assigned in transactions with customers.
The methods used to value the collateral are in line with the best market practices and imply the use of appraisal of real-estate collateral, the market price in market securities, the trading price of shares in mutual funds, etc. All the collaterals assigned must be properly drawn up and entered in the corresponding register. They must also have the approval of the Group’s legal units.
The following is a description of the main types of collateral for each financial instrument class:
- Financial instruments held for trading: The guarantees or credit enhancements obtained directly from the issuer or counterparty are implicit in the clauses of the instrument.
- Trading and hedging derivatives: In derivatives, credit risk is minimized through contractual netting agreements, where positive- and negative-value derivatives with the same counterparty are offset for their net balance. There may likewise be other kinds of guarantees, depending on counterparty solvency and the nature of the transaction.
- Other financial assets designated at fair value through profit or loss and Available-for-sale financial assets: The guarantees or credit enhancements obtained directly from the issuer or counterparty are inherent to the structure of the instrument.
- Loans and receivables:
- Loans and advances to credit institutions: These usually only have the counterparty’s personal guarantee.
- Loans and advances to customers: Most of these loans and advances are backed by personal guarantees extended by the own customer. There may also be collateral to secure loans and advances to customers (such as mortgages, cash collaterals, pledged securities and other collateral), or to obtain other credit enhancements (bonds, hedging, etc.).
- Debt securities: The guarantees or credit enhancements obtained directly from the issuer or counterparty are inherent to the structure of the instrument.
Collateralized loans granted by the Group as of December 31, 2015, 2014 and 2013 excluding balances deemed impaired, is broken down in the table below:
Download Excel
| Collateralized Credit Risk |
|
Millions of euros | ||
|---|---|---|---|---|
| Notes | 2015 | 2014 | 2013 | |
| Mortgage loans | 13.2 | 144,203 | 124,097 | 125,564 |
| Operating assets mortgage loans |
|
6,813 | 4,062 | 3,778 |
| Home mortgages |
|
120,164 | 109,031 | 108,745 |
| Rest of mortgages |
|
17,226 | 11,005 | 13,041 |
| Secured loans, except mortgage | 13.2 | 57,041 | 28,419 | 23,660 |
| Cash guarantees |
|
479 | 468 | 300 |
| Secured loan (pledged securities) |
|
734 | 518 | 570 |
| Rest of secured loans (*) |
|
55,828 | 27,433 | 22,790 |
| Total |
|
201,244 | 152,517 | 149,224 |
- Financial guarantees, other contingent risks and drawable by third parties: These have the counterparty’s personal guarantee.
7.3.3 Financial instrument netting
Financial assets and liabilities may be netted, i.e. they are presented for a net amount on the consolidated balance sheet only when the Group's entities satisfy with the provisions of IAS 32-Paragraph 42, so they have both the legal right to net recognized amounts, and the intention of settling the net amount or of realizing the asset and simultaneously paying the liability.
In addition, the Group has presented as gross amounts assets and liabilities on the consolidated balance sheet for which there are master netting arrangements in place, but for which there is no intention of settling net. The most common types of events that trigger the netting of reciprocal obligations are bankruptcy of the entity, surpassing certain level of indebtedness threshold, failure to pay, restructuring and dissolution of the entity.
In the current market context, derivatives are contracted under different framework contracts being the most widespread developed by the International Swaps and Derivatives Association (“ISDA”) and, for the Spanish market, the Framework Agreement on Financial Transactions (“CMOF”). Almost all portfolio derivative transactions have been concluded under these framework contracts, including in them the netting clauses mentioned in the preceding paragraph as "Master Netting Agreement", greatly reducing the credit exposure on these instruments. Additionally, in contracts signed with professional counterparts, the collateral agreement annexes called Credit Support Annex (“CSA”) are included, thereby minimizing exposure to a potential default of the counterparty.
Moreover, in transactions involving assets purchased or sold under a purchase agreement there has greatly increased the volume transacted through clearing houses that articulate mechanisms to reduce counterparty risk, as well as through the signature of various master agreements for bilateral transactions, the most widely used being the Global Master Repurchase Agreement (GMRA), published by International Capital Market Association (“ICMA”), to which the clauses related to the collateral exchange are usually added within the text of the master agreement itself.
A summary of the effect of the compensation (via netting and collateral) for derivatives and securities operations is presented below as of December 31, 2015:
Download Excel
|
|
Millions of euros | ||||||
|---|---|---|---|---|---|---|---|
|
|
|
|
|
Gross Amounts Not Offset in the Condensed Consolidated Balance Sheets (D) |
|
||
| December 2015 | Notes | Gross Amounts Recognized (A) | Gross Amounts Offset in the Condensed Consolidated Balance Sheets (B) | Net Amount Presented in the Condensed Consolidated Balance Sheets (C=A-B) | Financial Instruments | Cash Collateral Received/ Pledged | Net Amount (E=C-D) |
| Derivative financial assets | 10, 14 | 52,244 | 7,805 | 44,439 | 30,350 | 5,493 | 8,597 |
| Reverse repurchase, securities borrowing and similar agreements | 34 | 21,531 | 4,596 | 16,935 | 17,313 | 24 | (402) |
| Total Assets |
|
73,775 | 12,401 | 61,374 | 47,663 | 5,517 | 8,195 |
|
|
|
|
|
|
|
|
|
| Derivative financial liabilities | 10, 14 | 53,298 | 8,423 | 44,876 | 30,350 | 9,830 | 4,696 |
| Repurchase, securities lending and similar agreements | 34 | 72,998 | 4,596 | 68,402 | 68,783 | 114 | (495) |
| Total Liabillities |
|
126,296 | 13,019 | 113,278 | 99,133 | 9,944 | 4,201 |
7.3.4 Risk concentration
Policies for preventing excessive risk concentration
In order to prevent the build-up of excessive concentrations of credit risk at the individual, country and sector levels, BBVA Group maintains maximum permitted risk concentration indices updated at individual and portfolio sector levels tied to the various observable variables within the field of credit risk management. The limit on the Group’s exposure or financial commitment to a specific customer therefore depends on the customer’s credit rating, the nature of the risks involved, and the Group’s presence in a given market, based on the following guidelines:
- The aim is, as much as possible, to reconcile the customer's credit needs (commercial/financial, short-term/long-term, etc.) with the interests of the Group.
- Any legal limits that may exist concerning risk concentration are taken into account (relationship between risks with a customer and the capital of the entity that assumes them), the markets, the macroeconomic situation, etc.
Risk concentrations by geography
Below is a breakdown of the balances of financial instruments registered in the accompanying consolidated balance sheets by their concentration in geographical areas and according to the residence of the customer or counterparty. It does not take into account valuation adjustments, impairment losses or loan-loss provisions:
Download Excel
| Risks by Geographical Areas December 2015 |
Millions of euros | |||||||
|---|---|---|---|---|---|---|---|---|
| Spain | Europe, Excluding Spain | Mexico | USA | Turkey | South America | Rest | Total | |
| Financial assets - |
|
|
|
|
|
|
|
|
| Financial assets held for trading | 17,726 | 30,701 | 16,866 | 7,095 | 220 | 3,977 | 1,743 | 78,327 |
| Loans and advances to customers | - | - | - | 65 | - | - | - | 65 |
| Debt securities | 8,037 | 5,491 | 13,032 | 4,072 | 48 | 1,975 | 169 | 32,825 |
| Equity instruments (*) | 2,038 | 1,546 | 411 | 231 | 32 | 137 | 139 | 4,534 |
| Derivatives | 7,651 | 23,663 | 3,422 | 2,727 | 140 | 1,865 | 1,434 | 40,902 |
| Other financial assets designated at fair value through profit or loss | 243 | 168 | 1,885 | 3 | 9 | 2 | - | 2,311 |
| Loans and advances to credit institutions | 53 | - | - | - | 9 | - | - | 62 |
| Debt securities | 106 | 55 | 9 | 3 | - | - | - | 173 |
| Equity instruments (*) | 84 | 113 | 1,876 | - | - | 2 | - | 2,075 |
| Available-for-sale portfolio | 48,506 | 16,572 | 12,580 | 13,517 | 12,824 | 5,593 | 3,323 | 112,914 |
| Debt securities | 45,567 | 15,956 | 12,539 | 13,484 | 12,738 | 5,168 | 2,346 | 107,797 |
| Equity instruments (*) | 2,939 | 425 | 41 | 617 | 33 | 86 | 977 | 5,116 |
| Loans and receivables | 207,135 | 35,655 | 57,281 | 62,664 | 55,652 | 50,286 | 5,620 | 474,293 |
| Loans and advances to credit institutions | 3,732 | 15,114 | 5,108 | 4,065 | 1,930 | 1,950 | 1,047 | 32,947 |
| Loans and advances to customers | 194,536 | 20,500 | 52,173 | 57,553 | 53,461 | 48,032 | 4,553 | 430,808 |
| Debt securities | 8,866 | 40 | - | 1,046 | 261 | 304 | 20 | 10,538 |
| Held-to-maturity investments | - | - | - | - | - | - | - | - |
| Hedging derivatives and macrohedging adjustments | 1,173 | 1,397 | 702 | 61 | 214 | 36 | 1 | 3,583 |
| Total Risk in Financial Assets | 274,783 | 84,492 | 89,313 | 83,340 | 68,918 | 59,894 | 10,686 | 671,427 |
| Contingent risks and liabilities |
|
|
|
|
|
|
|
|
| Contingent risks | 15,500 | 10,544 | 1,270 | 3,995 | 11,193 | 5,517 | 1,856 | 49,876 |
| Contingent liabilities | 34,861 | 23,537 | 22,569 | 33,070 | 14,135 | 6,486 | 1,075 | 135,733 |
| Total Contingent Risk | 50,361 | 34,081 | 23,839 | 37,065 | 25,328 | 12,003 | 2,931 | 185,609 |
| Total Risks in Financial Instruments | 325,145 | 118,573 | 113,152 | 120,405 | 94,246 | 71,897 | 13,617 | 857,036 |
Download Excel
| Risks by Geographical Areas December 2014 |
Millions of euros | ||||||
|---|---|---|---|---|---|---|---|
| Spain | Europe, Excluding Spain | Mexico | USA | South America | Rest | Total | |
| Financial assets - |
|
|
|
|
|
|
|
| Financial assets held for trading | 17,461 | 36,039 | 17,091 | 6,126 | 4,337 | 2,206 | 83,258 |
| Loans and advances to customers | - | - | - | 128 | - | - | 128 |
| Debt securities | 7,816 | 6,512 | 13,747 | 2,654 | 2,656 | 499 | 33,883 |
| Equity instruments (*) | 2,541 | 1,334 | 342 | 457 | 171 | 172 | 5,017 |
| Derivatives | 7,103 | 28,193 | 3,003 | 2,886 | 1,510 | 1,535 | 44,229 |
| Other financial assets designated at fair value through profit or loss |
189 | 152 | 1,836 | 581 | 3 | - | 2,761 |
| Loans and advances to credit institutions | - | - | - | - | - | - | - |
| Debt securities | 94 | 62 | - | 581 | - | - | 737 |
| Equity instruments (*) | 95 | 90 | 1,836 | - | 3 | - | 2,024 |
| Available-for-sale portfolio | 45,465 | 13,673 | 13,169 | 10,780 | 6,079 | 4,958 | 94,125 |
| Debt securities | 42,267 | 13,348 | 13,119 | 10,222 | 5,973 | 1,929 | 86,858 |
| Equity instruments (*) | 3,198 | 326 | 50 | 558 | 106 | 3,029 | 7,267 |
| Loans and receivables | 185,924 | 31,597 | 52,157 | 52,080 | 57,911 | 4,792 | 384,460 |
| Loans and advances to credit institutions | 4,172 | 13,313 | 2,497 | 3,521 | 2,180 | 1,291 | 26,975 |
| Loans and advances to customers | 178,735 | 18,274 | 49,660 | 47,635 | 53,018 | 3,501 | 350,822 |
| Debt securities | 3,017 | 9 | - | 924 | 2,713 | - | 6,663 |
| Held-to-maturity investments | - | - | - | - | - | - | - |
| Hedging derivatives and macrohedging adjustments | 708 | 1,699 | 182 | 66 | 14 | 2 | 2,672 |
| Total Risk in Financial Assets | 249,747 | 83,160 | 84,435 | 69,633 | 68,344 | 11,958 | 567,276 |
| Contingent risks and liabilities |
|
|
|
|
|
|
|
| Contingent risks | 13,500 | 8,454 | 1,220 | 3,161 | 5,756 | 1,650 | 33,741 |
| Contingent liabilities | 25,577 | 22,973 | 19,751 | 29,519 | 7,343 | 1,087 | 106,251 |
| Total Contingent Risk | 39,077 | 31,427 | 20,971 | 32,680 | 13,099 | 2,738 | 139,993 |
| Total Risks in Financial Instruments | 288,824 | 114,587 | 105,406 | 102,313 | 81,443 | 14,696 | 707,268 |
Download Excel
| Risks by Geographical Areas December 2013 |
Millions of euros | ||||||
|---|---|---|---|---|---|---|---|
| Spain | Europe, Excluding Spain | Mexico | USA | South America | Rest | Total | |
| Financial assets - |
|
|
|
|
|
|
|
| Financial assets held for trading | 14,882 | 33,091 | 15,707 | 2,677 | 3,412 | 2,345 | 72,114 |
| Loans and advances to customers | - | - | - | 107 | - | - | 107 |
| Debt securities | 6,320 | 5,838 | 13,410 | 424 | 2,608 | 1,002 | 29,602 |
| Equity instruments (*) | 2,752 | 953 | 632 | 118 | 148 | 163 | 4,766 |
| Derivatives | 5,810 | 26,300 | 1,665 | 2,028 | 656 | 1,180 | 37,639 |
| Other financial assets designated at fair value through profit or loss | 211 | 106 | 1,591 | 503 | 2 | - | 2,413 |
| Loans and advances to credit institutions | - | - | - | - | - | - | - |
| Debt securities | 107 | 54 | 5 | 497 | - | - | 663 |
| Equity instruments (*) | 104 | 52 | 1,586 | 6 | 2 | - | 1,750 |
| Available-for-sale portfolio | 42,074 | 8,587 | 10,380 | 7,729 | 5,626 | 3,011 | 77,407 |
| Debt securities | 38,732 | 8,453 | 10,329 | 7,247 | 5,535 | 1,143 | 71,439 |
| Equity instruments (*) | 3,342 | 134 | 51 | 482 | 91 | 1,868 | 5,968 |
| Loans and receivables | 194,383 | 26,712 | 44,414 | 39,650 | 53,886 | 4,984 | 364,031 |
| Loans and advances to credit institutions | 5,224 | 9,171 | 2,366 | 2,707 | 1,909 | 1,415 | 22,792 |
| Loans and advances to customers | 187,400 | 17,519 | 42,048 | 36,047 | 50,173 | 3,569 | 336,759 |
| Debt securities | 1,759 | 22 | - | 896 | 1,804 | - | 4,481 |
| Held-to-maturity investments | - | - | - | - | - | - | - |
| Hedging derivatives and macrohedging adjustments | 434 | 2,113 | 8 | 60 | 10 | 4 | 2,629 |
| Total Risk in Financial Assets | 251,984 | 70,609 | 72,100 | 50,618 | 62,935 | 10,344 | 518,591 |
| Contingent risks and liabilities |
|
|
|
|
|
|
|
| Contingent risks | 15,172 | 9,038 | 767 | 2,344 | 5,292 | 929 | 33,542 |
| Contingent liabilities | 28,096 | 17,675 | 16,109 | 24,485 | 7,002 | 803 | 94,170 |
| Total Contingent Risk | 43,268 | 26,713 | 16,876 | 26,829 | 12,294 | 1,732 | 127,712 |
| Total Risks in Financial Instruments | 295,252 | 97,322 | 88,976 | 77,447 | 75,229 | 12,076 | 646,303 |
The breakdown of the main figures in the most significant foreign currencies in the accompanying consolidated balance sheets is set forth in Appendix VII.
Sovereign risk concentration
Sovereign risk management
The risk associated with the transactions involving sovereign risk is identified, measured, controlled and tracked by a centralized unit integrated in the BBVA Group’s Risk Area. Its basic functions involve the preparation of reports in the countries where sovereign risk exists (called “financial programs”), tracking such risks, assigning ratings to these countries and, in general, supporting the Group in terms of reporting requirements for any transactions involving sovereign risk. The risk policies established in the financial programs are approved by the relevant risk committees.
The country risk unit tracks the evolution of the risks associated with the various countries to which the Group are exposed (including sovereign risk) on an ongoing basis in order to adapt its risk and mitigation policies to any macroeconomic and political changes that may occur. Moreover, it regularly updates its internal ratings and forecasts for these countries. The internal rating assignment methodology is based on the assessment of quantitative and qualitative parameters which are in line with those used by certain multilateral organizations such as the International Monetary Fund (IMF) and the World Bank (WB), rating agencies and export credit organizations.
Sovereign risk exposure
The table below provides a breakdown of exposure to financial assets (excluding derivatives and equity instruments), as of December 31, 2015, 2014 and 2013 by type of counterparty and the country of residence of such counterparty. The below figures do not take into account valuation adjustments, impairment losses or loan-loss provisions:
Download Excel
|
|
Millions of euros | ||||
|---|---|---|---|---|---|
|
|
December 2015 | ||||
| Risk Exposure by Countries | Sovereign Risk (*) |
Financial Institutions | Other Sectors | Total | % |
| Spain | 74,020 | 7,323 | 177,348 | 258,690 | 42.8% |
| Turkey | 12,037 | 3,374 | 54,161 | 69,572 | 11.5% |
| Italy | 10,694 | 724 | 1,858 | 13,276 | 2.2% |
| France | 1,029 | 5,796 | 3,025 | 9,850 | 1.6% |
| Portugal | 704 | 19 | 4,711 | 5,433 | 0.9% |
| Germany | 560 | 1,473 | 1,588 | 3,621 | 0.6% |
| United Kingdom | 4 | 7,466 | 6,547 | 14,017 | 2.3% |
| Ireland | 1 | 96 | 934 | 1,031 | 0.2% |
| Greece | - | 0 | 57 | 57 | 0.0% |
| Rest of Europe | 1,278 | 2,668 | 8,769 | 12,715 | 2.1% |
| Subtotal Europe | 100,327 | 28,938 | 258,998 | 388,262 | 64.2% |
| Mexico | 22,192 | 5,676 | 46,438 | 74,306 | 12.3% |
| The United States | 11,378 | 3,834 | 61,738 | 76,950 | 12.7% |
| Venezuela | 152 | 146 | 845 | 1,144 | 0.2% |
| Rest of countries | 3,711 | 4,470 | 55,717 | 63,897 | 10.6% |
| Total Rest of Countries | 37,433 | 14,126 | 164,738 | 216,297 | 35.8% |
| Total Exposure to Financial Instruments | 137,760 | 43,064 | 423,735 | 604,559 | 100.0% |
Download Excel
|
|
Millions of euros | ||||
|---|---|---|---|---|---|
|
|
December 2014 | ||||
| Risk Exposure by Countries | Sovereign Risk (*) |
Financial Institutions | Other Sectors | Total | % |
| Spain | 68,584 | 9,040 | 157,337 | 234,961 | 46.5% |
| Italy | 9,823 | 713 | 2,131 | 12,667 | 2.5% |
| France | 1,078 | 5,351 | 2,453 | 8,883 | 1.8% |
| United Kingdom | 119 | 2,923 | 4,669 | 7,711 | 1.5% |
| Portugal | 605 | 43 | 4,927 | 5,574 | 1.1% |
| Germany | 590 | 1,129 | 1,565 | 3,284 | 0.6% |
| Ireland | 167 | 148 | 565 | 880 | 0.2% |
| Turkey | 21 | 214 | 246 | 482 | 0.1% |
| Greece | - | - | 64 | 64 | 0.0% |
| Rest of Europe | 1,182 | 6,011 | 4,800 | 11,993 | 2.4% |
| Subtotal Europa | 82,170 | 25,573 | 178,757 | 286,499 | 56.7% |
| Mexico | 31,164 | 2,757 | 42,864 | 76,785 | 15.2% |
| The United States | 11,241 | 3,941 | 52,849 | 68,031 | 13.5% |
| Rest of countries | 7,676 | 4,669 | 62,052 | 74,398 | 14.7% |
| Total Rest of Countries | 50,081 | 11,367 | 157,765 | 219,213 | 43.3% |
| Total Exposure to Financial Instruments | 132,251 | 36,939 | 336,522 | 505,713 | 100.0% |
Download Excel
|
|
Millions of euros | ||||
|---|---|---|---|---|---|
|
|
December 2013 | ||||
| Risk Exposure by Countries | Sovereign Risk (*) |
Financial Institutions | Other Sectors | Total | % |
| Spain | 59,114 | 11,870 | 166,677 | 237,661 | 51.1% |
| United Kingdom | 3 | 5,405 | 4,377 | 9,785 | 2.1% |
| Italy | 3,888 | 422 | 2,617 | 6,927 | 1.5% |
| France | 942 | 2,640 | 2,316 | 5,898 | 1.3% |
| Portugal | 385 | 238 | 5,179 | 5,802 | 1.2% |
| Germany | 1,081 | 1,338 | 1,206 | 3,625 | 0.8% |
| Ireland | - | 221 | 487 | 708 | 0.2% |
| Turkey | 10 | 65 | 163 | 238 | 0.1% |
| Greece | - | - | 72 | 72 | 0.0% |
| Rest of Europe | 2,608 | 2,552 | 4,239 | 9,399 | 2.0% |
| Subtotal Europa | 68,031 | 24,751 | 187,333 | 280,115 | 60.2% |
| Mexico | 26,629 | 2,810 | 38,312 | 67,751 | 14.6% |
| The United States | 5,224 | 3,203 | 41,872 | 50,299 | 10.8% |
| Rest of countries | 7,790 | 5,480 | 53,649 | 66,919 | 14.4% |
| Total Rest of Countries | 39,643 | 11,493 | 133,833 | 184,969 | 39.8% |
| Total Exposure to Financial Instruments | 107,674 | 36,244 | 321,166 | 465,084 | 100.0% |
The exposure to sovereign risk set out in the above tables includes positions held in government debt securities in countries where the Group operates. They are used for ALCO’s management of the interest-rate risk on the balance sheets of the Group’s entities in these countries, as well as for hedging of pension and insurance commitments by insurance entities within the BBVA Group.
For additional information on sovereign risk in Europe see Appendix XII
Valuation and impairment methods
The valuation methods used to assess the instruments that are subject to sovereign risks are the same ones used for other instruments included in the relevant portfolios and are detailed in Note 8. Specifically, the fair value of sovereign debt securities of European countries has been considered equivalent to their listed price in active markets (Level 1 as defined in Note 8).
Risk related to the developer and Real-Estate sector in Spain
One of the main Group activities of the Group in Spain is focused on developer and mortgage loans. The policies and strategies established by the Group to deal with risks related to the developer and real-estate sector are explained below:
Policies and strategies established by the Group to deal with risks related to the developer and real-estate sector
BBVA has teams specializing in the management of the Real-Estate Sector risk, given its economic importance and specific technical component. This specialization is not only in the Risk-Acceptance teams, but throughout the handling, commercial, problem risks and legal, etc. It also includes the research department of the BBVA Group (BBVA Research), which helps determine the medium/long-term vision needed to manage this portfolio. Specialization has been increased and the management teams in the areas of recovery and the Real Estate Unit itself have been reinforced.
The policies established to address the risks related to the developer and real-estate sector, aim to accomplish, among others, the following objectives: to avoid concentration in terms of customers, products and regions; to estimate the risk profile for the portfolio; and to anticipate possible worsening of the portfolio.
Specific policies for analysis and admission of new developer risk transactions
In the analysis of new operations, the assessment of the commercial operation in terms of the economic and financial viability of the project has been one of the constant points that have helped ensure the success and transformation of construction land operations for customers’ developments.
With regard the participation of the Risk Acceptance teams, they have a direct link and participate in the committees of areas such as Recoveries and the Real Estate Unit. This guarantees coordination and exchange of information in all the processes.
The following strategies have been implemented with customers in the developer sector: avoidance of large corporate transactions, which had already reduced their share in the years of greatest market growth; non active participation in the second-home market; commitment to public housing financing; and participation in land operations with a high level of urban development security, giving priority to land open to urban development.
Risk monitoring policies
The base information for analyzing the real estate portfolios is updated monthly. The tools used include the so-called “watch-list”, which is updated monthly with the progress of each client under watch, and the different strategic plans for management of special groups. There are plans that involve an intensification of the review of the portfolio for financing land, while, in the case of ongoing promotions, they are classified based on the rate of progress of the projects.
These actions have enabled BBVA to identify possible impairment situations, by always keeping an eye on BBVA’s position with each customer (whether or not as first creditor). In this regard, key aspects include management of the risk policy to be followed with each customer, contract review, deadline extension, improved collateral, rate review (repricing) and asset purchase.
Proper management of the relationship with each customer requires knowledge of various aspects such as the identification of the source of payment difficulties, an analysis of the company’s future viability, the updating of the information on the debtor and the guarantors (their current situation and business course, economic-financial information, debt analysis and generation of funds), and the updating of the appraisal of the assets offered as collateral.
BBVA has a classification of debtors in accordance with legislation in force in each country, usually categorizing each one’s level of difficulty for each risk.
Based on the information above, a decision is made whether to use the refinancing tool, whose objective is to adjust the structure of the maturity of the debt to the generation of funds and the customer’s payment capacity.
As for the policies relating to risk refinancing with the developer and real-estate sector, they are the same as the general policies used for all of the Group’s risks (see Note 7.3.9). In the developer and real estate sector, they are based on clear solvency and viability criteria for projects, with demanding terms for additional guarantees and legal compliance, given a refinancing tool that standardizes criteria and variables when considering any refinancing operation.
In the case of refinancing, the tools used for enhancing the Bank’s position are: the search for new intervening parties with proven solvency and initial payment to reduce the principal debt or outstanding interest; the improvement of the debt bond in order to facilitate the procedure in the event of default; the provision of new or additional collateral; and making refinancing viable with new conditions (period, rate and repayments), adapted to a credible and sufficiently verified business plan.
Policies applied in the management of real estate assets in Spain
The policy applied for managing these assets depends on the type of real-estate asset, as detailed below.
In the case of completed homes, the final aim is the sale of these homes to private individuals, thus diluting the risk and beginning a new business cycle. Here, the strategy has been to help subrogation (the default rate in this channel of business is notably lower than in any other channel of residential mortgages) and to support customers’ sales directly, using BBVA’s own channel (BBVA Services and our branches), creating incentives for sale and including sale orders for BBVA. In exceptional case we have even accepted partial haircuts, with the aim of making the sale easier.
In the case of ongoing construction work, the strategy has been to help and promote the completion of the works in order to transfer the investment to completed homes. The whole developer Works in Progress portfolio has been reviewed and classified into different stages with the aim of using different tools to support the strategy. This includes the use of developer accounts-payable financing as a form of payment control, the use of project monitoring supported by the Real Estate Unit itself, and the management of direct suppliers for the works as a complement to the developer’s own management.
With respect to land, the fact that the vast majority of the risk is urban land simplifies the management. Urban management and liquidity control to tackle urban planning costs are also subject to special monitoring.
For quantitative information about the risk related to the developer and Real-Estate sector in Spain see Appendix XIII.
7.3.5 Credit quality of financial assets that are neither past due nor impaired
The BBVA Group has tools (“scoring” and “rating”) that enable it to rank the credit quality of its operations and customers based on an assessment and its correspondence with the probability of default (“PD”) scales. To analyze the performance of PD, the Group has a series of tracking tools and historical databases that collect the pertinent internally generated information, which can basically be grouped together into scoring and rating models.
Scoring
Scoring is a decision-making model that contributes to both the arrangement and management of retail loans: consumer loans, mortgages, credit cards for individuals, etc. Scoring is the tool used to decide to originate a loan, what amount should be originated and what strategies can help establish the price, because it is an algorithm that sorts transactions by their credit quality. This algorithm enables the BBVA Group to assign a score to each transaction requested by a customer, on the basis of a series of objective characteristics that have statistically been shown to discriminate between the quality and risk of this type of transactions. The advantage of scoring lies in its simplicity and homogeneity: all that is needed is a series of objective data for each customer, and this data is analyzed automatically using an algorithm.
There are three types of scoring, based on the information used and on its purpose:
- Reactive scoring: measures the risk of a transaction requested by an individual using variables relating to the requested transaction and to the customer’s socio-economic data available at the time of the request. The new transaction is approved or rejected depending on the score.
- Behavioral scoring: scores transactions for a given product in an outstanding risk portfolio of the entity, enabling the credit rating to be tracked and the customer’s needs to be anticipated. It uses transaction and customer variables available internally. Specifically, variables that refer to the behavior of both the product and the customer.
- Proactive scoring: gives a score at customer level using variables related to the individual’s general behavior with the entity, and to his/her payment behavior in all the contracted products. The purpose is to track the customer’s credit quality and it is used to pre-grant new transactions.
Rating
Rating tools, as opposed to scoring tools, do not assess transactions but focus on the rating of customers instead: companies, corporations, SMEs, public authorities, etc. A rating tool is an instrument that, based on a detailed financial study, helps determine a customer’s ability to meet his/her financial obligations. The final rating is usually a combination of various factors: on one hand, quantitative factors, and on the other hand, qualitative factors. It is a middle road between an individual analysis and a statistical analysis.
The main difference between ratings and scorings is that the latter are used to assess retail products, while ratings use a wholesale banking customer approach. Moreover, scorings only include objective variables, while ratings add qualitative information. And although both are based on statistical studies, adding a business view, rating tools give more weight to the business criterion compared to scoring tools.
For portfolios where the number of defaults is very low (sovereign risk, corporates, financial entities, etc.) the internal information is supplemented by “benchmarking” of the external rating agencies (Moody’s, Standard & Poor’s and Fitch). To this end, each year the PDs compiled by the rating agencies at each level of risk rating are compared, and the measurements compiled by the various agencies are mapped against those of the BBVA master rating scale.
Once the probability of default of a transaction or customer has been calculated, a "business cycle adjustment" is carried out. This is a means of establishing a measure of risk that goes beyond the time of its calculation. The aim is to capture representative information of the behavior of portfolios over a complete economic cycle. This probability is linked to the Master Rating Scale prepared by the BBVA Group to enable uniform classification of the Group’s various asset risk portfolios.
The table below shows the abridged scale used to classify the BBVA Group’s outstanding risk as of December 31, 2015:
Download Excel
|
|
|
Probability of default (basic points) |
||
|---|---|---|---|---|
| External rating Standard&Poor's List |
Internal rating Reduced List (22 groups) |
Average | Minimum from >= | Maximum |
| AAA | AAA | 1 | - | 2 |
| AA+ | AA+ | 2 | 2 | 3 |
| AA | AA | 3 | 3 | 4 |
| AA- | AA- | 4 | 4 | 5 |
| A+ | A+ | 5 | 5 | 6 |
| A | A | 8 | 6 | 9 |
| A- | A- | 10 | 9 | 11 |
| BBB+ | BBB+ | 14 | 11 | 17 |
| BBB | BBB | 20 | 17 | 24 |
| BBB- | BBB- | 31 | 24 | 39 |
| BB+ | BB+ | 51 | 39 | 67 |
| BB | BB | 88 | 67 | 116 |
| BB- | BB- | 150 | 116 | 194 |
| B+ | B+ | 255 | 194 | 335 |
| B | B | 441 | 335 | 581 |
| B- | B- | 785 | 581 | 1,061 |
| CCC+ | CCC+ | 1,191 | 1,061 | 1,336 |
| CCC | CCC | 1,500 | 1,336 | 1,684 |
| CCC- | CCC- | 1,890 | 1,684 | 2,121 |
| CC+ | CC+ | 2,381 | 2,121 | 2,673 |
| CC | CC | 3,000 | 2,673 | 3,367 |
| CC- | CC- | 3,780 | 3,367 | 4,243 |
These different levels and their probability of default were calculated by using as a reference the rating scales and default rates provided by the external agencies Standard & Poor’s and Moody’s. These calculations establish the levels of probability of default for the BBVA Group’s Master Rating Scale. Although this scale is common to the entire Group, the calibrations (mapping scores to PD sections/Master Rating Scale levels) are carried out at tool level for each country in which the Group has tools available.
The table below outlines the distribution of exposure, including derivatives, by internal ratings, to corporates, financial entities and institutions (excluding sovereign risk), of the main BBVA Group entities (excluding Catalunya Banc) as of December 31, 2015 and 2014:
Download Excel
|
|
December 2015 | December 2014 | ||
|---|---|---|---|---|
| Credit Risk Distribution by Internal Rating |
Amount (Millions of Euros) |
% | Amount (Millions of Euros) |
% |
| AAA/AA+/AA/AA- | 27,387 | 10.97% | 30,306 | 11.49% |
| A+/A/A- | 59,194 | 23.71% | 70,850 | 26.86% |
| BBB+ | 40,059 | 16.04% | 37,515 | 14.22% |
| BBB | 22,517 | 9.02% | 24,213 | 9.18% |
| BBB- | 31,996 | 12.81% | 33,129 | 12.56% |
| BB+ | 19,425 | 7.78% | 22,595 | 8.57% |
| BB | 12,785 | 5.12% | 11,136 | 4.22% |
| BB- | 6,326 | 2.53% | 6,364 | 2.41% |
| B+ | 6,050 | 2.42% | 7,475 | 2.83% |
| B | 4,080 | 1.63% | 4,966 | 1.88% |
| B- | 3,047 | 1.22% | 3,876 | 1.47% |
| CCC/CC | 16,827 | 6.74% | 11,362 | 4.31% |
| Total | 249,693 | 100.00% | 263,786 | 100.00% |
7.3.6 Past due but not impaired Risks
The table below provides details by counterpart and by product of past due risks as of December 31, 2015, 2014 and 2013 but not considered to be impaired, listed by their first past-due date:
Download Excel
|
|
Millions of euros | ||
|---|---|---|---|
| Financial Assets Past Due but Not Impaired by counterpart December 2015 | Less than 1 Month Past-Due |
1 to 2 Months Past-Due |
2 to 3 Months Past-Due |
| Loans and advances | 3,445 | 825 | 404 |
| Central banks | - | - | - |
| General Governments | 154 | 278 | 2 |
| Credit institutions and other financial corporations | 7 | 1 | 14 |
| Non-financial corporations | 838 | 148 | 48 |
| Households | 2,446 | 399 | 340 |
| Debt securities | - | - | - |
| Total | 3,445 | 825 | 404 |
Download Excel
| Financial Assets Past Due but Not Impaired by counterpart December 2014 | Millions of euros | ||
|---|---|---|---|
| Less than 1 Month Past-Due |
1 to 2 Months Past-Due |
2 to 3 Months Past-Due |
|
| Loans and advances | 3,286 | 794 | 657 |
| Central banks | - | - | - |
| General Governments | 33 | 1 | 53 |
| Credit institutions and other financial corporations | 6 | - | 17 |
| Non-financial corporations | 849 | 347 | 136 |
| Households | 2,398 | 446 | 451 |
| Debt securities | - | - | - |
| Total | 3,286 | 794 | 657 |
Download Excel
| Financial Assets Past Due but Not Impaired by counterpart December 2013 | Millions of euros | ||
|---|---|---|---|
| Less than 1 Month Past-Due |
1 to 2 Months Past-Due |
2 to 3 Months Past-Due |
|
| Loans and advances | 3,005 | 336 | 220 |
| Central banks | - | - | - |
| General Governments | 63 | 3 | 6 |
| Credit institutions and other financial corporations | 46 | 1 | - |
| Non-financial corporations | 1,248 | 133 | 131 |
| Households | 1,648 | 199 | 83 |
| Debt securities | - | - | - |
| Total | 3,005 | 336 | 220 |
Download Excel
| Financial Assets Past Due but Not Impaired by product December 2015 |
|
Millions of euros |
|
|---|---|---|---|
| Less than 1 Month Past-Due |
1 to 2 Months Past-Due |
2 to 3 Months Past-Due |
|
| On demand | 134 | 13 | 7 |
| Credit card | 389 | 74 | 126 |
| Trade recivables | 98 | 26 | 22 |
| Finance leases | 136 | 29 | 21 |
| Other term loans | 2,685 | 682 | 227 |
| Advances and other | 3 | - | - |
| Total | 3,445 | 825 | 404 |
| Of which: by type of collateral | - | - | - |
| Mortgage loans | 1,342 | 266 | 106 |
| Other collateralized loans | 589 | 102 | 27 |
Download Excel
| Financial Assets Past Due but Not Impaired by product December 2014 |
|
Millions of euros |
|
|---|---|---|---|
| Less than 1 Month Past-Due |
1 to 2 Months Past-Due |
2 to 3 Months Past-Due |
|
| On demand | 77 | 2 | 1 |
| Credit card | 128 | 36 | 12 |
| Trade recivables | 271 | 11 | 28 |
| Finance leases | 167 | 33 | 21 |
| Other term loans | 2,603 | 697 | 592 |
| Advances and other | 40 | 14 | 2 |
| Total | 3,286 | 794 | 657 |
| Of which: by type of collateral |
|
|
|
| Mortgage loans | 1,005 | 539 | 53 |
| Other collateralized loans | 209 | 9 | - |
Download Excel
| Financial Assets Past Due but Not Impaired by product December 2013 |
|
Millions of euros |
|
|---|---|---|---|
| Less than 1 Month Past-Due |
1 to 2 Months Past-Due |
2 to 3 Months Past-Due |
|
| On demand | 82 | 1 | - |
| Credit card | 108 | 18 | 11 |
| Trade recivables | 260 | 26 | 38 |
| Finance leases | 151 | 17 | 14 |
| Other term loans | 2,163 | 274 | 157 |
| Advances and other | 241 | - | - |
| Total | 3,005 | 336 | 220 |
| Of which: by type of collateral |
|
|
|
| Mortgage loans | 1,179 | 150 | 106 |
| Other collateralized loans | 439 | 65 | 26 |
7.3.7 Impaired assets and impairment losses
The table below shows the composition of the impaired financial assets and risks as of December 31, 2015, 2014 and 2013, broken down by heading in the accompanying consolidated balance sheets:
Download Excel
| Impaired Risks. Breakdown by Type of Asset and by Sector |
|
Millions of euros | ||
|---|---|---|---|---|
| Notes | 2015 | 2014 | 2013 | |
| Asset Instruments Impaired |
|
|
|
|
| Available-for-sale financial assets |
|
76 | 91 | 90 |
| Debt securities |
|
76 | 91 | 90 |
| Loans and receivables |
|
25,363 | 22,730 | 25,478 |
| Loans and advances to credit institutions |
|
25 | 23 | 29 |
| Loans and advances to customers | 13.2 | 25,333 | 22,703 | 25,445 |
| Debt securities |
|
5 | 4 | 4 |
| Total Asset Instruments Impaired |
|
25,439 | 22,821 | 25,568 |
| Contingent Risks Impaired |
|
664 | 413 | 410 |
| Total impaired risks |
|
26,103 | 23,234 | 25,978 |
Below are the details of the impaired financial assets as of December 31, 2015, 2014 and 2013, classified by geographical area and by the time since their oldest past-due amount or the period since they were deemed impaired:
Download Excel
| Impaired Financial Assets by geographic area and time since oldest past-due Amount December 2015 | Millions of euros | |||
|---|---|---|---|---|
| Less than 6 Month Past-Due |
6 to 12 Months Past-Due |
More than 1 year Past-Due | Total | |
| Spain | 11,538 | 1,148 | 7,268 | 19,953 |
| Rest of Europe | 372 | 31 | 387 | 790 |
| Mexico | 685 | 313 | 279 | 1,277 |
| South America | 862 | 100 | 200 | 1,162 |
| The United States | 551 | 78 | - | 629 |
| Turkey | 619 | 232 | 777 | 1,628 |
| Rest of the world | - | - | - | - |
| Total | 14,627 | 1,902 | 8,911 | 25,439 |
Download Excel
| Impaired Financial Assets by geographic area and time since oldest past-due Amount December 2014 | Millions of euros | |||
|---|---|---|---|---|
| Less than 6 Month Past-Due |
6 to 12 Months Past-Due |
More than 1 year Past-Due | Total | |
| Spain | 8,559 | 1,369 | 9,237 | 19,165 |
| Rest of Europe | 432 | 73 | 49 | 554 |
| Mexico | 727 | 218 | 433 | 1,378 |
| South America | 856 | 186 | 166 | 1,208 |
| The United States | 440 | 26 | 50 | 516 |
| Rest of the world | - | - | - | - |
| Total | 11,014 | 1,872 | 9,935 | 22,821 |
Download Excel
| Impaired Financial Assets by geographic area and time since oldest past-due Amount December 2013 | Millions of euros | |||
|---|---|---|---|---|
| Less than 6 Month Past-Due |
6 to 12 Months Past-Due |
More than 1 year Past-Due | Total | |
| Spain | 9,930 | 3,248 | 8,599 | 21,777 |
| Rest of Europe | 383 | 63 | 239 | 685 |
| Mexico | 795 | 262 | 410 | 1,467 |
| South America | 854 | 126 | 116 | 1,096 |
| The United States | 481 | 24 | 38 | 543 |
| Rest of the world | - | - | - | - |
| Total | 12,443 | 3,723 | 9,402 | 25,568 |
Below are the details of the impaired financial assets as of December 31, 2015, 2014 and 2013 classified by type of loan according to its associated guarantee, and by the time since their oldest past-due amount or the period since they were deemed impaired:
Download Excel
| Impaired Financial Assets by sector and time since oldest Past Due Amount December 2015 | Millions of euros | |||
|---|---|---|---|---|
| Less than 6 Month Past-Due |
6 to 12 Months Past-Due |
More than 1 year Past-Due | Total | |
| Loans and receivables | 14,627 | 1,902 | 8,834 | 25,362 |
| Credit institutions | 25 | - | - | 25 |
| Loans and advances | 14,598 | 1,902 | 8,834 | 25,333 |
| General governments | 115 | 1 | 79 | 194 |
| Other financial corporations | 22 | 31 | 14 | 67 |
| Non-financial corporations | 9,388 | 883 | 5,982 | 16,254 |
| Individuals | 5,072 | 987 | 2,758 | 8,817 |
| Debt securities | 5 | - | - | 5 |
| Credit institutions | 5 | - | - | 5 |
| Other financial corporations | - | - | - | - |
| Available for sale | - | - | 77 | 77 |
| Debt instruments | - | - | 77 | 77 |
| Credit institutions | - | - | 18 | 18 |
| Other financial corporations | - | - | 59 | 59 |
| TOTAL | 14,627 | 1,902 | 8,911 | 25,439 |
Download Excel
| Impaired Financial Assets by sector and time since oldest Past Due Amount December 2014 | Millions of euros | |||
|---|---|---|---|---|
| Less than 6 Month Past-Due |
6 to 12 Months Past-Due |
More than 1 year Past-Due | Total | |
| Loans and receivables | 11,014 | 1,872 | 9,844 | 22,730 |
| Credit institutions | 23 | - | - | 23 |
| Loans and advances | 10,987 | 1,872 | 9,844 | 22,703 |
| General governments | 73 | 13 | 95 | 180 |
| Other financial corporations | 29 | 2 | 2 | 33 |
| Non-financial corporations | 6,675 | 1,224 | 7,529 | 15,428 |
| Individuals | 4,210 | 633 | 2,218 | 7,061 |
| Debt securities | 4 | - | - | 4 |
| Credit institutions | 4 | - | - | 4 |
| Other financial corporations | - | - | - | - |
| Available for sale | - | - | 91 | 91 |
| Debt instruments | - | - | 91 | 91 |
| Credit institutions | - | - | 17 | 17 |
| Other financial corporations | - | - | 75 | 75 |
| TOTAL | 11,014 | 1,872 | 9,935 | 22,821 |
Download Excel
| Impaired Financial Assets by sector and time since oldest Past Due Amount December 2013 | Millions of euros | |||
|---|---|---|---|---|
| Less than 6 Month Past-Due |
6 to 12 Months Past-Due |
More than 1 year Past-Due | Total | |
| Loans and receivables | 12,353 | 3,723 | 9,402 | 25,478 |
| Credit institutions | 29 | - | - | 29 |
| Loans and advances | 12,320 | 3,723 | 9,402 | 25,445 |
| General governments | 66 | 23 | 89 | 178 |
| Other financial corporations | 2 | - | - | 2 |
| Non-financial corporations | 7,971 | 2,608 | 6,614 | 17,193 |
| Individuals | 4,279 | 1,092 | 2,699 | 8,070 |
| Debt securities | 4 | - | - | 4 |
| Credit institutions | 4 | - | - | 4 |
| Other financial corporations | - | - | - | - |
| Available for sale | 90 | - | - | 90 |
| Debt instruments | 90 | - | - | 90 |
| Credit institutions | 15 | - | - | 15 |
| Other financial corporations | 75 | - | - | 75 |
| TOTAL | 12,443 | 3,723 | 9,402 | 25,568 |
The breakdown of impaired loans and advances for default or reasons other than delinquency as of December 31, 2015, 2014 and 2013:
Download Excel
| Carrying amount of the impaired assets by product | Millions of euros | ||
|---|---|---|---|
| December 2015 | December 2014 | December 2013 | |
| Loans and advances | 25,358 | 22,726 | 25,474 |
| On demand and short notice | 634 | 664 | 717 |
| Credit card debt | 689 | 420 | 393 |
| Trade recievables | 628 | 852 | 756 |
| Finance leases | 529 | 310 | 360 |
| Reverse repurchase loans | 1 | 16 | - |
| Other term loans | 22,764 | 20,358 | 23,248 |
| Advances that are not loans | 113 | 105 | - |
| Of which: by type of collateral |
|
|
|
| Mortgage loans | 16,526 | 14,609 | 17,929 |
| Other collateralized loans | 1,129 | 494 | 421 |
Below are the details of impaired financial assets as of December 31, 2015, 2014 and 2013, classified by whether they have been assigned individually or collectively determined provision:
Download Excel
| Impaired portfolio and specific allowances | Millions of euros | ||
|---|---|---|---|
| December 2015 | December 2014 | December 2013 | |
| Impaired portfolio | 25,439 | 22,821 | 25,568 |
| Collectively determined impaired financial assets | 15,325 | 14,712 | 17,153 |
| Individually determined impaired financial assets | 10,115 | 8,109 | 8,415 |
| Specific allowances | 12,866 | 10,519 | 11,263 |
| Specific allowances for collectively assessed financial assets | 9,015 | 8,018 | 8,778 |
| Specific allowances for individually assessed financial assets | 3,851 | 2,501 | 2,485 |
The detail of impaired financial assets and their collective allowance as of December 31, 2015, 2014 and 2013, 2014, breaking down by individual or collective analysis (see Note 2.2.1)
Download Excel
| December 2015 | Millions of euros | ||||
|---|---|---|---|---|---|
| Carrying amount of the impaired Available for sale assets and Loans and receivables | Specific allowances for individually assessed financial assets | Specific allowances for collectively assessed financial assets | Collective allowances for incurrred but not reported losses | Total | |
| Available for sale financial assets | 76 | (17) | (14) | (109) | (139) |
| Central banks | - | - | - | - | - |
| General governments | - | - | - | (16) | (16) |
| Credit institutions | 76 | (17) | (14) | (24) | (55) |
| Non-financial corporations | - | - | - | (69) | (69) |
| Loans and receivables | 25,363 | (3,835) | (9,001) | (5,916) | (18,752) |
| Central banks | - | - | - | - | - |
| General governments | 194 | (14) | (23) | (30) | (67) |
| Credit institutions | 97 | (26) | (33) | (164) | (223) |
| Non-financial corporations | 16,254 | (3,153) | (6,071) | (3,096) | (12,321) |
| Households | 8,817 | (641) | (2,873) | (2,625) | (6,139) |
| Total | 25,438 | (3,851) | (9,015) | (6,025) | (18,891) |
Download Excel
| December 2014 | Millions of euros | ||||
|---|---|---|---|---|---|
| Carrying amount of the impaired Available for sale assets and Loans and receivables | Specific allowances for individually assessed financial assets | Specific allowances for collectively assessed financial assets | Collective allowances for incurrred but not reported losses | Total | |
| Available for sale financial assets | 91 | (12) | (17) | (42) | (71) |
| Central banks | - | - | - | - | - |
| General governments | - | - | - | - | - |
| Credit institutions | 91 | (12) | (17) | (14) | (43) |
| Non-financial corporations | - | - | - | (28) | (28) |
| Loans and receivables | 22,730 | (2,490) | (8,002) | (3,785) | (14,278) |
| Central banks | - | - | - | - | - |
| General governments | 180 | (9) | (16) | (24) | (49) |
| Credit institutions | 54 | (13) | (29) | (94) | (137) |
| Non-financial corporations | 14,771 | (2,155) | (5,556) | (1,938) | (9,649) |
| Households | 7,725 | (312) | (2,401) | (1,729) | (4,442) |
| Total | 22,821 | (2,502) | (8,019) | (3,827) | (14,348) |
Download Excel
| December 2013 | Millions of euros | ||||
|---|---|---|---|---|---|
| Carrying amount of the impaired Available for sale assets and Loans and receivables | Specific allowances for individually assessed financial assets | Specific allowances for collectively assessed financial assets | Collective allowances for incurrred but not reported losses | Total | |
| Available for sale financial assets | 90 | (14) | (17) | (25) | (55) |
| Central banks | - | - | - | - | - |
| General governments | - | - | - | - | - |
| Credit institutions | 90 | (14) | (17) | (22) | (53) |
| Non-financial corporations | - | - | - | (3) | (3) |
| Loans and receivables | 25,476 | (2,472) | (8,762) | (3,760) | (14,995) |
| Central banks | - | - | - | - | - |
| General governments | 178 | (7) | (59) | (14) | (80) |
| Credit institutions | 35 | (7) | (31) | (68) | (106) |
| Non-financial corporations | 17,193 | (2,145) | (6,672) | (2,475) | (11,293) |
| Households | 8,070 | (312) | (1,999) | (1,203) | (3,514) |
| Total | 25,565 | (2,486) | (8,779) | (3,785) | (15,050) |
The breakdown of impaired loans by sector as of December 31, 2015, 2014 and 2013 is shown below:
Download Excel
|
|
Millions of euros | ||||||||
|---|---|---|---|---|---|---|---|---|---|
|
|
2015 | 2014 | 2013 | ||||||
| Impaired Loans by Sector | Impaired Loans | Loan Loss Reserve | Impaired Loans as a % of Loans by Type | Impaired Loans | Loan Loss Reserve | Impaired Loans as a % of Loans by Type | Impaired Loans | Loan Loss Reserve | Impaired Loans as a % of Loans by Type |
| Domestic: |
|
|
|
|
|
|
|
|
|
| Government | 191 | (34) | 0.81% | 172 | (20) | 0.74% | 158 | (11) | 0.71% |
| Credit institutions | - | - | 0.00% | - | - | 0.00% | - | - | 0.00% |
| Other sectors: | 19,290 | (9,475) | 11.44% | 18,391 | (8,799) | 11.87% | 20,826 | (9,233) | 12.60% |
| Agriculture | 107 | (44) | 10.06% | 136 | (67) | 11.13% | 142 | (66) | 11.18% |
| Industrial | 1,657 | (1,020) | 10.99% | 1,500 | (789) | 11.11% | 1,804 | (843) | 13.10% |
| Real estate and construction | 7,732 | (4,534) | 41.52% | 8,942 | (5,052) | 44.33% | 10,387 | (5,522) | 41.02% |
| Commercial and other financial | 1,284 | (746) | 11.11% | 1,371 | (661) | 7.43% | 1,103 | (504) | 7.10% |
| Loans to individuals | 5,977 | (1,942) | 5.68% | 4,982 | (1,549) | 5.77% | 5,745 | (1,525) | 6.36% |
| Other | 2,533 | (1,189) | 14.72% | 1,459 | (680) | 9.58% | 1,645 | (773) | 8.67% |
| Total Domestic | 19,481 | (9,509) | 10.13% | 18,563 | (8,819) | 10.41% | 20,985 | (9,244) | 10.89% |
| Foreign: |
|
|
|
|
|
|
|
|
|
| Government | 21 | (11) | 0.14% | 8 | (1) | 0.06% | 11 | (2) | 0.11% |
| Credit institutions | 30 | (23) | 0.00% | 27 | (22) | 0.00% | 33 | (26) | 2.16% |
| Other sectors: | 5,831 | (3,294) | 2.58% | 4,131 | (1,651) | 2.57% | 4,449 | (1,964) | 3.20% |
| Agriculture | 124 | (64) | 3.82% | 114 | (26) | 3.65% | 170 | (114) | 4.59% |
| Industrial | 776 | (412) | 1.85% | 310 | (34) | 1.29% | 288 | (138) | 1.93% |
| Real estate and construction | 400 | (246) | 1.97% | 304 | (110) | 2.34% | 1,734 | (698) | 11.44% |
| Commercial and other financial | 612 | (314) | 1.91% | 224 | (79) | 0.88% | 269 | (139) | 0.85% |
| Loans to individuals | 2,840 | (1,572) | 3.19% | 2,156 | (991) | 2.99% | 1,202 | (535) | 2.02% |
| Other | 1,078 | (687) | 2.76% | 1,023 | (410) | 4.45% | 785 | (340) | 5.54% |
| Total Foreign | 5,882 | (3,327) | 2.44% | 4,167 | (1,674) | 2.39% | 4,493 | (1,991) | 2.69% |
| Collective allowances for incurrred but not reported losses |
|
(5,916) |
|
|
(3,785) |
|
- | (3,760) |
|
| Total impaired loans | 25,363 | (18,752) |
|
22,730 | (14,278) |
|
25,478 | (14,995) |
|
The table below represents the accumulated financial income accrued as of December 31, 2015, 2014 and 2013 with origin in the impaired assets that, as mentioned in Note 2.2.1, are not recognized in the accompanying consolidated income statements as there are doubts as to the possibility of collection:
Download Excel
|
|
Millions of euros | ||
|---|---|---|---|
|
|
2015 | 2014 | 2013 |
| Financial Income from Impaired Assets | 3,429 | 3,091 | 3,360 |
The changes in the years ended December 31, 2015, 2014 and 2013 in the impaired financial assets and contingent risks are as follows:
Download Excel
| Changes in Impaired Financial Assets and Contingent Risks | Millions of Euros | ||
|---|---|---|---|
| 2015 | 2014 | 2013 | |
| Balance at the beginning | 23,234 | 25,978 | 20,409 |
| Additions | 9,058 | 8,874 | 17,708 |
| Acquisition of subsidiaries in the year (*) | 5,814 | - | - |
| Decreases (**) | (6,720) | (7,172) | (7,692) |
| Net additions | 8,152 | 1,702 | 10,016 |
| Amounts written-off | (4,989) | (4,720) | (3,825) |
| Exchange differences and other | (295) | 274 | (622) |
| Balance at the end | 26,103 | 23,234 | 25,978 |
The changes in the years ended December 31, 2015, 2014 and 2013, in financial assets derecognized from the accompanying consolidated balance sheet as their recovery is considered unlikely (hereinafter “write-offs”) is shown below:
Download Excel
| Changes in Impaired Financial Assets Written-Off from the Balance Sheet | Millions of euros | ||
|---|---|---|---|
| 2015 | 2014 | 2013 | |
| Balance at the beginning | 23,583 | 20,752 | 19,265 |
| Acquisition of subsidiaries in the year | 1,362 | - | - |
| Increase: | 6,172 | 4,878 | 4,450 |
| Decrease: | (4,830) | (2,204) | (2,319) |
| Re-financing or restructuring | (28) | (3) | (1) |
| Cash recovery (Note 46) | (490) | (443) | (362) |
| Foreclosed assets | (159) | (116) | (96) |
| Sales of written-off | (54) | (66) | (175) |
| Debt forgiveness | (3,119) | (1,231) | (1,000) |
| Time-barred debt and other causes | (980) | (345) | (685) |
| Net exchange differences | (144) | 156 | (645) |
| Balance at the end | 26,143 | 23,583 | 20,752 |
As indicated in Note 2.2.1, although they have been derecognized from the consolidated balance sheet, the BBVA Group continues to attempt to collect on these written-off financial assets, until the rights to receive them are fully extinguished, either because it is time-barred debt, the debt is condoned, or other reasons.
7.3.8 Impairment losses
Below is a breakdown of the provisions recognized on the accompanying consolidated balance sheets to cover estimated impairment losses as of December 31, 2015, 2014 and 2013 in financial assets and contingent risks, according to the different headings under which they are classified in the accompanying consolidated balance sheet:
Download Excel
| Impairment Losses and Provisions for Contingent Risks |
|
Millions of euros | ||
|---|---|---|---|---|
| Notes | 2015 | 2014 | 2013 | |
| Available-for-sale portfolio | 12 | 284 | 174 | 198 |
| Loans and receivables | 13 | 18,752 | 14,278 | 14,995 |
| Loans and advances to customers | 13.2 | 18,691 | 14,244 | 14,950 |
| Loans and advances to credit institutions | 13.1 | 51 | 29 | 40 |
| Debt securities | 13.3 | 10 | 4 | 5 |
| Impairment losses |
|
19,036 | 14,452 | 15,192 |
| Provisions to Contingent Risks and Commitments | 23 | 714 | 381 | 346 |
| Total |
|
19,750 | 14,833 | 15,538 |
| Of which: |
|
|
|
|
| For impaired portfolio |
|
13,385 | 10,825 | 12,969 |
| For currently non-impaired portfolio |
|
6,365 | 4,008 | 2,569 |
Below are the changes in the years ended December 31, 2015, 2014 and 2013, in the estimated impairment losses, broken down by the headings in the accompanying consolidated balance sheet:
Download Excel
| December 2015 |
|
Millions of euros | |||
|---|---|---|---|---|---|
| Notes | Available-for-sale portfolio |
Loans and receivables |
Contingent Risks and Commitments |
Total | |
| Balance at the beginning |
|
174 | 14,278 | 381 | 14,833 |
| Increase in impairment losses charged to income |
|
88 | 6,737 | 69 | 6,895 |
| Decrease in impairment losses credited to income |
|
(12) | (1,999) | (59) | (2,070) |
| Impairment losses (net)(*) | 45-46 | 76 | 4,738 | 10 | 4,825 |
| Entities acquired during the year |
|
45 | 6,572 | 307 | 6,924 |
| Transfers to written-off loans |
|
7 | (5,239) | (26) | (5,258) |
| Exchange differences and other |
|
(18) | (1,597) | 42 | (1,573) |
| Balance at the end |
|
284 | 18,752 | 714 | 19,750 |
Download Excel
| December 2014 |
|
Millions of euros | |||
|---|---|---|---|---|---|
| Notes | Available-for-sale portfolio |
Loans and receivables |
Contingent Risks and Commitments |
Total | |
| Balance at the beginning |
|
198 | 14,995 | 346 | 15,539 |
| Increase in impairment losses charged to income |
|
43 | 11,568 | 77 | 11,688 |
| Decrease in impairment losses credited to income |
|
(7) | (6,821) | (63) | (6,891) |
| Impairment losses (net)(*) | 45-46 | 36 | 4,747 | 14 | 4,797 |
| Entities acquired during the year |
|
- | - | - | - |
| Transfers to written-off loans |
|
(56) | (4,464) | (1) | (4,521) |
| Exchange differences and other |
|
(3) | (999) | 21 | (981) |
| Balance at the end |
|
174 | 14,278 | 381 | 14,833 |
Download Excel
| December 2013 |
|
Millions of euros | |||
|---|---|---|---|---|---|
| Notes | Available-for-sale portfolio | Loans and receivables | Contingent Risks and Commitments |
Total | |
| Balance at the beginning |
|
339 | 14,159 | 322 | 14,820 |
| Increase in impairment losses charged to income |
|
55 | 10,816 | 85 | 10,955 |
| Decrease in impairment losses credited to income |
|
(19) | (4,878) | (46) | (4,944) |
| Impairment losses (net)(*) | 45-46 | 36 | 5,938 | 38 | 6,011 |
| Entities acquired during the year |
|
- | (30) | (1) | (31) |
| Transfers to written-off loans |
|
(164) | (3,673) | - | (3,838) |
| Exchange differences and other |
|
(12) | (1,398) | (13) | (1,424) |
| Balance at the end |
|
198 | 14,995 | 346 | 15,538 |
7.3.9 Refinancing and restructuring operations
Group policies and principles with respect to refinancing and restructuring operations
Refinancing and restructuring operations (see definition in the Glossary) are carried out with customers who have requested such an operation in order to meet their current loan payments if they are expected, or may be expected, to experience financial difficulty in making the payments in the future.
The basic aim of a refinancing and restructuring operation is to provide the customer with a situation of financial viability over time by adapting repayment of the loan incurred with the Group to the customer’s new situation of fund generation. The use of refinancing and restructuring for other purposes, such as to delay loss recognition, is contrary to BBVA Group policies.
The BBVA Group’s refinancing and restructuring policies are based on the following general principles:
- Refinancing and restructuring is authorized according to the capacity of customers to pay the new installments. This is done by first identifying the origin of the payment difficulties and then carrying out an analysis of the customers’ viability, including an updated analysis of their economic and financial situation and capacity to pay and generate funds. If the customer is a company, the analysis also covers the situation of the industry in which it operates.
- With the aim of increasing the solvency of the operation, new guarantees and/or guarantors of demonstrable solvency are obtained where possible. An essential part of this process is an analysis of the effectiveness of both the new and original guarantees.
- This analysis is carried out from the overall customer or group perspective.
- Refinancing and restructuring operations do not in general increase the amount of the customer’s loan, except for the expenses inherent to the operation itself.
- The capacity to refinance and restructure loan is not delegated to the branches, but decided on by the risk units.
- The decisions adopted are reviewed from time to time with the aim of evaluating full compliance with refinancing and restructuring policies.
These general principles are adapted in each case according to the conditions and circumstances of each geographical area in which the Group operates, and to the different types of customers involved.
In the case of retail customers (private individuals), the main aim of the BBVA Group’s policy on refinancing and restructuring loan is to avoid default arising from a customer’s temporary liquidity problems by implementing structural solutions that do not increase the balance of customer’s loan. The solution required is adapted to each case and the loan repayment is made easier, in accordance with the following principles:
- Analysis of the viability of operations based on the customer’s willingness and ability to pay, which may be reduced, but should nevertheless be present. The customer must therefore repay at least the interest on the operation in all cases. No arrangements may be concluded that involve a grace period for both principal and interest.
- Refinancing and restructuring of operations is only allowed on those loans in which the BBVA Group originally entered into.
- Customers subject to refinancing and restructuring operations are excluded from marketing campaigns of any kind.
In the case of non-retail customers (mainly companies, enterprises and corporates), refinancing/restructuring is authorized according to an economic and financial viability plan based on:
- Forecasted future income, margins and cash flows over a sufficiently long period (around five years) to allow entities to implement cost adjustment measures (industrial restructuring) and a business development plan that can help reduce the level of leverage to sustainable levels (capacity to access the financial markets).
- Where appropriate, the existence of a divestment plan for assets and/or business segments that can generate cash to assist the deleveraging process.
- The capacity of shareholders to contribute capital and/or guarantees that can support the viability of the plan.
In accordance with the Group’s policy, the conclusion of a loan refinancing and restructuring operation does not imply the loan is reclassified from "impaired" or "potential problem" to outstanding risk; such a reclassification must be based on the analysis mentioned earlier of the viability and sufficiency of the new guarantees provided.
The Group maintains the policy of including risks related to refinanced and restructured loans as either:
- "Impaired assets", as although the customer is up to date with payments, they are classified as impaired for reasons other than their default when there are significant doubts that the terms of their refinancing may not be met;.
- "Potential problem assets", because there is some material doubt as to possible non-compliance with the refinanced loan; or.
- "Normal-risk assets" (although as mentioned in the table in the following section, they continue to be classified as "normal-risk assets with special monitoring" until the conditions established for their consideration as outstanding risk are met).
The conditions established for “normal-risk assets with special monitoring” to be reclassified out of this special monitoring category are as follows:
- The customer must have paid past-due amounts (principal and interest) since the date of the renegotiation or restructuring of the loan;
- At least two years must have elapsed since the renegotiation or restructuring of the loan;
- The customer must have paid at least 20% of the outstanding principal amount of the loan as well as all the past-due amounts (principal and interest) that were outstanding as of the date of the renegotiation or restructuring of the loan; and
- It is unlikely that the customer will have financial difficulties and, therefore, it is expected that the customer will be able to meet its loan payment obligations (principal and interest) in a timely manner.
The BBVA Group’s refinancing and restructuring policy provides for the possibility of two modifications in a 24 month period for loans that are not in compliance with the payment schedule.
The internal models used to determine allowances for loan losses consider the restructuring and renegotiation of a loan, as well as re-defaults on such a loan, by assigning a lower internal rating to restructured/renegotiated loans than the average internal rating assigned to non-restructured/renegotiated loans. This downgrade results in an increase in the probability of default (PD) assigned to restructured/renegotiated loans (with the resulting PD being higher than the average PD of the non- renegotiated loans in the same portfolios).”
For quantitative information on refinancing and restructuring operations see Appendix XI.
7.4 Market risk
7.4.1 Market risk portfolios
Market risk originates as a result of movements in the market variables that impact the valuation of traded financial products and assets. The main risks generated can be classified as follows:
- Interest-rate risk: This arises as a result of exposure to movements in the different interest-rate curves involved in trading. Although the typical products that generate sensitivity to the movements in interest rates are money-market products (deposits, interest-rate futures, call money swaps, etc.) and traditional interest-rate derivatives (swaps and interest-rate options such as caps, floors, swaptions, etc.), practically all the financial products are exposed to interest-rate movements due to the effect that such movements have on the valuation of the financial discount.
- Equity risk: This arises as a result of movements in share prices. This risk is generated in spot positions in shares or any derivative products whose underlying asset is a share or an equity index. Dividend risk is a sub-risk of equity risk, arising as an input for any equity option. Its variation may affect the valuation of positions and it is therefore a factor that generates risk on the books.
- Exchange-rate risk: This is caused by movements in the exchange rates of the different currencies in which a position is held. As in the case of equity risk, this risk is generated in spot currency positions, and in any derivative product whose underlying asset is an exchange rate. In addition, the quanto effect (operations where the underlying asset and the instrument itself are denominated in different currencies) means that in certain transactions in which the underlying asset is not a currency, an exchange-rate risk is generated that has to be measured and monitored.
- Credit-spread risk: Credit spread is an indicator of an issuer's credit quality. Spread risk occurs due to variations in the levels of spread of both corporate and government issues, and affects positions in bonds and credit derivatives.
- Volatility risk: This occurs as a result of changes in the levels of implied price volatility of the different market instruments on which derivatives are traded. This risk, unlike the others, is exclusively a component of trading in derivatives and is defined as a first-order convexity risk that is generated in all possible underlying assets in which there are products with options that require a volatility input for their valuation.
The metrics developed to control and monitor market risk in BBVA Group are aligned with best practices in the market and are implemented consistently across all the local market risk units.
Measurement procedures are established in terms of the possible impact of negative market conditions on the trading portfolio of the Group's Global Markets units, both under ordinary circumstances and in situations of heightened risk factors.
The standard metric used to measure market risk is Value at Risk (“VaR”), which indicates the maximum loss that may occur in the portfolios at a given confidence level (99%) and time horizon (one day). This statistic value is widely used in the market and has the advantage of summing up in a single metric the risks inherent to trading activity, taking into account how they are related and providing a prediction of the loss that the trading book could sustain as a result of fluctuations in equity prices, interest rates, foreign exchange rates and commodity prices. The market risk analysis considers risks, such as credit spread, basis risk, volatility and correlation risk.
Most of the headings on the Group's consolidated balance sheet subject to market risk are positions whose main metric for measuring their market risk is VaR. This table shows the accounting lines of the consolidated balance sheet as of December 31, 2015 in which there is a market risk in trading activity subject to this measurement:
Download Excel
|
|
Millions of euros | |
|---|---|---|
| Main market risk metrics | ||
| 2015 Headings of the balance sheet under market risk RELATION OF RISK METRICS TO BALANCE SHEET OF GROUP'S CONSOLIDATED POSITION" |
VaR | Others (*) |
| Assets subject to market risk |
|
|
| Financial assets held for trading | 64,370 | 4,712 |
| Available for sale financial assets | 8,234 | 50,088 |
| Of which: Equity instruments | - | 4,067 |
| Hedging derivatives | 528 | 1,888 |
| Liabilities subject to market risk |
|
|
| Financial liabilities held for trading | 42,550 | 6,277 |
| Hedging derivatives | 1,128 | 806 |
Although the prior table shows details the financial positions subject to market risk, it should be noted that the data are for information purposes only and do not reflect how the risk is managed in trading activity, where it is not classified into assets and liabilities.
With respect to the risk measurement models used in BBVA Group, the Bank of Spain has authorized the use of the internal model to determine bank capital requirements deriving from risk positions on the BBVA S.A. and BBVA Bancomer trading book, which jointly account for around 80% of the Group’s trading-book market risk. For the rest of the geographical areas (mainly South America and Compass Bank), bank capital for the risk positions in the trading book is calculated using the standard model.
The current management structure includes the monitoring of market-risk limits, consisting of a scheme of limits based on VaR (Value at Risk), economic capital (based on VaR measurements) and VaR sub-limits, as well as stop-loss limits for each of the Group’s business units. The global limits are approved annually by the Executive Committee at the proposal of the market risk unit, following presentation to the GRMC and the Board of Directors’ Risk Committee. This limits structure is developed by identifying specific risks by type, trading activity and trading desk. In addition, the market risk unit maintains consistency between the limits. The control structure in place is supplemented by limits on losses and a system of warning signals to anticipate the effects of adverse situations in terms of risk and/or result.
The model used estimates VaR in accordance with the "historical simulation" methodology, which involves estimating losses and gains that would have taken place in the current portfolio if the changes in market conditions that took place over a specific period of time in the past were repeated. Based on this information, it infers the maximum expected loss of the current portfolio within a given confidence level. This model has the advantage of reflecting precisely the historical distribution of the market variables and not assuming any specific distribution of probability. The historical period used in this model is two years.
VaR figures are estimated following two methodologies:
- VaR without smoothing, which awards equal weight to the daily information for the previous two years. This is currently the official methodology for measuring market risks for the purpose of monitoring compliance with risk limits.
- VaR with smoothing, which gives a greater weight to more recent market information. This metric supplements the previous one.
In the case of South America, a parametric methodology is used to measure risk in terms of VaR.
At the same time, and following the guidelines established by the Spanish and European authorities, BBVA incorporates metrics in addition to VaR with the aim of meeting the Bank of Spain's regulatory requirements with respect to the calculation of bank capital for the trading book. Specifically, the new measures incorporated in the Group since December 2011 (stipulated by Basel 2.5) are:
- VaR: In regulatory terms, the VaR charge incorporates the stressed VaR charge, and the sum of the two (VaR and stressed VaR) is calculated. This quantifies the losses associated with the movements of the two risk factors inherent to market operations (interest rates, FX, RV, credit...). Both VaR and stressed VaR are rescaled by a regulatory multiplier set at three and by the square root of ten to calculate the capital charge.
- Specific Risk: Incremental Risk Capital (“IRC”) Quantification of the risks of default and downgrading of the credit ratings of the bond and credit derivative positions in the portfolio. The specific capital risk by IRC is a charge exclusively used in the geographical areas with the internal model approved (BBVA S.A. and Bancomer). The capital charge is determined according to the associated losses (at 99.9% in a 1-year horizon under the hypothesis of constant risk) due to the rating migration and/or default state the issuer of an asset. In addition, the price risk is included in sovereign positions for the items specified.
- Specific Risk: Securitization and correlation portfolios. Capital charge for securitizations and the correlation portfolio to include the potential losses associated at the level of rating a specific credit structure (rating). Both are calculated by the standard method. The scope of the correlation portfolios refers to the FTD-type market operation and/or tranches of market CDOs and only for positions with an active market and hedging capacity.
Validity tests are performed regularly on the risk measurement models used by the Group. They estimate the maximum loss that could have been incurred in the positions with a certain level of probability (backtesting), as well as measurements of the impact of extreme market events on risk positions (stress testing). As an additional control measure, backtesting is conducted at trading desk level in order to enable more specific monitoring of the validity of the measurement models.
Market risk in 2015
The Group’s market risk remains at low levels compared with the risk aggregates managed by BBVA, particularly in terms of credit risk. This is due to the nature of the business and the Group’s policy of minimal proprietary trading. In 2015 the average VaR was €24 million, slightly above 2014 figure, with a high on March 4, of €30 m. The evolution in the BBVA Group’s market risk in 2015, measured as VaR without smoothing (see Glossary) with a 99% confidence level and a 1-day horizon (shown in millions of Euros) is as follows:
By type of market risk assumed by the Group's trading portfolio, the main risk factor for the Group continues to be that linked to interest rates, with a weight of 48% of the total at the end of 2015 (this figure includes the spread risk). The relative weight has decreased compared with the close of 2014 (67%). Exchange-rate risk accounts for 21%, increasing its proportion with respect to December 2014 (12%), while equity, volatility and correlation risk have increased, with a weight of 32% at the close of 2015 (vs. 20% at the close of 2014).
As of December 31, 2015, 2014 and 2013 the balance of VaR was €24 million, €25 million and €22 million, respectively. These figures can be broken down as follows:
Download Excel
|
|
Millions of euros | |||||
|---|---|---|---|---|---|---|
| VaR by Risk Factor | Interest/ Spread Risk |
Currency Risk |
Stock- market Risk |
Vega/ Correlation Risk |
Diversification Effect(*) |
Total |
| December 2015 |
|
|
|
|
|
|
| VaR average in the period |
|
|
|
|
|
24 |
| VaR max in the period | 32 | 5 | 3 | 9 | (18) | 30 |
| VaR min in the period | 20 | 6 | 3 | 9 | (17) | 21 |
| End of period VaR | 21 | 9 | 3 | 11 | (20) | 24 |
| December 2014 |
|
|
|
|
|
|
| VaR average in the period |
|
|
|
|
|
23 |
| VaR max in the period | 31 | 6 | 4 | 10 | (22) | 28 |
| VaR min in the period | 24 | 4 | 3 | 11 | (23) | 20 |
| End of period VaR | 30 | 5 | 2 | 7 | (20) | 25 |
| December 2013 |
|
|
|
|
|
|
| VaR average in the period |
|
|
|
|
|
23 |
| VaR max in the period | 39 | 4 | 2 | 13 | (24) | 34 |
| VaR min in the period | 19 | 3 | 2 | 11 | (18) | 17 |
| End of period VaR | 22 | 4 | 3 | 11 | (18) | 22 |
Validation of the model
The internal market risk model is validated on a regular basis by backtesting in both BBVA S.A. and Bancomer.
The aim of backtesting is to validate the quality and precision of the internal model used by BBVA Group to estimate the maximum daily loss of a portfolio, at a 99% level of confidence and a 250-day time horizon, by comparing the Group's results and the risk measurements generated by the model. These tests showed that the internal market risk model of both BBVA, S.A. and Bancomer is adequate and precise.
Two types of backtesting have been carried out in the year ended December 31, 2015:
- "Hypothetical" backtesting: the daily VaR is compared with the results obtained, not taking into account the intraday results or the changes in the portfolio positions. This validates the appropriateness of the market risk metrics for the end-of-day position.
- "Real" backtesting: the daily VaR is compared with the total results, including intraday transactions, but discounting the possible minimum charges or fees involved. This type of backtesting includes the intraday risk in portfolios.
In addition, each of these two types of backtesting was carried out at the level of risk factor or business type, thus making a deeper comparison of the results with respect to risk measurements.
For the period between the second half of 2014 and the first semester of 2015, it was carried out the backtesting of the internal VaR calculation model, comparing the daily results obtained with the estimated risk level estimated by the VaR calculation model. At the end of the year the comparison showed the model was working correctly, within the "green" zone (0-4 exceptions), thus validating the model, as has occurred each year since the internal market risk model was approved for the Group.
Stress test analysis
A number of stress tests are carried out on BBVA Group's trading portfolios. First, global and local historical scenarios are used that replicate the behavior of an extreme past event, such as for example the collapse of Lehman Brothers or the "Tequilazo" crisis. These stress tests are complemented with simulated scenarios, where the aim is to generate scenarios that have a significant impact on the different portfolios, but without being anchored to any specific historical scenario. Finally, for some portfolios or positions, fixed stress tests are also carried out that have a significant impact on the market variables affecting these positions.
Historical scenarios
The historical benchmark stress scenario for the BBVA Group is Lehman Brothers, whose sudden collapse in September 2008 led to a significant impact on the behavior of financial markets at a global level. The following are the most relevant effects of this historical scenario:
- Credit shock: reflected mainly in the increase of credit spreads and downgrades in credit ratings.
- Increased volatility in most of the financial markets (giving rise to a great deal of variation in the prices of different assets (currency, equity, debt).
- Liquidity shock in the financial systems, reflected by a major movement in interbank curves, particularly in the shortest sections of the euro and dollar curves.
Simulated scenarios
Unlike the historical scenarios, which are fixed and therefore not suited to the composition of the risk portfolio at all times, the scenario used for the exercises of economic stress is based on Resampling methodology. This methodology is based on the use of dynamic scenarios are recalculated periodically depending on the main risks held in the trading portfolios. On a data window wide enough to collect different periods of stress (data are taken from 1-1-2008 until today), a simulation is performed by resampling of historic observations, generating a loss distribution and profits to analyze most extreme of births in the selected historical window. The advantage of this methodology is that the period of stress is not predetermined, but depends on the portfolio maintained at each time, and making a large number of simulations (10,000 simulations) allows a richer information for the analysis of expected shortfall than what is available in the scenarios included in the calculation of VaR.
The main features of this approach are: a) the generated simulations respect the correlation structure of the data, b) flexibility in the inclusion of new risk factors and c) to allow the introduction of a lot of variability in the simulations (desirable to consider extreme events).
The impact of the stress test under multivariate simulation of the risk factors of the portfolio (Expected shortfall 95% to 20 days) as of December 31, 2015 is as follows:
Download Excel
|
|
Millions of Euros | |||||
|---|---|---|---|---|---|---|
|
|
Europa | Bancomer | Peru | Venezuela | Colombia | Chile |
| Expected Shortfall | (49) | (43) | (5) | (13) | (6) | (9) |
7.4.2 Structural risk
The Assets and Liabilities Committee (ALCO) is the key body for the management of structural risks relating to liquidity/funding, interest rates and currency rates. Every month, with representatives from the areas of Finance, Risks and Business Areas, this committee monitors the above risks and is presented with proposals for managing them for its approval. These management proposals are made proactively by the Finance area, taking into account the risk appetite framework and with the aim of guaranteeing recurrent earnings and preserving the entity's solvency. All the balance-sheet management units have a local ALCO, assisted constantly by the members of the Corporate Center. There is also a corporate ALCO where the management strategies in the Group's subsidiaries are monitored and presented.
Structural interest-rate risk
The structural interest-rate risk (“SIRR”) is related to the potential impact that variations in market interest rates have on an entity's net interest income and equity. In order to properly measure SIRR, BBVA takes into account the main sources that generate this risk: repricing risk, yield curve risk, option risk and basis risk, which are analyzed from two complementary points of view: net interest income (short term) and economic value (long term).
ALCO monitors the interest-rate risk metrics and the Finance area carries out the management proposals for the structural balance sheet. The management objective is to ensure the stability of net interest income and book value in the face of changes in market interest rates, while respecting the internal solvency and limits in the different balance-sheets and for BBVA Group as a whole; and complying with the requirements to maintain interest-rate risk within the approved limits, in accordance with current and future regulatory requirements.
BBVA's structural interest-rate risk management control and monitoring is based on a set of metrics and tools that enable the Entity's risk profile to be monitored correctly. A wide range of scenarios are measured on a regular basis, including sensitivities to parallel movements in the event of different shocks, changes in slope and curve, as well as delayed movements. Other probabilistic metrics based on statistical scenario-simulating methods are also assessed, such as income at risk (“IaR”) and economic capital (“EC”), which are defined as the maximum adverse deviations in net interest income and economic value, respectively, for a given confidence level and time horizon. Impact thresholds are established on these management metrics both in terms of deviations in net interest income and in terms of the impact on economic value. The process is carried out separately for each currency to which the Group is exposed, and the diversification effect between currencies and business units is considered after this.
In order to guarantee its effectiveness, the model is subjected to regular internal validation, which includes backtesting. In addition, the banking book’s interest-rate risk exposures are subjected to different stress tests in order to reveal balance sheet vulnerabilities under extreme scenarios. This testing includes an analysis of adverse macroeconomic scenarios designed specifically by BBVA Research, together with a wide range of potential scenarios that aim to identify interest-rate environments that are particularly damaging for the Entity. This is done by generating extreme scenarios of a breakthrough in interest rate levels and historical correlations, giving rise to sudden changes in the slopes and even to inverted curves.
The model is necessarily underpinned by an elaborate set of hypotheses that aim to reproduce the behavior of the balance sheet as closely as possible to reality. Especially relevant among these assumptions are those related to the behavior of “accounts with no explicit maturity”, for which stability and remuneration assumptions are established, consistent with an adequate segmentation by type of product and customer, and prepayment estimates (implicit optionality). The hypotheses are reviewed and adapted regularly to signs of changes in behavior, kept properly documented and reviewed on a regular basis in the internal validation processes.
The impacts on the metrics are assessed both from a point of view of economic value (gone concern) and from the perspective of net interest income, for which a dynamic model (going concern) consistent with the corporate assumptions of earnings forecasts is used.
The table below shows the profile of sensitivities to net interest income and value of the main entities in BBVA Group to the year ended December 31, 2015:
Download Excel
|
|
Impact on Net Interest Income (*) | Impact on Economic Value (**) | ||
|---|---|---|---|---|
| Sensitivity to Interest-Rate Analysis - December 2015 |
100 Basis-Point Increase | 100 Basis-Point Decrease | 100 Basis-Point Increase | 100 Basis-Point Decrease |
| Europe | 10.52% | (4.18)% | 4.57% | (3.99)% |
| Mexico | 1.69% | (1.50)% | (4.30)% | 4.60% |
| USA | 7.52% | (5.60)% | (2.03)% | (4.59)% |
| Turkey | (7.17)% | 5.47% | (3.16)% | 3.87% |
| South America | 2.16% | (2.19)% | (2.63)% | 2.84% |
| BBVA Group | 3.91% | (2.30)% | 1.98% | (2.41)% |
In 2015, the expansionary monetary policies in Europe were intensified with has led interest rates to stand at negative levels in several sections of the rate curve. whereas in the United States and Mexico there were the first increase in interest rates by the end of the year. The main economies of South America also initiated the upward cycle of interest rates during the second half of the year.
The BBVA Group in all its Balance Sheet Management Units ("BSMUs") maintains a positive sensitivity in its net interest income to an increase in interest rates. The entry of Turkey, has helped to diversify the Group's net exposure due to the opposite direction of its position on Europe. The higher sensitivities in the net interest income, relatively speaking, are observed in mature markets (Europe and USA), where, however, the negative sensitivity in their net interest income to decrease in interest rates is limited by the plausible downward trend in interest rates. The Group maintains a moderate risk profile, according to its target risk, through effective management of its balance sheet structural risk.
Structural exchange-rate risk
In BBVA Group, structural exchange-rate risk arises from the consolidation of holdings in subsidiaries with functional currencies other than the euro. Its management is centralized in order to optimize the joint handling of permanent foreign currency exposures, taking into account the diversification.
The corporate Balance Sheet Management unit, through ALCO, designs and executes hedging strategies with the main purpose of controlling the potential negative effect of exchange-rate fluctuations on capital ratios and on the equivalent value in euros of the foreign-currency earnings of the Group's subsidiaries, considering transactions according to market expectations and their cost.
The risk monitoring metrics included in the system of limits are integrated into management and supplemented with additional assessment indicators. At corporate level they are based on probabilistic metrics that measure the maximum deviation in capital, CET1 (“Common Equity Tier 1”) ratio, and net attributable profit. The probabilistic metrics make it possible to estimate the joint impact of exposure to different currencies taking into account the different variability in currency rates and their correlations.
The suitability of these risk assessment metrics is reviewed on a regular basis through backtesting exercises. The final element of structural exchange-rate risk control is the analysis of scenarios and stress with the aim of identifying in advance possible threats to future compliance with the risk appetite levels set, so that any necessary preventive management actions can be taken. The scenarios are based both on historical situations simulated by the risk model and on the risk scenarios provided by BBVA Research.
As for the market, in 2015. the strength of the US dollar continued the trend that began in 2014, along with the weakness of the currencies of emerging economies, which have depreciated sharply against the dollar, affected by falling prices in raw materials, especially oil, and uncertainty about the growth in these economies after the change of monetary policy of the Federal Reserve and the slowdown in China. As a result of these factors, there was also an upturn in volatility in foreign exchange markets in emerging markets. Also it is noteworthy the significant adjustment in the Argentina's currency, affected by imbalances in its economy.
The Group's structural exchange-rate risk exposure level has decreased since the end of 2014 as a result of the sale of participations in the Citic Group and the increased hedging, focus on Mexican peso. The risk mitigation level of the book value of BBVA Group's holdings in foreign currency approached 70% and hedging of foreign-currency earnings in 2015 stood at 46%. CET1 ratio sensitivity to the appreciation of 1% in the euro exchange rate for each currency is: US Dollar: +1.2 bps; Mexican peso -0.4 bps; Turkish Lira -0.3 bps; other currencies: -0.1 bps.
Structural equity risk
BBVA Group's exposure to structural equity risk stems basically from investments in industrial and financial companies with medium- and long-term investment horizons. This exposure is mitigated through net short positions held in derivatives of their underlying assets, used to limit portfolio sensitivity to potential falls in prices.
Structural management of equity portfolios is the responsibility of the Group's units specializing in this area. Their activity is subject to the corporate risk management policies for equity positions in the equity portfolio. The aim is to ensure that they are handled consistently with BBVA's business model and appropriately to its risk tolerance level, thus enabling long-term business sustainability.
The Group's risk management systems also make it possible to anticipate possible negative impacts and take appropriate measures to prevent damage being caused to the Entity. The risk control and limitation mechanisms are focused on the exposure, annual operating performance and economic capital estimated for each portfolio. Economic capital is estimated in accordance with a corporate model based on Monte Carlo simulations, taking into account the statistical performance of asset prices and the diversification existing among the different exposures.
Backtesting is carried out on a regular basis on the risk measurement model used.
In the market, the good performance of European stock markets in the first half of 2015 has sharply slowed down in the last month of 2015, affected by the collapse of oil and uncertainty in global growth outlook. This change has led to a deterioration of capital gains accumulated in the Group's equity portfolios.
Structural equity risk, measured in terms of economic capital, has decreased significantly in the period as a result of the sales carried out, among which, the participation in the Citic Group is considered material.
Stress tests and analyses of sensitivity to different simulated scenarios are carried out periodically to analyze the risk profile in more depth. They are based on both past crisis situations and forecasts made by BBVA Research. This checks that the risks are limited and that the tolerance levels set by the Group are not at risk.
7.5 Liquidity risk
Management of liquidity and structural finance within the BBVA Group is based on the principle of the financial autonomy of the entities that make it up. This approach helps prevent and limit liquidity risk by reducing the Group’s vulnerability in periods of high risk. This decentralized management avoids possible contagion due to a crisis that could affect only one or various BBVA Group entities, which must cover their liquidity needs independently in the markets where they operate. Liquidity Management Units have been set up for this reason in the geographical areas where the main foreign subsidiaries operate, and also for the parent BBVA S.A., within the Euro currency scope, specifically BBVA Portugal and the recent Catalunya Banc acquisition.
Finance Division, through Balance Sheet Management, manages BBVA Group's liquidity and funding. It plans and executes the funding of the long-term structural gap of each Liquidity Management Unit (LMUs) and proposes to ALCO the actions to adopt in this regard in accordance with the policies and limits established by the Standing Committee.
The Bank's target behavior in terms of liquidity and funding risk is characterized through the Loan-to-Stable-Customer-Deposits (LtSCD) ratio. The aim is to preserve a stable funding structure in the medium term for each of the LMUs making up BBVA Group, taking into account that maintaining an adequate volume of stable customer funds is key to achieving a sound liquidity profile. These stable funds in each LMU are calculated by analyzing the behavior of the balance sheets of the different customer segments identified as likely to provide stability to the funding structure, and by prioritizing an established relationship and applying bigger haircuts to the funding lines of less stable customers.
For the purpose of establishing the (maximum) target levels for LtSCD in each LMU and providing an optimal funding structure reference in terms of risk appetite, GRM-Structural Risks identifies and assesses the economic and financial variables that condition the funding structures in the various geographical areas. The behavior of the indicators reflects that the funding structure remained robust in 2015, in the sense that all the LMUs maintain levels of self-funding with stable customer funds higher than the required levels.
Download Excel
|
|
|
|
|---|---|---|
|
|
LtSCD by LMU | |
|
|
December 2015 | December 2014 |
| Group (average) | 116% | 124% |
| Eurozone | 116% | 131% |
| Bancomer | 110% | 114% |
| Compass | 112% | 110% |
| Garanti | 128% | - |
| Other LMUs | 111% | 113% |
The second core element in liquidity and funding risk management is to achieve proper diversification of the funding structure, avoiding excessive reliance on short-term funding and establishing a maximum level of short-term borrowing comprising both wholesale funding as well as less stable funds from not-retail customers.
The third element promotes the short-term resilience of the liquidity risk profile, making sure that each LMU has sufficient collateral to address the risk of wholesale markets closing. Basic Capacity is the short-term liquidity risk management and control metric that is defined as the relationship between the available explicit assets and the maturities of wholesale liabilities and volatile funds, at different terms, with special relevance being given to 30-day maturities.
Each entity maintains an individual liquidity fund, both Banco Bilbao Vizcaya Argentaria SA and its subsidiaries, including BBVA Compass, BBVA Bancomer, Garanti Bank and the Latin American subsidiaries. The table below shows the liquidity available by instrument as of December 31, 2015 for the most significant entities:
Download Excel
|
|
Millions of euros | ||||
|---|---|---|---|---|---|
| December 2015 | BBVA Eurozone (1) | BBVA Bancomer | BBVA Compass | Garanti Bank | oTHER |
| Cash and balances with central banks | 10,939 | 6,936 | 3,214 | 6,585 | 7,122 |
| Assets for credit operations with central banks | 51,811 | 5,534 | 22,782 | 4,302 | 4,559 |
| Central governments issues | 31,314 | 2,303 | 8,086 | 4,186 | 3,654 |
| Of Which: Spanish government securities | 25,317 | - | - | - | - |
| Other issues | 20,497 | 3,231 | 479 | 116 | 905 |
| Loans | - | - | 14,217 | - | - |
| Other non-eligible liquid assets | 5,760 | 757 | 20 | 1,680 | 229 |
| ACCUMULATED AVAILABLE BALANCE | 68,510 | 13,227 | 26,016 | 12,567 | 11,910 |
| AVERAGE BALANCE | 67,266 | 12,222 | 24,282 | 12,418 | 10,863 |
The above metrics are completed with a series of indicators with thresholds levels that aim to avoid the concentration of wholesale funding by product, counterparty, market and term, as well as to promote diversification by geographical area. In addition, reference thresholds are established on a series of advance indicators that make it possible to anticipate stress situations in the markets and adopt, if necessary, preventive actions.
Stress analyses are also a basic element of the liquidity and funding risk monitoring system, as they help anticipate deviations from the liquidity targets and limits set out in the risk appetite as well as establish tolerance ranges at different management levels. They also play a key role in the design of the Liquidity Contingency Plan and in defining the specific measures for action for realigning the risk profile.
For each of the scenarios, a check is carried out whether the Bank has a sufficient stock of liquid assets to ensure the ability to meet the liquidity commitments/outflows in the different periods analyzed. The analysis considers four scenarios, one core and three crisis-related: systemic crisis; unexpected internal crisis with a considerable rating downgrade and/or affecting the ability to issue in wholesale markets and the perception of business risk by the banking intermediaries and the bank's customers; and a mixed scenario, as a combination of the two aforementioned scenarios. Each scenario considers the following factors: liquidity existing on the market, customer behavior and sources of funding, impact of rating downgrades, market values of liquid assets and collateral, and the interaction between liquidity requirements and the performance of the bank's asset quality.
The results of these stress analyses carried out regularly reveal that BBVA has a sufficient buffer of liquid assets to deal with the estimated liquidity outflows in a scenario such as a combination of a systemic crisis and an unexpected internal crisis with a major downgrade in the bank's rating (by up to three notches).
In addition to the behavior of the main indicators for all the LMUs in the Group, BBVA has established a level of requirement for compliance with the LCR ratio within the plan to adapt risk management to regulatory capital adequacy ratios, both for the Group as a whole and for each of the LMUs individually. The internal levels required are geared to comply sufficiently and efficiently in advance with the implementation of the regulatory requirement of 2018, at a level above 100%.
Throughout 2015 the level of the LCR for BBVA Group is estimated to have remained above 100%. At the European level the LCR ratio entered into force on October 1, 2015, with an initial required level of 60%, and a phased-in level of up to 100% in 2018. Regulatory developments by the European authorities are pending in terms of the information to be reported to the supervisor and for public disclosure.
Below is a matrix of residual maturities by contractual periods based on supervisory prudential reporting as of December 31, 2015:
Download Excel
|
|
Millions of euros | ||||||||||
|---|---|---|---|---|---|---|---|---|---|---|---|
| December 2015 Contractual Maturities |
Demand | Up to 1 Month | 1 to 3 Months | 3 to 6 Months | 6 to 9 Months | 9 to 12 Months | 1 to 2 Years | 2 to 3 Years | 3 to 5 Years | Over 5 Years | Total |
| Cash and balances with central banks | 34,796 | - | - | - | - | - | - | - | - | - | 34,796 |
| Deposits in credit entities | 1,077 | 4,594 | 766 | 260 | 70 | 42 | 520 | 6 | 950 | 3,988 | 12,273 |
| Deposits in other financial institutions | 7 | 1,246 | 401 | 628 | 595 | 526 | 448 | 495 | 977 | 275 | 5,600 |
| Reverse repo, securities borrowing and margin lending | - | 12,348 | 853 | 546 | 201 | 2,323 | 10 | 84 | 125 | 370 | 16,859 |
| Loans and Advances | 1,364 | 21,639 | 25,624 | 23,777 | 16,750 | 18,477 | 40,512 | 33,835 | 54,790 | 140,602 | 377,371 |
| Securities' portfolio settlement | 484 | 2,001 | 4,014 | 7,073 | 7,835 | 4,129 | 11,944 | 14,722 | 20,366 | 59,755 | 132,324 |
Download Excel
| December 2015 Contractual Maturities |
Millions of euros | ||||||||||
|---|---|---|---|---|---|---|---|---|---|---|---|
| Demand | Up to 1 Month | 1 to 3 Months | 3 to 6 Months | 6 to 9 Months | 9 to 12 Months | 1 to 2 Years | 2 to 3 Years | 3 to 5 Years | Over 5 Years | Total | |
| Wholesale funding | 7 | 5,106 | 9,093 | 5,751 | 2,222 | 5,160 | 15,856 | 7,845 | 11,072 | 33,840 | 95,953 |
| Deposits in financial institutions | 4,932 | 6,271 | 2,064 | 2,783 | 995 | 1,952 | 2,314 | 1,110 | 1,283 | 4,270 | 27,975 |
| Deposits in other financial institutions and international agencies | 13,380 | 8,907 | 6,494 | 2,939 | 2,442 | 2,217 | 205 | 12 | 7 | 274 | 36,877 |
| Customer deposits | 193,079 | 29,003 | 22,846 | 15,983 | 13,517 | 13,751 | 14,076 | 4,615 | 1,447 | 1,190 | 309,508 |
| Securitiy pledge funding | - | 50,042 | 11,166 | 1,197 | 495 | 966 | 2,253 | 15,045 | 1,815 | 1,103 | 84,081 |
| Derivatives (net) | 1 | (2,621) | (208) | (21) | (253) | (74) | 120 | (220) | 14 | (95) | (3,357) |
The matrix shows the retail nature of the funding structure, with a loan portfolio been mostly funded by customer deposits. On the outflows side of the matrix, the “demand” maturity bucket mainly contains the retail customers sight accounts whose behavior shows a high level of stability. According to internal methodology they are considered to remain for a minimum of three years.
Long and short term wholesale funding markets were stable in 2015. The ECB carried out quarterly targeted longer-term refinancing operations (TLTRO) with the aim of boosting channeled lending and improving financial conditions for the whole European economy. At these auctions the Euro LMU took €8 billion in 2015. In addition, over the whole year the Euro LMU made issues in the public market for €3,850 million and US$ 1,000 million.
The liquidity position of all the subsidiaries outside Europe has continued to be comfortable, maintaining a solid liquidity position in all the jurisdictions in which the Group operates. At the same time, capital market access of these subsidiaries with recurring issues on the local market and U.S. market has continued. Among these issues are subordinate debt by BBVA Compass and BBVA Colombia for US$ 700 million and US$ 400 million respectively at a term of 10 years.
In this context, BBVA has maintained its objective of strengthening the funding structure of the different Group entities based on growing their self-funding from stable customer funds, while guaranteeing a sufficient buffer of fully available liquid assets, diversifying the various sources of funding available, and optimizing the generation of collateral available for dealing with stress situations in the markets.
7.6 Asset encumbrance
As of December 31, 2015 and 2014, the encumbered (those provided as collateral for certain liabilities) and unencumbered assets are broken down as follows:
Download Excel
|
|
Millions of euros | |||
|---|---|---|---|---|
| Encumbered assets | Unencumbered assets | |||
| December 2015 | Book value of Encumbered assets | Market value of Encumbered assets | Book value of Encumbered assets | Market value of Encumbered assets |
| Assets | 159,197 |
|
590,880 |
|
| Equity instruments | 2,680 | 2,680 | 9,046 | 9,046 |
| Debt Securities | 56,155 | 56,230 | 95,669 | 95,669 |
| Loans and Advances and other assets | 100,362 |
|
486,165 |
|
The committed value of "Loans and other assets" corresponds mainly to loans linked to the issue of covered bonds, territorial bonds or long-term securitized bonds (see Note 21.3) as well as those used as a guarantee to access certain funding transactions with central banks. Debt securities and other equity securities respond to underlying that are delivered in repos with different types of counterparties, mainly clearing houses or credit institutions, and to a lesser extent central banks. Collateral provided to guarantee derivative operations is also included as committed assets.
As of December 31, 2015, collateral pledge mainly due to repurchase agreements and securities lending, and those which could be committed in order to obtain funding are provided below:
Download Excel
|
|
Millions of euros | ||
|---|---|---|---|
| December 2015 Collateral received |
Fair value of encumbered collateral received or own debt securities issued | Fair value of collateral received or own debt securities issued available for encumbrance | Nominal amount of collateral received or own debt securities issued not available for encumbrance |
| Collateral received | 21,532 | 9,415 | - |
| Equity instruments | - | 768 | - |
| Debt securities | 21,532 | 6,872 | - |
| Loans and Advances and other assets | - | 1,774 | - |
| Own debt securities issued other than own covered bonds or ABSs | 6 | 162 | - |
The guarantees received in the form of reverse repos or security lending transactions are committed by their use in repos, as is the case with debt securities
As of December 31, 2015, financial liabilities issued related to encumbered assets in financial transactions as well as their book value were as follows:
Download Excel
| December 2015 Sources of encumbrance |
Millions of euros | |
|---|---|---|
| Matching liabilities, contingent liabilities or securities lent | Assets, collateral received and own debt securities issued other than covered bonds and ABSs encumbered | |
| Book value of financial liabilities | 155,999 | 180,735 |
7.7 Operational Risk
Operational risk is defined as one that could potentially cause losses due to human errors, inadequate or faulty internal processes, system failures or external events. This definition includes legal risk but excludes strategic and/or business risk and reputational risk.
Operational risk is inherent to all banking activities, products, systems and processes. Its origins are diverse (processes, internal and external fraud, technology, human resources, commercial practices, disasters, suppliers). Operational risk management is a part of the BBVA Group Global risk management structure.
Operational risk management framework
Operational risk management in the Group is based on the value-adding drivers generated by the advanced measurement approach (AMA), as follows:
- Active management of operational risk and its integration into day-to-day decision-making means:
- Knowledge of the real losses associated with this type of risk.
- Identification, prioritization and management of real and potential risks.
- The existence of indicators that enable the Bank to analyze operational risk over time, define warning signals and verify the effectiveness of the controls associated with each risk.
The above helps create a proactive model for making decisions about control and business, and for prioritizing the efforts to mitigate relevant risks in order to reduce the Group's exposure to extreme events.
- Improved control environment and strengthened corporate culture.
- Generation of a positive reputational impact.
Operational Risk Management Principles
Operational risk management in BBVA Group should:
- Be aligned with the risk appetite statement set out by the Board of Directors of BBVA.
- Anticipate the potential operational risks to which the Group would be exposed as a result of new or modified products, activities, processes, systems or outsourcing decisions, and establish procedures to enable their evaluation and reasonable mitigation prior to their implementation.
- Establish methodologies and procedures to enable a regular reassessment of the relevant operational risks to which the Group is exposed in order to adopt appropriate mitigation measures in each case, once the identified risk and the cost of mitigation (cost/benefit analysis) have been considered, while preserving the Group's solvency at all times.
- Identify the causes of the operational losses sustained by the Group and establish measures to reduce them. Procedures must therefore be in place to enable the capture and analysis of the operational events that cause those losses.
- Analyze the events that have caused operational risk losses in other institutions in the financial sector and promote, where appropriate, the implementation of the measures needed to prevent them from occurring in the Group.
- Identify, analyze and quantify events with a low probability of occurrence and high impact in order to ensure their mitigation. Due to their exceptional nature, it is possible that such events may not be included in the loss database or, if they are, they have impacts that are not representative.
- Have an effective system of governance in place, where the functions and responsibilities of the areas and bodies involved in operational risk management are clearly defined.
These principles reflect BBVA Group's vision of operational risk, on the basis that the resulting events have an ultimate cause that should always be identified, and that the impact of the events is reduced significantly by controlling that cause.
Irrespective of the adoption of all the possible measures and controls for preventing or reducing both the frequency and severity of operational risk events, BBVA ensures at all times that sufficient capital is available to cover any expected or unexpected losses that may occur.