This section presents and analyzes the most relevant aspects of the Group's different business areas. Specifically, it shows a summary of the income statement and balance sheet, the business activity figures and the most significant ratios in each of them.
In 2017 the reporting structure of BBVA Group's business areas remained basically the same as in 2016. It is worth noting that BBVA announced the signing of two agreements, one for the sale of BBVA Chile to The Bank of Nova Scotia (Scotiabank) and another for the creation of a joint venture to which BBVA's real-estate business in Spain will be transferred for the subsequent sale of 80% of the company created to a subsidiary of Cerberus Capital Management, L.P. (Cerberus). For the purpose of the explanations given in this report, the figures for Non Core Real Estate and South America are shown on a comparable basis with previous periods, even though within the Group the operations underway that are mentioned above have been reclassified as non-current assets and liabilities held for sale. The Group's business areas are summarized below:
- Banking activity in Spain includes, as in previous years, the Retail Network in Spain, Corporate and Business Banking (CBB), Corporate & Investment Banking (CIB), BBVA Seguros and Asset Management units in Spain. It also includes the portfolios, finance and structural interest-rate positions of the euro balance sheet.
- Non Core Real Estate covers specialist management in Spain of loans to developers in difficulties and real-estate assets mainly coming from foreclosed assets, originated from both, residential mortgages, as well as loans to developers. New loan production to developers or loans that are not in difficulties are managed by Banking activity in Spain.
- The United States includes the Group's business activity in the country through the BBVA Compass group and the BBVA New York branch.
- Mexico basically includes all the banking and insurance businesses carried out by the Group in the country.
- Turkey includes the activity of the Garanti group.
- South America basically includes BBVA's banking and insurance businesses in the region.
- Rest of Eurasia includes business activity in the rest of Europe and Asia, i.e. the Group's retail and wholesale businesses in the area.
In addition to the above, all the areas include a remainder made up basically of other businesses and a supplement that includes deletions and allocations not assigned to the units making up the above areas.
Lastly, the Corporate Center is an aggregate that contains the rest of the items that have not been allocated to the business areas, as it corresponds to the Group's holding function. It includes: the costs of the head offices that have a corporate function; management of structural exchange-rate positions; specific issues of equity instruments to ensure adequate management of the Group’s global solvency; portfolios and their corresponding results, whose management is not linked to customer relations, such as industrial holdings; certain tax assets and liabilities; funds due to commitments with employees; goodwill and other intangibles.
As usual, in the case of the Americas and Turkey areas, the results of applying constant exchange rates are given in addition to the year-on-year variations at current exchange rates.
The information by areas is based on units at the lowest level and/or companies making up the Group, which are assigned to the different areas according to the main geographical area in which they carry out their activity.
Major income statement items by business area (Million euros)
Gross income (1), operating income (1) and net attributable profit breakdown (1) (Percentage. 2017)

(1) Excludes the Corporate Center.
(2) Includes the areas Banking activity in Spain and Non Core Real Estate.
Major balance sheet items and risk-weighted assets by business area (Million euros)
- (1) Non-current assets and liabilities held for sale (NCA&L) from the BBVA Chile and real estate operations.
Once the composition of each business area has been defined, certain management criteria are applied, of which the following are particularly important:
- Risk adjusted return. Calculation of risk adjusted return per transaction, customer, product, segment, unit and/or business area is sustained on ERC, which is based on the concept of unexpected loss at a specific confidence level, depending on the Group’s capital adequacy targets. The calculation of the ERC combines credit risk, market risk, structural balance-sheet risk, equity positions, operational risk, fixed-asset risk and technical risks in the case of insurance companies. These calculations are carried out using internal models that have been defined following the guidelines and requirements established under the Basel III capital accord.
- Internal transfer prices. BBVA Group has a transfer prices system whose general principles apply in the Bank's different entities, business areas and units.
- Allocation of operating expenses. Both direct and indirect costs are allocated to the business areas, except where there is no clearly defined relationship with the businesses, i.e. when they are of a clearly corporate or institutional nature for the Group as a whole.
- Cross-selling. In some cases, adjustments are required to eliminate shadow accounting entries that are registered in the earnings of two or more units as a result of cross-selling incentives.
Interest rates (Quarterly averages. Percentage)
Exchange rates (Expressed in currencies/euro)
Banking activity in Spain
Highlights
- Deleveraging and increase in more liquid resources and off-balance-sheet continue.
- Good performance of net fees and commissions.
- Reduction of operating expenses.
- Solid asset-quality indicators.
Business activity (1)
(Year-on-year change. Data as of 31-12-2017)

(1) Excluding repos.
Net interest income/ATAs
(Percentage)

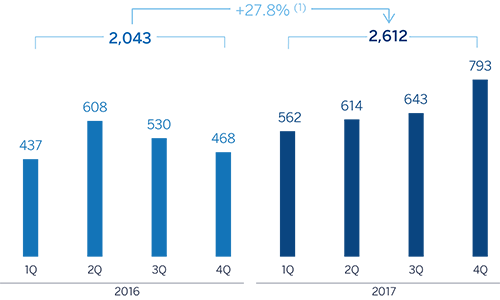
Operating income (Million euros)

Net attributable profit (Million euros)
Breakdown of performing loans under management (1)
(31-12-2017)

Breakdown of customer funds under management (1)
(31-12-2017)

Macro and industry trends
According to the latest information from the National Institute of Statistics (INE, according to the acronym in Spanish) the Spanish economy once more registered quarterly growth of 0.8% in the third quarter of 2017, maintaining relative stability over the year, thanks to stronger domestic demand. The most recent indicators point to slight moderation in the final part of the year, in a context of greater uncertainty, although the factors underlying growth continue in place and still suggest a solid growth in GDP. There is still a positive inertia in the data on activity and employment, as well as a more favorable global environment, while monetary policy continues expansive. As a result, GDP growth in the Spanish economy could be more than 3% 2017 as a whole.
Regarding the Spanish banking system, data from the Bank of Spain show that the total volume of private-sector lending (families and companies) continued its declining trend over the year (down 1.8% in the last twelve months through November 2017). However, since August there have been signs of a slight upturn in the total volume of credit in the economy, although it is still too weak to consider confirm that there has been a turning point. The cumulative volume of new lending through November 2017 showed year-on-year growth of 5.5%, with a rise in all portfolios (up 8.1% in the case of new lending to households and SMEs, which has risen consistently for 47 consecutive months). Non-performing loans in the sector continue to improve. As of November 2017, the NPL ratio was down until 8.1%, more than one percentage point below the previous year’s figure, despite the year-on-year fall in the lending volume. This improvement is therefore due to the reduction of the volume of non-performing assets in the system (down 13.9% in the last twelve months to November 2017 and down 48% compared to the maximum figure reached as of December 2013). The system's liquidity position continues to be comfortable. The funding gap (difference between the volume of loans and total deposits) fell to €129 billion, 5% of the total balance sheet of the system.
Activity
As of 31-Dec-2017, lending (performing loans under management) were down by 1.1% compared to the figure in December 2016 (up 0.6% over the quarter). This was primarily driven by a reduction in the mortgage (down 5.3% over the last twelve months and down 1.2% over the quarter) and the public sector portfolios (down 12.7% and 5.1% respectively). In contrast, commercial loans (up 6.4% since the close of 2016 and up 2.7% in the quarter), small businesses loans (up 2.7% and 2.6%, respectively), and consumer finance (up 46.0% and 13.8% respectively), have performed well, driven by the good performance of new loan production with cumulative year-on-year growth rates of 10.4% for businesses (including small businesses up to large corporations) and of 34.7% in consumer finance. It is worth noting that in 2017 there was a transfer of the outstanding portfolio of performing loans to developers for an amount exceeding €1bn from Non Core Real-Estate to Banking Activity in Spain.
Regarding asset quality, there was a further decline in NPLs balance. This decline has had a positive impact on the NPL ratio, which fell by 8 basis points over the last three months to 5.2%. The NPL coverage ratio stood at 50%.
Customer deposits under management were slightly reduced (down 0.9%) compared to the figure as of December 2016. By products, there was a further decline in time deposits (down 32.7% year-on-year and down 16.9% in the quarter), once again partially offset by an increase in current and savings accounts (up 20.2% and 6.3% respectively) and off-balance-sheet funds. The latter have continued their positive trend, with a year-on-year growth of 10.5% and 3.3% over the quarter. This performance was largely the result of increases in mutual funds (up 16.4% and 4.7%, respectively), and to a lesser extent, an increase in pension funds (up 2.4% and 1.3%, respectively).
Financial statements and relevant business indicators (Million euros. Percentage)
- (1) Includes premiums received net of estimated technical insurance reserves.
| Balance sheets |
31-12-17 |
∆% |
31-12-16 |
| Cash, cash balances at central banks and other demand deposits |
13,463 |
10.1 |
12,230 |
| Financial assets |
88,131 |
(12.2) |
100,394 |
| Loans and receivables |
213,037 |
(0.7) |
214,497 |
| of which loans and advances to customers |
183,172 |
1.1 |
181,137 |
| Inter-area positions |
1,501 |
(67.8) |
4,658 |
| Tangible assets |
877 |
(38.9) |
1,435 |
| Other assets |
2,409 |
(8.5) |
2,632 |
| Total assets/liabilities and equity |
319,417 |
(4.9) |
335,847 |
| Financial liabilities held for trading and designated at fair value through profit or loss |
36,817 |
(9.1) |
40,490 |
| Deposits from central banks and credit institutions |
62,226 |
(5.8) |
66,029 |
| Deposits from customers |
177,763 |
(1.5) |
180,544 |
| Debt certificates |
33,301 |
(13.1) |
38,322 |
| Inter-area positions |
- |
- |
- |
| Other liabilities |
391 |
(68.0) |
1,220 |
| Economic capital allocated |
8,920 |
(3.5) |
9,242 |
| Relevant business indicators |
31-12-17 |
∆% |
31-12-16 |
| Loans and advances to customers (gross) (1) |
177,764 |
(1.6) |
180,595 |
| Non-performing loans and contingent liabilities |
10,833 |
(8.3) |
11,819 |
| Customer deposits under management (2) |
173,283 |
(0.9) |
174,809 |
| Off-balance-sheet funds (3) |
62,054 |
10.5 |
56,147 |
| Risk-weighted assets |
111,825 |
(1.2) |
113,194 |
| Efficiency ratio (%) |
54.7 |
|
55.8 |
| NPL ratio (%) |
5.2 |
|
5.8 |
| NPL coverage ratio (%) |
50 |
|
53 |
| Cost of risk (%) |
0.31 |
|
0.32 |
- (1) Excluding repos.
- (2) Includes mutual funds, pension funds and other off-balance-sheet funds.
Results
The key aspects of the income statement in the area are:
- Fourth quarter net interest income was up 2.1% on the figure for the previous quarter. However, the 3.6% year-on-year cumulative decline in this item is the result of lower loan volumes and sales of wholesale portfolios.
- Good performance of net fees and commissions, thanks mainly to the positive contribution from wholesale businesses and the increase of those coming from mutual funds. They have increased by 5.7% compared to the figure at the end of 2016 .
- Smaller contribution from NTI relative to the figure for 2016, strongly affected by capital gains (€138m before tax) from the VISA deal in the second quarter of the previous year.
- Year-on-year increase of 17.9% in other income/expenses. Under this category it is worth highlighting the performance of the insurance activity, whose net result (included in this heading) grew by 9.6%, strongly linked to the increase in new policies contracting during the period and the low claims ratio.
- As a result, gross income declined by 3.7% year-on-year, mainly due to a smaller volume of lending, sales of wholesale portfolios and the NTI generated in the 2016 VISA deal.
- Very positive trend in operating expenses, which declined by 5.6% on the same period of 2016 (down 0.8% in the last quarter). This reduction was again linked to the synergies related to the integration of CX and the ongoing implementation of efficiency plans.
- As a result, the efficiency ratio closed the year at 54.7% (55.8% in 2016) and operating income was barely 1.3% below the figure registered in the previous year.
- Impairment losses on financial assets have declined 25.7% year-on-year as a result of lower loan-loss provisioning needs. The area's cumulative cost of risk continues improving, standing at 0.31% as of 31-Dec-2017.
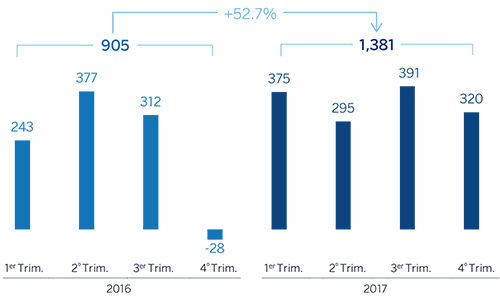
- Finally, the provisions (net) and other gains (losses) heading fell year-on-year by 54.3%, basically because in the fourth quarter of 2016 there was a charge of €577m before taxes (€404m after taxes) to cover the contingency of future claims by customers linked to the decision of the CJEU on "mortgage floor clauses" in consumer mortgage loans. This item also includes the costs resulting from the restructuring process involved.
As a result, the net attributable profit generated by Banking Activity in Spain in 2017 stood at €1,381m, a year-on-year increase of 52.7%, strongly influenced by the positive performance in the year of net fees and commissions, operating expenses and loan-loss provisions. Moreover, the figures for 2016 were influenced by the charge to cover the contingency for the aforementioned "mortgage floor clauses". Excluding this charge, the year-on-year profit of the area would grow by 5.5%.
Non Core Real Estate
Highlights
- Positive trend in Spanish real-estate sector figures continues.
- Agreement with Cerberus for the transfer of real-estate assets to a new company and subsequent sale of 80% of this company to Cerberus.
- Further decline in net exposure, NPLs and losses.
Industry trends
The real-estate market remains on an upward path. According to the latest available information from the Quarterly National Accounting for the third quarter of 2017, investment in housing increased by 0.7% over the previous quarter.
The most recent data from the General Council of Spanish Notaries (CIEN) shows that 432,500 homes were sold in Spain during the first ten months of 2017, a year-on-year increase of 16.4%. This trend reflects the growth of the economy and its capacity to generate employment, against a backdrop of low interest rates that is boosting new lending for home purchases. In addition, household confidence in the future of the economy has remained relatively high.
Growth of demand in a context of declining housing stock once more resulted in an increase in prices in the third quarter of 2017: According to data from the INE for the close of the third quarter, housing prices increased by 6.6% in year-on-year terms, one percentage point more than in the previous quarter. This is also the biggest rate of growth since the series was created in the first quarter of 2007.
Monetary policy has continued to maintain the cost of finance at relatively low levels, which has encouraged people to take out mortgage loans. The 12-month Euribor hit a new low in December (-0.190%). New residential mortgage lending, without stripping out refinancing, increased by 16.4% year-on-year in the first eleven months of the year, according to data from the Bank of Spain. Taking into account refinancing, new lending increased 1.7% in the same period.
Finally, construction activity is still responding to the positive impetus from demand. According to data from the Ministry of Public Works, nearly 68,100 new housing construction permits were approved from January to October 2017, up 28.0% on the figure from the same period in 2016.
Evolution of Net exposure to real-estate
(Million euros)

- (1) Compared to Bank of Spain’s Transparency scope (Circular 5/2011 dated November 30), real-estate developer loans do not include €2.1 Bn (December 2017) mainly related to developer performing loans transferred to the Banking activity in Spain area.
- (2) Other real-estate assets not originated from foreclosures.
Coverage of real-estate exposure (Million euros as of 31-12-2017)
- (1) Compared to Bank of Spain’s Transparency scope (Circular 5/2011 dated November 30), real-estate developer loans do not include €2.1 Bn (December 2017) mainly related to developer performing loans transferred to the Banking activity in Spain area.
- (2) Other real-estate assets not originated from foreclosures.
Activity
BBVA has taken another highly significant step forward in its strategy of reducing real-estate exposure. In the fourth quarter of 2017, BBVA reached an agreement with a subsidiary of Cerberus to create a joint venture to which part of BBVA’s real-estate business in Spain will be transferred. The business includes: (i) foreclosed real-estate assets, as described in the Significant Event published on November 29, 2017, for a gross value of approximately €13 billion (based on their situation as of June 26, 2017); and (ii) the assets and employees needed to manage the activity in an autonomous manner. In executing this agreement, BBVA will transfer the business to a single company, and at the closing date of the transaction, it will sell 80% of the shares in the said company to Cerberus.
For the purpose of this agreement, the business has been valued at approximately €5 billion, so the sale of 80% of the shares would amount to €4 billion. The final price paid will be determined by the volume of assets actually provided, which may vary depending on factors such as sales between the reference date of June 26, 2017 and the closing date of the transaction, and compliance with the normal conditions for transactions of this type. At the close of the transaction, which is expected to take place in the second half of 2018, and once the volume of assets actually transferred is known, its final impact will be determined both in the net attributable profit and in the Group's capital ratios.
From the point of view of loans to developers, it is worth noting that in 2017, the outstanding performing portfolio was transferred from Non Core Real Estate to Banking Activity in Spain for an amount exceeding €1bn.
Thus, as of 31-Dec-2017, the net exposure to the real-estate sector of €6,416m was down by 37.2% in year-on-year terms, due basically to the wholesale operations carried out over the year. These figures include all the assets in the Cerberus agreement, which will not mean a reduction in exposure until the transaction has been completed.
With respect to sales, 25,816 units were sold in 2017 for a total sale price of €2,121m. This represents a significant increase on 2016, both in the number of units and price.
Total real-estate exposure, including loans to developers, foreclosed and other assets, was reflected in a coverage ratio of 59% at the end of December 2017. The coverage ratio of foreclosed assets rose to 63%, a relatively high percentage given the proportion of these assets on the balance sheet.
Non-performing loans fell again, thanks to a low volume of net additions to NPL over the period and the sale of a non-performing loan portfolio in the third quarter. The NPL coverage ratio closed 31-Dec-2017 at 56%.
Results
This business area posted a cumulative loss of €501m in 2017, compared with the loss of €595m in 2016. This illustrates a decline in losses, together with a very significant reduction in real-estate exposure.
Financial statements (Million euros)
| Balance sheets |
31-12-17 |
∆% |
31-12-16 |
| Cash, cash balances at central banks and other demand deposits |
12 |
30.3 |
9 |
| Financial assets |
1,200 |
108.9 |
575 |
| Loans and receivables |
3,521 |
(40.8) |
5,946 |
| of which loans and advances to customers |
3,521 |
(40.8) |
5,946 |
| Inter-area positions |
- |
- |
- |
| Tangible assets |
0 |
- |
464 |
| Other assets |
4,981 |
(25.9) |
6,719 |
| Total assets/liabilities and equity |
9,714 |
(29.2) |
13,713 |
| Financial liabilities held for trading and designated at fair value through profit or loss |
- |
- |
- |
| Deposits from central banks and credit institutions |
- |
- |
- |
| Deposits from customers |
13 |
(47.6) |
24 |
| Debt certificates |
785 |
(5.8) |
834 |
| Inter-area positions |
5,775 |
(39.3) |
9,520 |
| Other liabilities |
(0) |
(62.7) |
(0) |
| Economic capital allocated |
3,141 |
(5.8) |
3,335 |
| Memorandum item: |
| Risk-weighted assets |
9,691 |
(10.8) |
10,870 |
The United States
Highlights
- Lending remained stable over the year.
- Increase in deposits from customers.
- Positive performance of net interest income and net fees and commissions.
- Solid risk indicators.
- Higher income tax charge due to the tax reform approved at the end of 2017.
Business activity (1)
(Year-on-year change at constant exchange rate. Data as of 31-12-2017)

(1) Excluding repos.
Net interest income/ATAs
(Percentage. Constant exchange rate)

Operating income
(Million euros at constant exchange rate)

(1) At current exchange rate: +22.9%.
Net attributable profit
(Million euros at constant exchange rate)
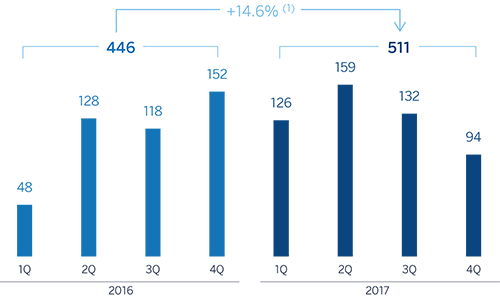
(1) At current exchange rate: +11.3%.
Breakdown of performing loans under management (1)
(31-12-2017)

Breakdown of customer funds under management (1)
(31-12-2017)

Macro and industry trends
According to the latest information from the Bureau of Economic Analysis (BEA), U.S. GDP grew again by over 3% in the third quarter of 2017 in annualized terms, consolidating the recovery after significant moderation at the end of 2016. The strength of the economy has benefited from a number of factors: The increased price of oil and the depreciation of the dollar boosted investment, while rising global demand favored the growth of exports. Consumer spending grew at a relatively stable and robust rate, despite the slowdown in the improvement of the labor market, an increase in inflation and slightly tougher financial conditions. The most recent indicators suggest economic activity slowed in the last quarter of the year, although this is temporary, following the end of the reconstruction work in the wake of the hurricanes. In all, the GDP may have closed the year with an increase of more than 2% in 2017, with a more balanced growth supported by both consumption and investment.
With regard to the currency market, the dollar's significant depreciation against the euro since the second quarter of 2017 was consolidated in the second half of the year, which recorded a year-on-year depreciation of 12.1%. This trend reflected on the one hand the progressive manner in which the Fed is carrying out the process of normalizing its monetary policy; and on the other, an economic performance in Europe that was somewhat better than expected, with the ECB announcing a gradual withdrawal of stimuli.
The U.S. banking system is in a very strong position. According to the latest available data from the Fed through November 2017, the total volume of bank credit in the system increased by 5.3% over the last twelve months. Growth of 2.6% recorded in the portfolios of lending to the real-estate sector (including residential mortgage loans) and 9.8% in consumer finance offset the 1.9% reduction in commercial lending. Non-performing loans in the system remained under control, with an NPL ratio of 1.82% at the close of 2017. Deposits were stable, with only a slight fall of 0.3% (November data).
Activity
All the comments below on rates of change, for both activity and earnings, will be given at constant exchange rate, unless expressly stated otherwise. These rates, together with changes at current exchange rate, can be seen in the attached tables of financial statements and relevant business indicators.
Following the increase in the third quarter of 2017, lending activity (performing loans under management) in the area grew again by 1.0% in the last quarter of the year. As a result, the balance of lending as of 31-Dec-2017 was practically the same as of the close of 2016 (down 0.1%). By portfolio, the growth was mainly focused on consumer finance and credit cards (up 3.5% in the quarter and 5.0% year-on-year), a portfolio with greater spread and thus more profitable; commercial loans (up 3.7% and 1.5% respectively) and the public sector (up 12.6% and 27.1% respectively).
With respect to asset quality, risk indicators in the area continued to be sound. The NPL ratio closed the year at 1.2% and the NPL coverage ratio at 104%.
Customer deposits under management increased both over the last twelve months (up 1.8%) and in the quarter (up 6.5%), thanks to the good performance of the more liquid lower-cost funds, such as current and savings accounts (up 3.4% year-on-year and 4.4% quarter-on-quarter). Time deposits grew significantly in the quarter (up 13.8%), although in year-on-year terms they fell by 5.6%.
Results
The United States generated a cumulative net attributable profit in 2017 of €511m, 14.6% up on the previous year, primarily due to the good performance of the more recurring revenue items. The most relevant aspects of the area's income statement are as follows:
- Net interest income continued to perform positively, with a cumulative figure rising by 13.0% in year-on-year terms. This was due to the combined result of the strategic measures adopted by BBVA Compass to improve loan yields and reduce the cost of liabilities (deposits and wholesale funding), as well as the Fed's interest-rate hikes (December 2016, March and June 2017).
- Income from fees and commissions increased by 4.1%. There was an outstanding performance in practically all items, notably those from account maintenance, asset management and retail investment banking (securities transactions, annuity sales, structured notes and life insurance).
- Reduction of 19.6% in NTI compared with the figure for the previous year. The positive performance of the Global Markets unit, particularly early in the year, has not been sufficient to offset the capital gains from portfolio sales in 2016.
- Increase of 3.2% in operating expenses, focused above all on administration costs. Within this item, general expenses showed an increase in costs related to IT, consulting and marketing.
- Impairment losses on financial assets increased by 10.8% on the previous year, due partly to the inclusion of provisions allocated as a result of the estimated negative impact of the natural disasters in the third quarter and higher loan-loss provisioning related to consumer portfolio. Despite the above, the cumulative cost of risk as of 31-Dec-2017 was 0.42%, three basis points below the cumulative figure as of 30-Sep-2017 (0.37% in 2016).
- Finally, income tax included a charge of €78m in the fourth quarter of 2017 as a result of the tax reform approved at the end of the year, which reduced the corporate tax rate from 35% to 21%, and as a result the value of deferred tax assets. However, the lower tax rate in 2018 should have a positive impact on earnings in the area.
Financial statements and relevant business indicators
(Million euros. Percentage)
| Balance sheets |
31-12-17 |
∆% |
∆%(1) |
31-12-16 |
| Cash, cash balances at central banks and other demand deposits |
11,089 |
39.3 |
58.4 |
7,963 |
| Financial assets |
11,154 |
(23.5) |
(13.0) |
14,581 |
| Loans and receivables |
55,419 |
(12.0) |
0.1 |
62,962 |
| of which loans and advances to customers |
54,406 |
(11.0) |
1.2 |
61,159 |
| Inter-area positions |
- |
- |
- |
- |
| Tangible assets |
658 |
(16.3) |
(4.8) |
787 |
| Other assets |
2,172 |
(16.7) |
(5.3) |
2,609 |
| Total assets/liabilities and equity |
80,493 |
(9.5) |
3.0 |
88,902 |
| Financial liabilities held for trading and designated at fair value through profit or loss |
139 |
(95.2) |
(94.5) |
2,901 |
| Deposits from central banks and credit institutions |
3,663 |
5.5 |
20.0 |
3,473 |
| Deposits from customers |
61,357 |
(6.7) |
6.2 |
65,760 |
| Debt certificates |
2,017 |
(17.5) |
(6.2) |
2,446 |
| Inter-area positions |
4,965 |
1.9 |
15.9 |
4,875 |
| Other liabilities |
5,560 |
(8.4) |
4.2 |
6,068 |
| Economic capital allocated |
2,791 |
(17.4) |
(6.0) |
3,379 |
| Relevant business indicators |
31-12-17 |
∆% |
∆%(1) |
31-12-16 |
| Loans and advances to customers (gross) (2) |
55,122 |
(11.1) |
1.2 |
62,000 |
| Non-performing loans and contingent liabilities |
696 |
(28.6) |
(18.8) |
976 |
| Customer deposits under management (3) |
56,547 |
(10.5) |
1.8 |
63,195 |
| Off-balance-sheet funds (4) |
- |
- |
- |
- |
| Risk-weighted assets |
58,682 |
(10.4) |
1.9 |
65,492 |
| Efficiency ratio (%) |
63.7 |
|
|
68.1 |
| NPL ratio (%) |
1.2 |
|
|
1.5 |
| NPL coverage ratio (%) |
104 |
|
|
94 |
| Cost of risk (%) |
0.42 |
|
|
0.37 |
- (1) Figures at constant exchange rate.
- (2) Excluding repos.
- (3) Includes mutual funds, pension funds, and other off-balance-sheet funds.
Mexico
Highlights
- Good performance in activity.
- Positive trend in gross income.
- Costs continue to increase below gross income, and double-digit year-on-year growth in net attributable profit.
- Stable asset quality indicators.
Business activity (1)
(Year-on-year change at constant exchange rate. Data as of 31-12-2017)

(1) Excluding repos.
Net interest income/ATAs
(Percentage. Constant exchange rate)

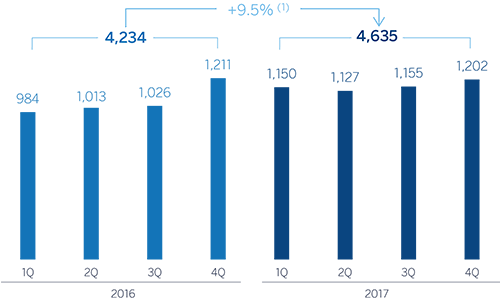
Operating income
(Million euros at constant exchange rate)
Net attributable profit
(Million euros at constant exchange rate)
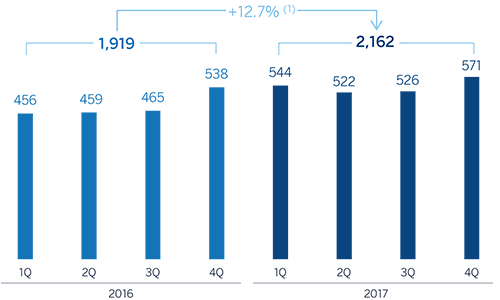
(1) At current exchange rate: +6.0%.
(1) At current exchange rate: +9.2%.
Breakdown of performing loans under management (1)
(31-12-2017)

Breakdown of customer funds under management (1)
(31-12-2017)

Macro and industry trends
Following the slowdown of activity in Mexico in the first half of 2017, the negative impact of natural phenomena led to a 0.3% quarterly decline in the third quarter. The adverse effect was noted in more sluggish consumption, also affected by increased inflation, and the decline in oil production and construction. However, this fall should be temporary and improve steadily with the boost from consumption of goods and services to help the victims of the disasters. As a result, GDP growth could have moderated to around 2% in 2017 as a whole, mainly supported by private consumption. However, investment was affected by the increased uncertainty linked to the negotiations of the trade agreement with the United States.
The significant depreciation of the peso in the first half of 2017 affected the behavior of inflation over the year, which remained high and reached rates of around 6.5% in recent months. In this context, Banxico increased interest rates by 150 basis points to 7.25%. Despite the uncertainty and volatility, the depreciation of the peso has been checked, so this effect on inflation began to decline in recent months.
The Mexican banking system has sustained excellent capital adequacy and asset quality levels over recent years. According to data released by the National Securities Banking Commission (CNBV, according to its acronym in Spanish), the capital adequacy ratio rose slightly to 15.73% in the third quarter. All the banks in the system registered ratios well above minimum requirements. The data on activity remained as strong as in previous quarters, with year-on-year growth in total lending of 8.9% and the total volume of deposits of 10.0%, as of November 2017. By portfolios, commercial loans grew by 12.2%, consumer finance by 8.5% and residential mortgage loans by 8.7%. Non-performing loans remained under control, with an NPL ratio of 2.2%, slightly below the November 2016 figure. The NPL coverage ratio remained relatively stable over the last twelve months, at 155%. Demand deposits grew by 8.6% to November 2017 in year-on-year terms, while time deposits increased by 19.4%.
Activity
All rates of change given below, for both activity and earnings, will be given at constant exchange rate, unless expressly stated otherwise. These rates, together with changes at current exchange rate, can be seen in the attached tables of financial statements and relevant business indicators.
BBVA's lending (performing loans under management) in Mexico increased by 5.5% since December 2016 and 0.9% over the fourth quarter. As a result, BBVA Bancomer has retained its leadership position, with a market share for its performing portfolio of 23.0% (according to the latest local information from the CNBV as of November 2017).
The weight of the retail and wholesale portfolios was practically equal at the end of December (51% and 49% respectively). Wholesale lending was up 5.0% on December 2016 and 0.8% over the quarter. Within the wholesale portfolio, business loans (including loans to corporate clients and mid-sized companies, not including developer mortgage loans) grew by 8.7% on the close of 2016. Lending to housing developers continued the positive trend that began in the previous quarter, with year-on-year growth of 4.6%.
The retail portfolio registered growth of 6.0% over the last twelve months and 1.0% in the last quarter, buoyed by lending to SMEs and auto loans, which rose by 9.0% and 11.4% respectively in year-on-year terms. Meanwhile, credit cards increased by 2.6% over the year, with new production during this period of 8.3%. The mortgage portfolio continued to show the effect of early maturities on the overall amount, which increased year-on-year by 6.4% as of 31-Dec-2017.
This lending growth has been accompanied by stable asset quality indicators. The NPL and NPL coverage ratios closed the year at 2.3% and 123% respectively.
Total customer funds (customer deposits under management, mutual funds, and other off-balance-sheet funds) posted year-on-year growth of 11.4% (up 1.3% in the fourth quarter). All items continued to perform positively: current and savings accounts rose 11.5% year-on-year (up 1.5% on the previous quarter), and time deposits grew by 13.1% (up 0.4% over the quarter). BBVA in Mexico has a profitable funding mix, with low-cost items continuing to account for over 81% of total customer deposits under management. Finally, there was also an increase in mutual funds of 9.3% year-on-year and 1.0% over the quarter.
Results
The highlights of Mexico's income statement for 2017 are as follows:
- Positive performance of net interest income, with a year-on-year increase of 9.5%, driven primarily by greater activity volumes and favorable customer spreads.
- Good performance of net fees and commissions, with growth of 9.3% over the last twelve months. They remained strongly influenced by an increased volume of transactions with credit card customers and fees from online and investment banking.
- Strong growth in NTI (up 15.9% year-on-year), thanks to a very good performance from the Global Markets unit, basically in the first half of the year.
- In other income/expenses the comparison with last year is unfavorable (down 32.2% year-on-year), mainly due to insurance activity, as a result of a higher claims rate derived from the natural disasters that took place during the year.
- Operating expenses continued to grow at a controlled pace (up 5.3% year-on-year), below both the area's gross income growth of 8.0% and the country's inflation rate. As a result, the efficiency ratio stood at 34.5%.
- Year-on-year growth in impairment losses on financial assets (up 4.9%) was below that registered by lending (up 5.5%). As a result, the cumulative cost of risk in the area was 3.30%, six basis points below the cumulative figure through September and ten basis points less than that in 2016.
Overall, BBVA in Mexico posted a net attributable profit for the year of €2,162m, a year-on-year increase of 12.7%.
Financial statements and relevant business indicators (Million euros. Percentage)
| Balance sheets |
31-12-17 |
∆% |
∆%(1) |
31-12-16 |
| Cash, cash balances at central banks and other demand deposits |
4,882 |
(6.0) |
2.2 |
5,192 |
| Financial assets |
28,541 |
(8.7) |
(0.8) |
31,273 |
| Loans and receivables |
46,977 |
(2.1) |
6.4 |
47,997 |
| of which loans and advances to customers |
45,080 |
(3.0) |
5.4 |
46,474 |
| Tangible assets |
1,749 |
(10.6) |
(2.8) |
1,957 |
| Other assets |
7,195 |
4.3 |
13.3 |
6,900 |
| Total assets/liabilities and equity |
89,344 |
(4.3) |
4.1 |
93,318 |
| Financial liabilities held for trading and designated at fair value through profit or loss |
9,405 |
(5.6) |
2.6 |
9,961 |
| Deposits from central banks and credit institutions |
5,769 |
(2.6) |
5.9 |
5,923 |
| Deposits from customers |
49,414 |
(2.3) |
6.2 |
50,571 |
| Debt certificates |
7,312 |
(15.1) |
(7.7) |
8,611 |
| Other liabilities |
13,642 |
(2.1) |
6.3 |
13,941 |
| Economic capital allocated |
3,802 |
(11.8) |
(4.2) |
4,311 |
| Relevant business indicators |
31-12-17 |
∆% |
∆%(1) |
31-12-16 |
| Loans and advances to customers (gross) (2) |
46,463 |
(2.9) |
5.5 |
47,865 |
| Non-performing loans and contingent liabilities |
1,124 |
(2.5) |
6.0 |
1,152 |
| Customer deposits under management (2) |
43,179 |
2.8 |
11.8 |
41,989 |
| Off-balance-sheet funds (3) |
19,472 |
1.9 |
10.7 |
19,111 |
| Risk-weighted assets |
43,715 |
(8.7) |
(0.7) |
47,863 |
| Efficiency ratio (%) |
34.5 |
|
|
35.4 |
| NPL ratio (%) |
2.3 |
|
|
2.3 |
| NPL coverage ratio (%) |
123 |
|
|
127 |
| Cost of risk (%) |
3.30 |
|
|
3.40 |
(1) Figures at constant exchange rate.
(2) Excluding repos.
(3) Includes mutual funds, pension funds and other o -balance-sheet funds.
Turkey
Highlights
- Solid growth in activity.
- Very positive growth in more recurring revenue items.
- Operating expenses increase below the level of inflation and the rate of increase in gross income.
- Risk indicators affected by more additions to NPL from certain wholesale loans that are practically fully provisioned.
Business activity (1)
(Year-on-year change at constant exchange rate. Data as of 31-12-2017)

(1) Excluding repos.
Net interest income/ATAs
(Percentage. Constant exchange rate)

Operating income
(Million euros at constant exchange rate)
(1) At current exchange rate: +3.7%.
Net attributable profit
(Million euros at constant exchange rate)
(1) At current exchange rate: +37.9%.
Breakdown of performing loans under management (1)
(31-12-2017)

(1) Excluding repos.
Breakdown of customer funds under management (1)
(31-12-2017)

(1) Excluding repos.
Macro and industry trends
According to the most recent figures from the Turkish Statistical Institute, year-on year economic growth rose to 11.1% in the third quarter of 2017. Government stimuli appear to be leveraging growth via private consumption, which is increasing household confidence, and by encouraging investment through access to credit facilities fostered by the Credit Guarantee Fund (CGF). BBVA Research has therefore revised its economic growth forecast up to 7% in 2017.
Annual inflation remained high, closing December at 11.9%, after reaching 13% in November, thanks to favorable base effects. The reduction was due to a significant upturn a year ago. Solid domestic demand and the exchange-rate effect increased core inflation to 12.3% at the end of 2017.
In this context of high inflation the CBRT kept its monetary policy tight. Since the end of last year, there has been an increase of around 450 basis points in the average funding rate, from 8.31% to 12.75%, (just over 75 basis points in the fourth quarter). The risk appetite in global financial markets will continue to have a key effect on the exchange rate.
The Turkish financial sector has showed signs of strength in 2017, thanks to access to the credit facilities fostered by the government-sponsored CGF program. Although the year-on-year growth rate in total lending (adjusted for the effect of the depreciation of the lira) stood at 20.5% at the end of December (compared to 20.4% as of September), the rate moderated in the second half of the year. Commercial loans ended the year with a higher growth rate than consumer loans, which is good for financial stability. Deposits from customers also maintained their strength, with year-on-year growth in December (adjusted for the effect of the depreciation of the lira) of 12.0%. Foreign-currency deposits grew by 15.3%, mainly due to the comparison with the very low figure at the same period last year, and Turkish lira deposits increased 12.6%. Lastly, the NPL ratio in the sector improved in 2017, closing the year at 2.9% (3.2% at the close of 2016).
Activity
In March 2017, BBVA completed the acquisition of an additional 9.95% stake in the share capital of Garanti, increasing BBVA's total stake in this entity to 49.85%. Garanti continues to be incorporated into the Group's financial statements by the full integration method.
Unless expressly stated otherwise, all the comments below on rates of change, for both activity and earnings, will be given at constant exchange rate. These rates, together with changes at current exchange rate, can be seen in the attached tables of financial statements and relevant business indicators.
The growth of lending activity (performing loans under management) in the area rose to 13.9% in year-on-year terms, mainly driven by Turkish lira loans. By segments, business banking loans performed very favorably throughout the year, thanks to the aforementioned CGF program launched at the start of the year. General purpose loans also performed well. In mortgages, Garanti gained market share among private banks thanks to using alternative sale channels effectively and providing flexible payment plan options. Garanti also performed positively, above the average of its private-sector peers, in auto loans, and strengthened its leading position in the credit card segment, thanks to the increase in both commercial and consumer credit cards.
In terms of asset quality, the NPL ratio rose to 3.9% as a result of increased additions to NPLs from certain wholesale loans, although they were practically fully provisioned (with hardly any impact on results). The NPL coverage ratio closed at 85%.
Customer deposits remained the main source of funding for the balance sheet in the area, and grew by 14.9% in 2017 (up 4.6% in the last quarter). Both, Turkish lira and foreign currency deposits grew in year-on-year terms, with current and savings accounts performing well and continuing to support growth in net interest income growth: they have almost zero cost and represent 26% of total customer deposits in Garanti.
Results
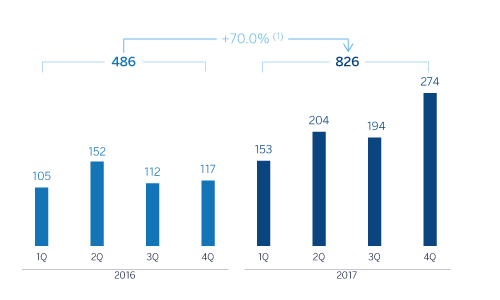
Turkey generated a cumulative net attributable profit of €826m in 2017, up 70.0% compared with the figure in 2016. The most significant aspects of the year-on-year changes in the income statement were as follows:
- Positive performance of net interest income (up 20.6%). This positive trend is a result of increased in activity, good management of customer spreads (despite the increase in cost of funding), higher income from inflation-linked bonds (CPI linkers).
- Income from fees and commissions increased 18.5% year-on-year, thanks to good diversification (payment systems, money transfers, loans, insurance and brokerage). This positive performance has been achieved despite the lower generation of fees from account maintenance due to the suspension of charges in the retail segment implemented by the Turkish Council of State as of January, 2016, and the high revenues generated in 2016 by the Miles & Smiles program.
- Reduction of NTI (down 76.8%), mainly due to the higher base of comparison due to the capital gains generated in the first half of 2016 from the VISA deal.
- Overall, gross income was up 19.2% in 2017.
- Operating expenses increased by 6.6%, below both the inflation rate and the year-on-year growth rate in gross income, thanks to strict cost discipline. As a result, the efficiency ratio declined to 36.5% (40.8% in 2016).
- Impairment losses on financial assets rose by 7.3% year-on-year, less than the rise in lending activity. As a result, the cumulative cost of risk of the area closed 2017 at 0.82%, below the level of 2016 (0.87%).
- Finally, BBVA Group’s additional stake of 9.95% in the capital of Garanti had a positive effect on reducing the non-controlling interest heading by approximately €150m.
Financial statements and relevant business indicators (Million euros. Percentage)
| Balance sheets |
31-12-17 |
∆% |
∆%(1) |
31-12-16 |
| Cash, cash balances at central banks and other demand deposits |
4,036 |
48.2 |
81.7 |
2,724 |
| Financial assets |
11,819 |
(13.5) |
6.0 |
13,670 |
| Loans and receivables |
59,683 |
(7.9) |
12.9 |
64,814 |
| of which loans and advances to customers |
51,378 |
(7.6) |
13.3 |
55,612 |
| Tangible assets |
1,344 |
(6.0) |
15.3 |
1,430 |
| Other assets |
1,812 |
(18.7) |
(0.3) |
2,229 |
| Total assets/liabilities and equity |
78,694 |
(7.3) |
13.7 |
84,866 |
| Financial liabilities held for trading and designated at fair value through profit or loss |
648 |
(35.8) |
(21.3) |
1,009 |
| Deposits from central banks and credit institutions |
11,195 |
(17.0) |
1.8 |
13,490 |
| Deposits from customers |
44,691 |
(5.4) |
16.0 |
47,244 |
| Debt certificates |
8,346 |
5.5 |
29.4 |
7,907 |
| Other liabilities |
11,321 |
(12.1) |
7.7 |
12,887 |
| Economic capital allocated |
2,493 |
7.0 |
31.3 |
2,330 |
| Relevant business indicators |
31-12-17 |
∆% |
∆%(1) |
31-12-16 |
| Loans and advances to customers (gross) (2) |
53,445 |
(7.8) |
13.1 |
57,941 |
| Rasgos dudosos |
2,553 |
28.8 |
58.0 |
1,982 |
| Customer deposits under management (2) |
44,499 |
(6.3) |
14.9 |
47,489 |
| Off-balance-sheet funds (3) |
3,902 |
4.0 |
27.5 |
3,753 |
| Risk-weighted assets |
62,768 |
(10.8) |
9.4 |
70,337 |
| Efficiency ratio (%) |
36.5 |
|
|
40.8 |
| NPL ratio (%) |
3.9 |
|
|
2.7 |
| NPL coverage ratio (%) |
85 |
|
|
124 |
| Cost of risk (%) |
0.82 |
|
|
0.87 |
(1) Figures at constant exchange rate.
(2) Excluding repos.
(3) Includes mutual funds, pension funds and other off-balance-sheet funds.
South America
Highlights
- Activity continues to grow at a good pace.
- More recurring revenue items performing very well.
- Expenses grow below gross income.
- Stable risk indicators.
Business activity (1)
(Year-on-year change at constant exchange rates. Data as of 31-12-2017)

(1) Excluding repos.
Net interest income/ATAs
(Percentage. Constant exchange rates)

Operating income
(Million euros at constant exchange rates)
(1)At current exchange rates: +13.1%.
Net attributable profit
(Million euros at constant exchange rates)
(1) At current exchange rates: +11.6%.
Breakdown of performing loans under management (1)
(31-12-2017)

(1) Excluding repos.
Breakdown of customer funds under management (1)
(31-12-2017)

(1) Excluding repos.
Macro and industry trends
The economies of South America consolidated their recovery in 2017, though the pace of growth was still moderate. The external environment improved due to rising global demand and commodity prices, and this was accompanied by a gradual increase in confidence among agents in the region. At the same time, the buoyant financial markets have stimulated capital flows into the emerging economies. The result has been a strong export sector, growth in investment and early signs of an improvement in consumption.
In most countries in the region, inflation moderated in 2017 as a result of relatively stable exchange rates and weak domestic demand. Against this backdrop of low inflationary pressure and very moderate growth, the central banks continued to apply expansive monetary policies (except in Argentina).
Regarding the banking systems within BBVA's regional footprint, the macroeconomic backdrop and reduced levels of banking penetration in these countries in aggregate terms (obviously with differences between countries) led to strong results in terms of the main indicators of profitability and solvency, while non-performing loans remained under control. In addition, there has been sustained growth in lending and deposits.
Activity
All the comments below on rates of change, for both activity and earnings, will be given at constant exchange rate, unless expressly stated otherwise. These rates, together with changes at the current exchange rate, can be seen in the attached tables of financial statements and relevant business indicators.
Growth in lending (performing loans under management) accelerated in the last quarter of the year, and closed 9.7% above the figure at the end of December 2016 and 4.5% up on the close of September. By segments, the strong performance of the individual customer segment (particularly consumer finance, credit cards and, to a lesser extent, mortgages) outpaced growth in the commercial and public sector (wholesale portfolio). By country, the fastest growth continued to be in Argentina (up 65.8% year-on-year), Colombia (up 8.5%) and Chile (up 6.7%).
With respect to credit quality, there was a slight improvement in the NPL ratio over the quarter, closing the year at 3.4%. The NPL coverage ratio ended the year at 89%.
Total customer funds ended 2017 with quarterly growth of 5.2% and year-on-year growth of 10.5%. The trend over the year is explained by the good performance of transactional funds (up 16.3% since December 2016) and off-balance-sheet funds (up 16.6%). By countries, the trend was particularly positive in Argentina (up 37.3% on December 2016) and Colombia (up 12.9%).
Results
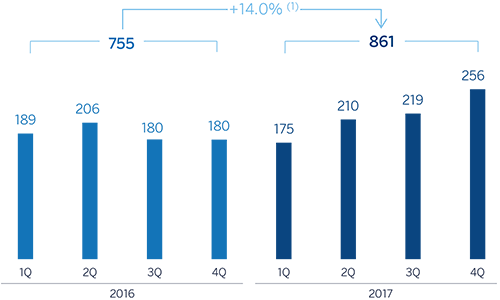
South America posted a cumulative net attributable profit of €861m in 2017, a year-on-year increase of 14.0%. The key aspects of the income statement in this area were:
- Gross income grew by 13.9%, thanks to the capacity to generate recurring revenues in the area. Net interest income outpaced growth in the loan book (up 15.1%), on the back of greater volumes and effective price management, while income from fees and commissions rose by 17.9%. The contribution from NTI was also positive, favored by improved results from foreign-currency operations.
- Operating expenses increased by less than gross income (up 12.4%) due to cost controls implemented in all the countries. In fact, they also increased below or in line with the average inflation in most of the countries.
- Impairment losses on financial assets moderated their year-on-year growth with respect to the previous quarter, with a cumulative increase of 26.1%. This heading is affected by the impact of provisions associated with one particular customer. However, the slowdown allowed the cumulative cost of risk to reach 1.32% at the close of December, slightly below the third quarter of 2017 (1.51%).
By country, recurring revenues performed very well in Argentina, with notable growth in both net interest income and the excellent performance of net fees and commissions, which contributed to a growth in gross income of 25.0%. However, expenses remained affected by high inflation. In July, BBVA Francés carried out a USD 400m share capital increase to finance the bank's organic growth, given the country's good economic outlook. The transaction has resulted in a higher charge under the non-controlling interests heading. As a result, net attributable profit increased by 19.1% year-on-year. In Chile, positive trend in gross income (net interest income up thanks to favorable figures in lending and effective management of customer spreads) and strict control of growth in expenses comfortably offset the rise in loan-loss provisioning and the increase in the nominal tax rate. Accordingly, the country recorded a rise of 27.0% in net attributable profit relative to 2016. In Colombia, gross income performed strongly, thanks to positive figures from net interest income (due to both activity and spreads) and net fees and commissions, albeit mitigated by lower NTI (the same period of 2016 included capital gains from the disposal of equity holdings) and an increase in loan-loss provisioning. As a result, net attributable profit was 8.5% lower than in 2016. In Peru, net attributable profit grew by 6.0% when compared to the figure for the previous year. The good NTI performance, strict control of expenses and a reduction of loan-loss provisions were partly mitigated by moderate growth in recurring revenues.
Financial statements and relevant business indicators (Million euros. Percentage)
| Balance sheets |
31-12-17 |
∆% |
∆%(1) |
31-12-16 |
| Cash, cash balances at central banks and other demand deposits |
9,039 |
(14.6) |
5.2 |
10,586 |
| Financial assets |
11,742 |
9.3 |
20.5 |
10,739 |
| Loans and receivables |
51,207 |
(5.3) |
6.4 |
54,057 |
| of which loans and advances to customers |
48,272 |
(0.9) |
11.2 |
48,718 |
| Tangible assets |
725 |
(10.1) |
13.5 |
807 |
| Other assets |
1,923 |
11.2 |
25.1 |
1,729 |
| Total assets/liabilities and equity |
74,636 |
(4.2) |
8.7 |
77,918 |
| Financial liabilities held for trading and designated at fair value through profit or loss |
2,823 |
9.2 |
16.0 |
2,585 |
| Deposits from central banks and credit institutions |
7,552 |
13.5 |
23.7 |
6,656 |
| Deposits from customers |
45,666 |
(4.7) |
10.0 |
47,927 |
| Debt certificates |
7,209 |
(3.2) |
4.0 |
7,447 |
| Other liabilities |
8,505 |
(19.8) |
(9.0) |
10,600 |
| Economic capital allocated |
2,881 |
6.6 |
23.5 |
2,703 |
| Relevant business indicators |
31-12-17 |
∆% |
∆%(1) |
31-12-16 |
| Loans and advances to customers (gross) (2) |
49,845 |
(0.9) |
11.2 |
50,316 |
| Non-performing loans and contingent liabilities |
1,884 |
15.1 |
26.8 |
1,637 |
| Customer deposits under management (3) |
45,676 |
(5.5) |
9.0 |
48,334 |
| Off-balance-sheet funds (4) |
12,197 |
2.5 |
16.6 |
11,902 |
| Risk-weighted assets |
55,665 |
(3.1) |
11.5 |
57,443 |
| Efficiency ratio (%) |
45.1 |
|
|
46.7 |
| NPL ratio (%) |
3.4 |
|
|
2.9 |
| NPL coverage ratio (%) |
89 |
|
|
103 |
| Cost of risk (%) |
1.32 |
|
|
1.15 |
- (1) Figures at constant exchange rates.
- (2) Excluding repos.
- (3) Includes mutual funds, pension funds and other off-balance-sheet funds.
South America. Data per country (Million euros)
- (1) Figures at constant exchange rates.
- (2) Venezuela, Paraguay, Uruguay and Bolivia. Additionally, it includes eliminations and other charges.
South America. Relevant business indicators per country (Million euros)
|
Argentina |
Chile |
Colombia |
Peru |
|
31-12-17 |
31-12-16 |
31-12-17 |
31-12-16 |
31-12-17 |
31-12-16 |
31-12-17 |
31-12-16 |
| Loans and advances to customers (gross) (1,2) |
5,856 |
3,392 |
15,067 |
14,028 |
12,475 |
11,240 |
13,309 |
13,247 |
| Deposits from customers |
45 |
36 |
420 |
404 |
672 |
455 |
645 |
649 |
| Customer deposits under management (1,3) |
6,779 |
5,046 |
9,687 |
9,619 |
12,288 |
11,222 |
12,019 |
12,186 |
| Off-balance sheet funds (1,4) |
1,253 |
805 |
1,295 |
1,428 |
1,118 |
655 |
1,581 |
1,385 |
| Risk-weighted assets |
9,364 |
8,717 |
14,300 |
14,300 |
12,249 |
12,185 |
14,750 |
17,400 |
| Efficiency ratio (%) |
56.1 |
53.8 |
45.2 |
49.1 |
36.0 |
38.9 |
35.6 |
35.8 |
| NPL ratio (%) |
0.8 |
0.8 |
2.6 |
2.6 |
5.3 |
3.5 |
3.8 |
3.4 |
| NPL coverage ratio (%) |
198 |
391 |
60 |
66 |
88 |
105 |
100 |
106 |
| Cost of risk (%) |
0.61 |
1.48 |
0.76 |
0.74 |
2.59 |
1.34 |
1.13 |
1.31 |
- (1) Figures at constant exchange rates.
- (2) Excluding repos.
- (3) Excluding repos and including speci c marketable debt securities.
- (4) Includes mutual funds, pension funds and other off-balance-sheet funds.
Rest of Eurasia
Highlights
- Positive trend in lending in Europe.
- Trend in deposits strongly influenced by the negative interest-rate environment.
- Earnings down due to lower revenues, despite the good performance of expenses and loan-loss provisions.
- Good performance of asset quality indicators.
Macro and industry trends
The Eurozone economy continued to post solid growth in 2017. In accordance with information from Eurostat, GDP in the region grew at a relatively stable rate of around 0.6% in the first three quarters of the year. The most recent indicators suggest that this growth was maintained in the final part of the year. The improving labor market and increased confidence, alongside favorable financing conditions, underpinned momentum in consumption and investment. The latter factors were also boosted by increased global demand and the impact of growth in exports, which were not greatly affected by the appreciation of the euro over the year. As a result, the economy could have grown by around 2.4% overall in 2017. Despite the solid growth of domestic demand, inflation continued to moderate, below the ECB target, and the core component was relatively stable at around 1.1%. In this context, the ECB remains cautious and will continue to apply an accommodative monetary policy, steadily reducing asset purchases starting in January 2018 but extending the program at least until September.
Activity and result
This business area basically includes the Group's retail and wholesale business in Europe (excluding Spain) and Asia.
The lending activity (performing loans under management) in the area fell year-on-year by 2.7% at the close of 2017. In the rest of Europe there was growth of 1.6%, which did not offset the reduction in Asia of 19.1%.
Regarding the main credit credit risk indicators, the NPL ratio closed at 2.4% in December (2.6% in September 2017, and 2.7% in December 2016) and the NPL coverage ratio closed at 74% (85% as of 30-Sep-2017 and 84% as of 31-Dec-2016).
Customer deposits under management were still strongly influenced by the environment of negative interest rates. With data as of December 2017 they fell by 28.6% year-on-year (down 15.6% in Europe and down 79.3% in Asia).
Regarding earnings, gross income declined 4.8% year-on-year, with the figures differing from geographic area: Rest of Europe showed growth of 12.1%, while Asia posted a decline of 62.3%, mainly due to the payment of the CNCB dividend in 2016. Operating expenses continue to moderate (down 9.9% year-on-year), mainly due to control of all cost items (personnel, other administrative expenses and depreciation). Finally, there was also a decline in impairment losses on financial assets, as a result of which this geography contributed a cumulative net attributable profit in 2017 of €125m, 17.4% less than in 2016.
Financial statements and relevant business indicators (Million euros. Percentage)
| Balance sheets |
31-12-17 |
∆% |
31-12-16 |
| Cash, cash balances at central banks and other demand deposits |
877 |
(34.4) |
1,337 |
| Financial assets |
990 |
(44.6) |
1,787 |
| Loans and receivables |
15,009 |
(3.6) |
15,574 |
| of which loans and advances to customers |
14,864 |
(3.0) |
15,325 |
| Inter-area positions |
- |
- |
- |
| Tangible assets |
36 |
(6.3) |
38 |
| Other assets |
352 |
(4.6) |
369 |
| Total assets/liabilities and equity |
17,265 |
(9.6) |
19,106 |
| Financial liabilities held for trading and designated at fair value through profit or loss |
45 |
(33.4) |
67 |
| Deposits from central banks and credit institutions |
2,364 |
(11.5) |
2,670 |
| Deposits from customers |
6,700 |
(28.7) |
9,396 |
| Debt certificates |
354 |
12.4 |
315 |
| Posiciones inter-áreas pasivo |
5,643 |
17.0 |
4,822 |
| Other liabilities |
1,246 |
116.0 |
577 |
| Economic capital allocated |
913 |
(27.5) |
1,259 |
| Relevant business indicators |
31-12-17 |
∆% |
31-12-16 |
| Loans and advances to customers (gross) (1) |
15,261 |
(3.6) |
15,835 |
| Non-performing loans and contingent liabilities |
556 |
(12.1) |
633 |
| Customer deposits under management (1) |
6,660 |
(28.6) |
9,322 |
| Off-balance-sheet funds (2) |
376 |
2.7 |
366 |
| Risk-weighted assets |
12,916 |
(17.4) |
15,637 |
| Efficiency ratio (%) |
65.9 |
|
69.6 |
| NPL ratio (%) |
2.4 |
|
2.7 |
| NPL coverage ratio (%) |
74 |
|
84 |
| Cost of risk (%) |
(0.16) |
|
(0.22) |
(1) Excluding repos.
(2) Includes mutual funds, pension funds and other off-balance-sheet funds.
Corporate Center
The Corporate Center basically includes the costs of the head offices that have a corporate function; management of structural exchange-rate positions; specific issues of equity instruments to ensure adequate management of the Group's global solvency; portfolios and their corresponding results, whose management is not linked to customer relations, such as industrial holdings; certain tax assets and liabilities; funds due to commitments with employees; goodwill and other intangibles.
The Corporate Center's income statement has been influenced by the recognition of the impairment losses of €1,123m from BBVA's stake from Telefónica, S.A.
- Greater contribution from NTI than last year, mainly due to the recording of €228m in pre-tax capital gains from the sale of the stake in CNCB (€204m in the first quarter for the sale of 1.7% and €24m in the third quarter for the disposal of the remaining 0.34%). In 2016 there was also a sale of 0.75% in the third quarter with lower capital gains.
- Reduction in the other income/expenses heading (down 54.5% year-on-year), mainly impacted by the cut in the dividend paid by Telefónica.
- Moderation of operating expenses, which remained at similar levels to those of 2016 (up 0.9% year-on-year).
As a result, the Corporate Center had a net attributable loss of €1,844m, which compares with a loss of €794m in 2016. Excluding the effect of the impairment losses in Telefónica, the net attributable loss was €722m.
Financial statements (Million euros. Percentage)
| Balance sheets |
31-12-17 |
∆% |
31-12-16 |
| Cash, cash balances at central banks and other demand deposits |
5 |
n.s. |
(2) |
| Financial assets |
2,520 |
50.4 |
1,675 |
| Loans and receivables |
- |
- |
130 |
| of which loans and advances to customers |
- |
- |
130 |
| Posiciones inter-áreas activo |
(1,501) |
(67.8) |
(4,658) |
| Tangible assets |
1,893 |
(6.4) |
2,023 |
| Other assets |
17,579 |
(7.6) |
19,017 |
| Total assets/liabilities and equity |
20,496 |
12.7 |
18,186 |
| Financial liabilities held for trading and designated at fair value through profit or loss |
- |
- |
- |
| Deposits from central banks and credit institutions |
- |
- |
- |
| Deposits from customers |
- |
- |
- |
| Debt certificates |
8,772 |
(16.4) |
10,493 |
| Posiciones inter-áreas pasivo |
(16,384) |
(14.7) |
(19,217) |
| Other liabilities |
443 |
(83.4) |
2,666 |
| Economic capital allocated |
(24,941) |
(6.1) |
(26,559) |
| Shareholders’ funds |
52,606 |
3.5 |
50,803 |