Group information
BBVA Group highlights
BBVA Group highlights (Consolidated figures)
| 31-12-17 | ∆% | 31-12-16 | 31-12-15(4) | |
|---|---|---|---|---|
| Balance sheet (million euros) | ||||
| Total assets | 690,059 | (5.7) | 731,856 | 749,855 |
| Loans and advances to customers (gross) | 400,369 | (7.0) | 430,474 | 432,855 |
| Deposits from customers | 376,379 | (6.2) | 401,465 | 403,362 |
| Other customer funds | 134,906 | 2.1 | 132,092 | 131,822 |
| Total customer funds | 511,285 | (4.2) | 533,557 | 535,184 |
| Total equity | 53,323 | (3.8) | 55,428 | 55,282 |
| Income statement (million euros) | ||||
| Net interest income | 17,758 | 4.1 | 17,059 | 16,426 |
| Gross income | 25,270 | 2.5 | 24,653 | 23,680 |
| Operating income | 12,770 | 7.7 | 11,862 | 11,363 |
| Protit/(loss) before tax | 6,931 | 8.4 | 6,392 | 5,879 |
| Net attributable profit | 3,519 | 1.3 | 3,475 | 2,642 |
| The BBVA share and share performance ratios | ||||
| Number of shares (million) | 6,668 | 1.5 | 6,567 | 6,367 |
| Share price (euros) | 7.11 | 10.9 | 6.41 | 6.74 |
| Earning per share (euros)(1) | 0.48 | (0.7) | 0.49 | 0.37 |
| Book value per share (euros) | 6.96 | (3.6) | 7.22 | 7.47 |
| Tangible book value per share (euros) | 5.69 | (0.6) | 5.73 | 5.88 |
| Market capitalization (million euros) | 47,422 | 12.6 | 42,118 | 42,905 |
| Yield (dividend/price; %) | 4.2 | 5.8 | 5.5 | |
| Significant ratios (%) | ||||
| ROE (net attributable profit/average shareholders' funds)(2) | 6.4 | 6.7 | 5.2 | |
| ROTE (net attributable profit/average shareholders' funds excluding intangible assets) (2) | 7.7 | 8.2 | 6.4 | |
| ROA (profit or loss for the year/average total assets) | 0.68 | 0.64 | 0.46 | |
| RORWA (profit or loss for the year/average risk-weighted assets) | 1.27 | 1.19 | 0.87 | |
| Efficiency ratio | 49.5 | 51.9 | 52.0 | |
| Cost of risk | 0.87 | 0.84 | 1.06 | |
| NPL ratio | 4.4 | 4.9 | 5.4 | |
| NPL coverage ratio | 65 | 70 | 74 | |
| Capital adequacy ratios (%) | ||||
| CET1 fully-loaded | 11.1 | 10.9 | 10.3 | |
| CET1 phase-in(3) | 11.7 | 12.2 | 12.1 | |
| Tier 1 phase-in(3) | 13.0 | 12.9 | 12.1 | |
| Total ratio phase-in(3) | 15.4 | 15.1 | 15.0 | |
| Other information | ||||
| Number of shareholders | 891,453 | (4.7) | 935,284 | 934,244 |
| Number of employees | 131,856 | (2.2) | 134,792 | 137,968 |
| Number of branches | 8,271 | (4.5) | 8,660 | 9,145 |
| Number of ATMs | 31,688 | 1.8 | 31,120 | 30,616 |
- (1) Adjusted by additional Tier 1 instrument remuneration.
- (2) The ROE and ROTE ratios include in the denominator the Group’s average shareholders’ funds, but do not take into account the caption within total equity named “Accumulated other comprehensive income” with an average balance of -€1,139m in 2015, -€4,492m in 2016 and -€7,015 in 2017.
- (3) The capital ratios are calculated under CRD IV from Basel III regulation, applying a 80% phase-in for 2017 and a 60% for 2016.
- (4) Since the third quarter of 2015, the total stake in Garanti is consolidated by the full integration method. For previous periods, the nancial information provided in this document is presented integrated in the proportion corresponding to the percentage of the Group’s stake then (25.01%).
Relevant events
Results
- Generalized sustained growth in more recurrent sources of revenue in practically all geographic areas.
- Operating expenses remain under control, leading to an improvement in the efficiency ratio in comparison with 2016.
- Impairment losses on financial assets has been influenced by the recognition of impairment losses of €1,123m from BBVA's stake in Telefónica, S.A.
- As a result, the net attributable profit was €3,519m. Without taking into account the impacts of the impairment losses in Telefónica in 2017 and the so-called "mortgage floor clauses" in 2016, the net attributable profit was up year-on-year by 19.7%.
Net attributable profit (Million euros)

Net attributable profit breakdown (1) (Percentage. 2017)

(1) Excludes the Corporate Center.
(2) Includes the areas Banking activity in Spain and Non Core Real Estate.
Balance sheet and business activity
-
The year-on-year comparison of the Group's balance sheet and business activity has been affected by the operations underway (sales of BBVA Chile and the real-estate business in Spain), which as of 31-Dec-2017 were reclassified as non-current assets and liabilities held for sale. Without taking into account the said reclassification (figures in comparable terms with respect to previous periods):
- Loans and advances to customers (gross) continue to increase in emerging geographies but decline in Spain. There has been a slight recovery in the United States since the second half of 2017.
- Non-performing loans continue to improve favorably.
- Deposits from customers have performed particularly well in the more liquid and lower-cost items.
- There was an increase in off-balance-sheet funds, mainly in mutual funds.
Solvency
- The capital position is above regulatory requirements and in line with the target established for the fully-loaded CET1 of 11%. The recognition of the impairment losses from Telefónica mentioned above does not negatively affect the Group's solvency, as they are deducted from both equity and CET1.
Capital and leverage ratios (Percentage as of 31-12-17)

(1) Includes update of the calculation on Structural FX RWA, pending confirmation by ECB.
Risk management
- Good performance of the main credit risk metrics: as of 31-Dec-2017, the NPL ratio closed at 4.4%, the NPL coverage ratio at 65% and the cumulative cost of risk at 0.87%.
NPL and NPL coverage ratios (Percentage)

Transformation
- The Group's digital and mobile customer base and digital sales continue to increase in all the geographic areas where BBVA operates.
Digital and mobile customers (Millions)

Other matters of interest
- The Board of Directors has agreed to propose to the Annual General Meeting a cash payment in a gorss amount of euro 0.15 per share to be paid in April as a final dividend for the year 2017.
Results
BBVA Group's net attributable profit for 2017 was €3,519m. It was affected by the negative impact of the recognition of impairment losses from its stake in Telefónica, S.A. as a result of the changes in the share price of the latter.
The Group thus generated a net attributable profit excluding the negative effect of these impairment losses of €4,642m. This represents growth of 33.6% on the net attributable profit in 2016 (up 19.7% excluding the charges for the so-called “mortgage floor clauses” in 2016). Once more, there was a notably good performance of more recurring revenue and containment of operating expenses.
Unless expressly indicated otherwise, to better understand the changes in the main headings of the Group’s incomestatement, the year-on-year percentage changes given belowrefer to constant exchange rates.
Consolidated income statement: quarterly evolution (Million euros)
| 2017 | 2016 | |||||||
|---|---|---|---|---|---|---|---|---|
| 4Q | 3Q | 2Q | 1Q | 4Q | 3Q | 2Q | 1Q | |
| Net interest income | 4,557 | 4,399 | 4,481 | 4,322 | 4,385 | 4,310 | 4,213 | 4,152 |
| Net fees and commissions | 1,215 | 1,249 | 1,233 | 1,223 | 1,161 | 1,207 | 1,189 | 1,161 |
| Net trading income | 552 | 347 | 378 | 691 | 379 | 577 | 819 | 357 |
| Dividend income | 86 | 35 | 169 | 43 | 131 | 35 | 257 | 45 |
| Share of profit loss of entities accounted for using the equity method | 5 | 6 | (2) | (5) | 7 | 17 | (6) | 7 |
| Other operating income and expenses | (54) | 154 | 77 | 108 | 159 | 52 | (26) | 66 |
| Gross income | 6,362 | 6,189 | 6,336 | 6,383 | 6,222 | 6,198 | 6,445 | 5,788 |
| Operating expenses | (3,114) | (3,075) | (3,175) | (3,137) | (3,243) | (3,216) | (3,159) | (3,174) |
| Personnel expenses | (1,640) | (1,607) | (1,677) | (1,647) | (1,698) | (1,700) | (1,655) | (1,669) |
| Other administrative expenses | (1,143) | (1,123) | (1,139) | (1,136) | (1,180) | (1,144) | (1,158) | (1,161) |
| Depreciation | (331) | (344) | (359) | (354) | (365) | (372) | (345) | (344) |
| Operating income | 3,248 | 3,115 | 3,161 | 3,246 | 2,980 | 2,982 | 3,287 | 2,614 |
| Impairment on financial assets (net) | (1,885) | (976) | (997) | (945) | (687) | (1,004) | (1,077) | (1,033) |
| Provisions (net) | (180) | (201) | (193) | (170) | (723) | (201) | (81) | (181) |
| Other gains (losses) | (267) | 44 | (3) | (66) | (284) | (61) | (75) | (62) |
| Profit/(loss) before tax | 916 | 1,982 | 1,969 | 2,065 | 1,285 | 1,716 | 2,053 | 1,338 |
| Income tax | (499) | (550) | (546) | (573) | (314) | (465) | (557) | (362) |
| Profit/(loss) for the year | 417 | 1,431 | 1,422 | 1,492 | 971 | 1,251 | 1,496 | 976 |
| Non-controlling interests | (347) | (288) | (315) | (293) | (293) | (286) | (373) | (266) |
| Net attributable profit | 70 | 1,143 | 1,107 | 1,199 | 678 | 965 | 1,123 | 709 |
| Net attributable profit excluding results from corporate operations | 70 | 1,143 | 1,107 | 1,199 | 678 | 965 | 1,123 | 709 |
| Earning per share (euros) (1) | (0.00) | 0.16 | 0.16 | 0.17 | 0.09 | 0.13 | 0.16 | 0.10 |
- (1) Adjusted by additional Tier 1 instrument remuneration.
Consolidated income statement (Million euros)
| 2017 | ∆% | ∆% at constant exchange rates | 2016 | |
|---|---|---|---|---|
| Net interest income | 17,758 | 4.1 | 10.6 | 17,059 |
| Net fees and commissions | 4,921 | 4.3 | 9.4 | 4,718 |
| Net trading income | 1,968 | (7.7) | (6.0) | 2,132 |
| Dividend income | 334 | (28.5) | (28.3) | 467 |
| Share of profit loss of entities accounted for using the equity method | 4 | (86.2) | (86.5) | 25 |
| Other operating income and expenses | 285 | 13.4 | 2.8 | 252 |
| Gross income | 25,270 | 2.5 | 7.9 | 24,653 |
| Operating expenses | (12,500) | (2.3) | 2.2 | (12,791) |
| Personnel expenses | (6,571) | (2.2) | 1.9 | (6,722) |
| Other administrative expenses | (4,541) | (2.2) | 2.7 | (4,644) |
| Depreciation | (1,387) | (2.7) | 1.8 | (1,426) |
| Operating income | 12,770 | 7.7 | 14.1 | 11,862 |
| Impairment on financial assets (net) | (4,803) | 26.3 | 32.0 | (3,801) |
| Provisions (net) | (745) | (37.2) | (37.8) | (1,186) |
| Other gains (losses) | (292) | (39,5) | (40,1) | (482) |
| Profit/(loss) before tax | 6,931 | 8.4 | 18.1 | 6,392 |
| Income tax | (2,169) | 27.7 | 39.7 | (1,699) |
| Profit/(loss) for the year | 4,762 | 1.5 | 10.4 | 4,693 |
| Non-controlling interests | (1,243) | 2.0 | 19.1 | (1,218) |
| Net attributable profit | 3,519 | 1.3 | 7.6 | 3,475 |
| Net attributable profit excluding results from corporate operations | 3,519 | 1.3 | 7.6 | 3,475 |
| Earning per share (euros)(1) | 0.48 | 0.49 |
- (1) Adjusted by additional Tier 1 instrument remuneration.
Gross income
Cumulative gross income grew by 7.9% year-on-year, once more strongly supported by the positive performance of the more recurring items.
Gross income (Million euros)
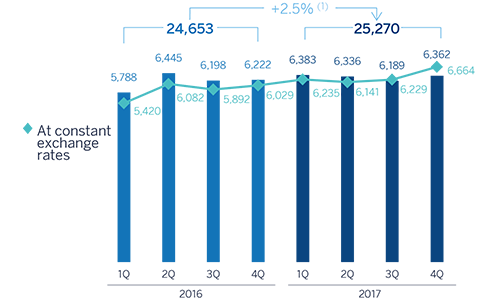
(1) At constant exchange rates: +7.9%.
Net interest income continued to grow, rising significantly in the fourth quarter by 8.4% and a cumulative 10.6% year-on-year. This positive trend was once again driven by growth in activity, above all in emerging economies, and good management of customer spreads. By business areas there was a positive performance in Turkey (up 20.6%), South America (up 15.1%), the United States (up 13.0%) and Mexico (up 9.5%). In Spain, although this line item grew in the fourth quarter, there was a slight decline in the figure for the year as a whole as a result of lower loan volumes and sales of wholesale portfolios.
Net interest income/ATAs (Percentage)

Cumulative net fees and commissions performed very well in all the Group's areas (up 9.4% year-on-year), strongly reflecting their appropriate diversification. The quarterly figure was also good (up 1.1% in the last three months).
As a result, more recurring revenues items (net interest income plus net fees and commissions) increased by 10.3% year-on-year (6.8% over the last three months).
Net interest income plus fees and commissions (Million euros)
(1) At constant exchange rates: +10.3%.
Growth in NTI slowed in comparison with 2016 figures. This is basically due to lower sales of ALCO portfolios during this year.
The dividend income heading mainly includes income from the Group's stake in the Telefónica group. The year-on-year decline of 28.3% in this figure can be explained by the reduction in the dividend paid by Telefónica, as well as the inclusion of dividends from China Citic Bank (CNCB) in the second quarter of 2016.
Finally, other operating income and expenses increased by 2.8% in year-on-year terms. It should be noted that the net contribution of the insurance business remained flat (up 0.1%) due mainly to the high level of claim ratios as a result of the natural disasters occurred in Mexico.
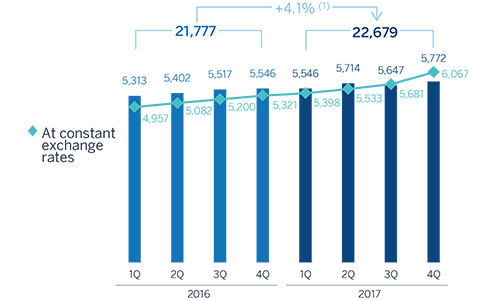
Operating income
Operating expenses were kept in check to a year-on-year increase of 2.2%. The above is due to the cost discipline implemented in all areas of the Group through efficiency plans that are now yielding results, and the materialization of some synergies (mainly resulting from the integration of Catalunya Banc - CX -). By business areas there were notable reductions in Spain and the Rest of Eurasia. In the rest of the geographic areas (Mexico, Turkey, the United States and South America), the year-on-year rise in costs was below or in line with the local average inflation.
Operating expenses (Million euros)
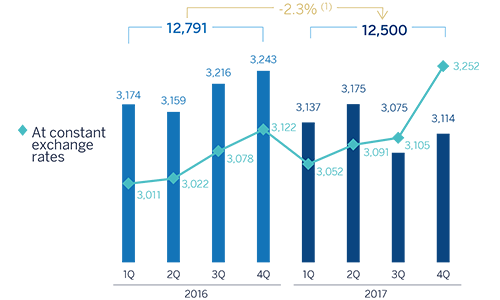
(1) At constant exchange rates: +2.2%.
As a result of the above, the efficiency ratio closed at 49.5%, below the figure of 51.9% in the previous year, and cumulative operating income rose by 14.1% over the last twelve months.
Breakdown of operating expenses and efficiency calculation (Million euros)
| 2017 | ∆% | 2016 | |
|---|---|---|---|
| Personnel expenses | 6,571 | (2.2) | 6,722 |
| Wages and salaries | 5,163 | (2.0) | 5,267 |
| Employee welfare expenses | 911 | (2.9) | 938 |
| Training expenses and other | 497 | (3.7) | 516 |
| Other administrative expenses | 4,541 | (2.2) | 4,644 |
| Property, fixtures and materials | 1,033 | (4.3) | 1,080 |
| IT | 1,018 | 5.2 | 968 |
| Communications | 269 | (8.6) | 294 |
| Advertising and publicity | 352 | (11.4) | 398 |
| Corporate expenses | 110 | 5.8 | 104 |
| Other expenses | 1,301 | (4.8) | 1,367 |
| Levies and taxes | 456 | 5.5 | 433 |
| Administration costs | 11,112 | (2.2) | 11,366 |
| Depreciation | 1,387 | (2.7) | 1,426 |
| Operating expenses | 12,500 | (2.3) | 12,791 |
| Gross income | 25,270 | 2.5 | 24,653 |
| Eficiency ratio (operating expenses/gross income; %) | 49.5 | 51.9 |
Efficiency (Million euros) and efficiency ratio (Percentage)

Operating income (Million euros)
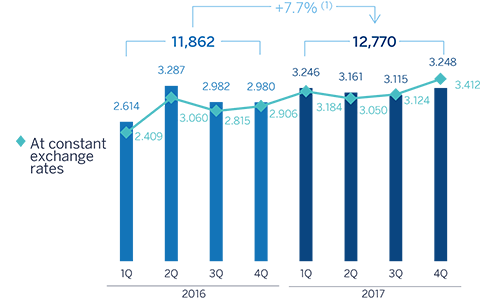
(1) At constant exchange rates: +14.1%.
Number of employees

Number of branches

Number of ATMs

Impairment on financial assests (net) (Million euros)
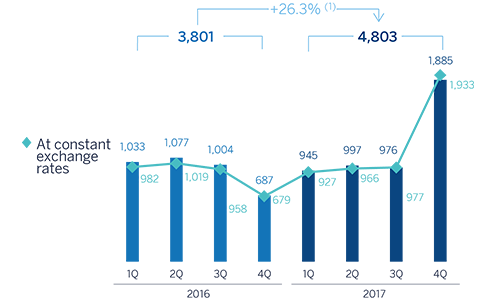
(1) At constant exchange rates: +32.0%.
Provisions and other
Impairment losses on financial assets of the year included the impairment losses of €1,123m from BBVA Group's stake from Telefónica, S.A, as a result of the evolution of the price of the latter and in compliance with the requirements of the accounting standard IAS 39. Excluding this impact, this figure is 1.2% higher than the one for 2016. By business areas, the most significant was a reduction in Banking activity in Spain due to lower loan-loss provisioning needs. In contrast, there was an increase in the United States due to the inclusion of provisions allocated as a result of the estimated negative effect of the natural disasters in the third quarter and higher loan-loss provisioning related to consumer portfolio. Turkey, Mexico and South America also saw an increase, largely linked to the increase in lending activity, and to a lesser extent, the impact of increased needs for insolvency provisions associated with some wholesale customers in the case of South America.
As a result of the above the cumulative cost of risk in 2017 (0.87%) was barely three basis points above the figure in 2016 (0.84%).
The fall of 38.5% in provisions (net) and other gains (losses) can be explained by the inclusion in the fourth quarter of 2016 of a charge of €577m (€404m after tax) to cover the contingency linked to the decision of the Court of Justice of the European Union (CJEU) on "mortgage floor clauses." This item includes items such as provisions for contingent liabilities, contributions to pension funds, the provision needs for property and foreclosed assets and restructuring costs.
Results
As a result, the Group's net attributable profit in 2017 was €3,519m, a year-on-year rise of 7.6%; not including the impairment Telefónica losses in 2017 and the aforementioned charge related to the so-called “mortgage floor clauses” in 2016, there was a rise of 26.3%. It is important to note that since March 2017 this figure has included the additional stake of 9.95% in the capital of Garanti, which has led to a positive impact of around €150m due to a reduction in the non-controlling interests heading.
By business area, banking activity in Spain generated a profit of €1,381m, Non-Core Real Estate generated a loss of €501m, the United States contributed a profit of €511m, Mexico €2,162m, Turkey €826m, South America €861m and the Rest of Eurasia €125m.
Net attributable profit (Million euros)
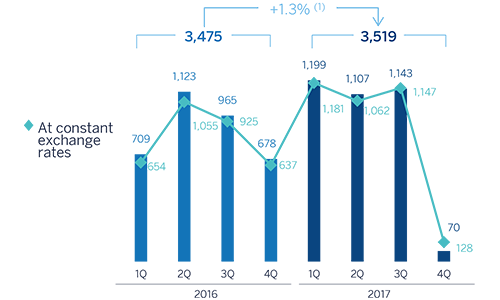
(1) At constant exchange rates: +7.6%.
Earning per share (1) (Euros)
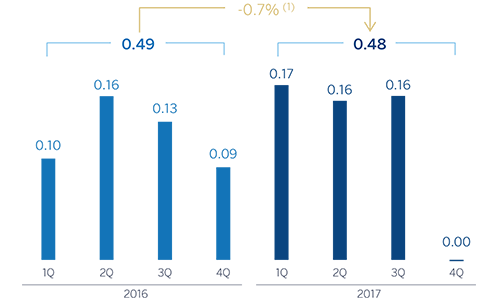
(1) Adjusted by additional Tier 1 instrument remuneration.
ROE and ROTE (1) (Percentage)

(1) The ROE and ROTE ratios include in the denominator the Group’s average shareholders’ funds, but do not take into account the caption within total equity named “Accumulated other comprehensive income” with an average balance of -€1,139m in 2015, -€4,492m in 2016 and -€7,015 in 2017
ROA and RORWA (Percentage)

Balance sheet and business activity
The year-on-year comparison of the Group's balance sheet and business activity have been affected by the operations currently underway (the sales of BBVA Chile and the real-estate business in Spain), which as of December 31, 2017 were reclassified as non-current assets and liabilities held for sale (in the accompanying balance sheet, under the headings of other assets and other liabilities, respectively). Without taking into account the said reclassification (figures in comparable terms with respect to previous periods), the most significant items are shown below:
- Geographic disparity of loans and advances to customers (gross). Lending increased in the emerging economies, while Spain continued to deleverage. The United States registered a slight increase in lending during the second half of the year, resulting in the year-on-year loan balance closing at very similar levels.
- Non-performing loans declined again, thanks to an improvement in Spain and the United States.
- In deposits from customers, there was another notable increase across the board in lower-cost items such as current and savings accounts, and a decline in time deposits.
- Off-balance-sheet funds continued to perform well in all items (mutual funds, pension funds and other customer funds).
Consolidated balance sheet (Million euros)
| 31-12-17 | ∆% | 31-12-16 | 30-09-17 | |
|---|---|---|---|---|
| Cash, cash balances at central banks and other demand deposits | 42,680 | 6.6 | 40,039 | 36,023 |
| Financial assets held for trading | 64,695 | (13.7) | 74,950 | 65,670 |
| Other financial assets designated at fair value through pro t or loss | 2,709 | 31.4 | 2,062 | 2,848 |
| Available-for-sale financial assets | 69,476 | (12.3) | 79,221 | 74,599 |
| Loans and receivables | 431,521 | (7.4) | 465,977 | 449,564 |
| Loans and advances to central banks and credit institutions | 33,561 | (16.7) | 40,268 | 36,556 |
| Loans and advances to customers | 387,621 | (6.5) | 414,500 | 401,734 |
| Debt securities | 10,339 | (7.8) | 11,209 | 11,275 |
| Held-to-maturity investments | 13,754 | (22.3) | 17,696 | 14,010 |
| Investments in subsidiaries, joint ventures and associates | 1,588 | 107.5 | 765 | 1,584 |
| Tangible assets | 7,191 | (19.6) | 8,941 | 7,963 |
| Intangible assets | 8,464 | (13.5) | 9,786 | 8,743 |
| Other assets | 47,981 | 48.0 | 32,418 | 29,793 |
| Total assets | 690,059 | (5.7) | 731,856 | 690,797 |
| Financial liabilities held for trading | 46,182 | (15.5) | 54,675 | 45,352 |
| Other financial liabilities designated at fair value through profit or loss | 2,222 | (5.0) | 2,338 | 2,372 |
| Financial liabilities at amortized cost | 543,713 | (7.7) | 589,210 | 559,289 |
| Deposits from central banks and credit institutions | 91,570 | (6.8) | 98,241 | 84,927 |
| Deposits from customers | 376,379 | (6.2) | 401,465 | 392,865 |
| Debt certificates | 63,915 | (16.3) | 76,375 | 69,285 |
| Other financial liabilities | 11,850 | (9.7) | 13,129 | 12,212 |
| Liabilities under insurance contracts | 9,223 | 0.9 | 9,139 | 9,665 |
| Other liabilities | 35,395 | 68.0 | 21,066 | 19,720 |
| Total liabilities | 636,736 | (5.9) | 676,428 | 636,397 |
| Non-controlling interests | 6,979 | (13.5) | 8,064 | 7,069 |
| Accumulated other comprehensive income | (8,792) | 61.1 | (5,458) | (7,956) |
| Shareholders’ funds | 55,136 | 4.4 | 52,821 | 55,287 |
| Total equity | 53,323 | (3.8) | 55,428 | 54,400 |
| Total liabilities and equity | 690,059 | (5.7) | 731,856 | 690,797 |
| Memorandum item: | ||||
| Collateral given | 47,671 | (5.7) | 50,540 | 45,489 |
Loans and advances to customers (gross)
(Billion euros)

(1) At constant exchange rates: +2.7%.
Customer funds
(Billion euros)

(1) At constant exchange rates: +1.9%.
Loans and advances to customers
(Million euros)
| 31-12-17 | ∆% | 31-12-16 | 30-09-17 | |
|---|---|---|---|---|
| Public administration | 25,671 | (6.7) | 27,506 | 25,828 |
| Individuals | 159,781 | (7.4) | 172,476 | 169,245 |
| Residential mortgages | 109,563 | (10.5) | 122,439 | 117,273 |
| Consumer | 36,235 | 3.0 | 35,195 | 37,556 |
| Credit cards | 13,982 | (5.8) | 14,842 | 14,416 |
| Business | 175,168 | (7.7) | 189,733 | 184,199 |
| Business retail | 19,692 | (19.1) | 24,343 | 20,185 |
| Other business | 155,476 | (6.0) | 165,391 | 164,014 |
| Other loans | 20,358 | 14.1 | 17,844 | 16,745 |
| Non-performing loans | 19,390 | (15.4) | 22,915 | 20,222 |
| Loans and advances to customers (gross) |
400,369 | (7.0) | 430,474 | 416,240 |
| Loan-loss provisions | (12,748) | (20.2) | (15,974) | (14,506) |
| Loans and advances to customers |
387,621 | (6.5) | 414,500 | 401,734 |
Customer funds
(Million euros)
| 31-12-17 | Δ% | 31-12-16 | 30-09-17 | |
|---|---|---|---|---|
| Deposits from customers | 376,379 | (6.2) | 401,465 | 392,865 |
| Current accounts | 245,249 | 5.9 | 231,638 | 242,566 |
| Time deposits | 110,320 | (23.6) | 144,407 | 127,897 |
| Assets sold under repurchase agreement | 8,119 | (26.6) | 11,056 | 10,442 |
| Other deposits | 12,692 | (11.6) | 14,364 | 11,959 |
| Other customer funds | 134,906 | 2.1 | 132,092 | 137,724 |
| Mutual funds and investment companies | 60,939 | 10.7 | 55,037 | 60,868 |
| Pension funds | 33,985 | 1.7 | 33,418 | 33,615 |
| Other off-balance sheet funds | 3,081 | 8.8 | 2,831 | 3,293 |
| Customer portfolios | 36,901 | (9.6) | 40,805 | 39,948 |
| Total customer funds | 511,285 | (4.2) | 533,557 | 530,589 |
Solvency
Capital base
The BBVA Group's fully-loaded CET1 ratio stood at 11.1% at the end of December 2017, in line with the target of 11%. This ratio has increased by 18 basis points since the end of 2016, leveraged on organic earning generation and reduction of RWA capital consumption.
During 2017, the capital ratio was affected by the acquisition of an additional 9.95% stake in Garanti and the sale of CNCB. These transactions have had a combined negative effect on the ratio of 13 basis points. In addition, the Group also recognized losses of €1,123m in 2017 as a result of the impairment losses from its stake in Telefónica. However, this impact does not affect the capital base, as these losses are deducted from the Group's capital.
RWAs declined year-on-year, largely due to the depreciation of currencies against the euro (in particular, the Turkish lira and U.S. dollar).
BBVA S.A. carried out two capital issuances classified as additional tier 1 (AT1) capital (contingent convertible), for €500m and USD 1 billion, respectively (the latter in the U.S. market, with a prospectus registered with the SEC and not yet calculated in the Group's Tier 1 as of 31-Dec-2017). As Tier 2 level, BBVA S.A. issued subordinated debt during the year for a total of approximately €1.5 billion; and in Turkey, Garanti issued USD 750m.
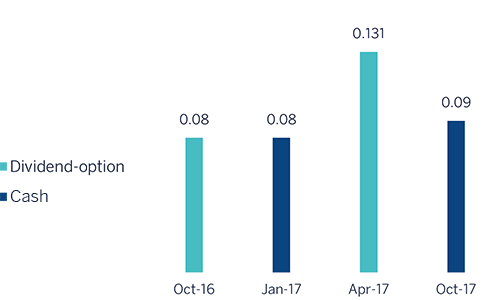
Finally, with respect to capital distribution, the last "dividend-option" program was completed in April, with holders of 83.28% of rights choosing to receive new shares. On October 10, an interim dividend for 2017 was distributed at €0.09 per share.
Evolution of fully-loaded capital ratios (1) (Percentage)

(1) As of 31-12-2017 it includes update of the calculation on Structural FX RWA, pending confirmation by ECB. Additionally, it includes the AT2 issuance by Garanti, pending approval by ECB for the purpose of computability in the Group's ratio.
Capital base (1, 2) (Million euros)
| CRD IV phased-in (1) | CRD IV fully-loaded | 31-12-17 (3) | 31-12-16 | 30-09-17 | 31-12-17 (3) | 31-12-16 | 30-09-17 |
|---|---|---|---|---|---|---|
| Common Equity Tier 1 (CET 1) | 42,337 | 47,370 | 43,393 | 40,058 | 42,398 | 40,899 |
| Tier 1 | 46,977 | 50,083 | 47,983 | 46,313 | 48,459 | 47,138 |
| Tier 2 | 8,798 | 8,810 | 9,237 | 8,624 | 8,739 | 8,953 |
| Total Capital (Tier 1 + Tier 2) | 55,775 | 58,893 | 57,219 | 54,937 | 57,198 | 56,091 |
| Risk-weighted assets | 361,686 | 388,951 | 365,314 | 361,686 | 388,951 | 365,314 |
| CET1 (%) | 11.7 | 12.2 | 11.9 | 11.1 | 10.9 | 11.2 |
| Tier 1 (%) | 13.0 | 12.9 | 13.1 | 12.8 | 12.5 | 12.9 |
| Tier 2 (%) | 2.5 | 2.3 | 2.5 | 2.5 | 2.2 | 2.4 |
| Total capital ratio (%) | 15.5 | 15.1 | 15.7 | 15.3 | 14.7 | 15.4 |
- (1) The capital ratios are calculated under CRD IV from Basel III regulation, applying a 80% phase-in for 2017 and a 60% for 2016.
- (2) As of 31-12-2017 it includes update of the calculation on Structural FX RWA, pending con rmation by ECB. Additionally, it includes the AT2 issuance by Garanti, pending approval by ECB for the purpose of computability in the Group’s ratio.
- (3) Preliminary data.
As of 31-Dec-2017 the CET1 phased-in capital ratio stood at 11.7%, the Tier 1 ratio at 13.0% (13.3% taking into account the AT1 issuance of USD 1 billion on the U.S. market in the fourth quarter of 2017) and the Tier 2 ratio of 2.5%, resulting in a total capital ratio of 15.5% (15.8% taking into account the AT1 issuance mentioned above). These levels are above the requirements established by the regulator in its SREP letter and the systemic buffers applicable to BBVA Group for 2017 (7.625% for the phased-in CET1 ratio and 11.125% for the total capital ratio). Starting on January 1, 2018, the requirement has been established at 8.438% for the phased-in CET1 ratio and 11.938% for the total capital ratio. The change with respect to 2017 is due to the progressive implementation of the capital conservation buffers and the buffer related to other systemically important banks. The regulatory requirement for 2018 in fully-loaded terms remains unchanged (CET1 of 9.25% and total ratio of 12.75%) compared with the previous year.
Finally, the Group maintains a sound leverage ratio: 6.6% under fully-loaded criteria (6.7% phased-in), which continues to be the highest in its peer group.
Ratings
In 2017, Standard & Poor's (S&P) raised its outlook for BBVA to positive from stable as a result of a similar improvement in Spain's sovereign rating outlook, with both ratings being maintained at BBB+. Scope Ratings raised BBVA's long-term rating one notch from A to A+, and the short-term rating from S-1 to S-1+, both with a stable outlook. The rest of the credit rating agencies did not change either BBVA's rating or its outlook in 2017.
Ratings
| Rating agency | Long term | Short term | Outlook |
|---|---|---|---|
| DBRS | A | R-1 (low) | Stable |
| Fitch | A- | F-2 | Stable |
| Moody’s (1) | Baa1 | P-2 | Stable |
| Scope Ratings | A+ | S-1+ | Stable |
| Standard & Poor’s | BBB+ | A-2 | Positive |
- (1) Additionally, Moody’s assigns an A3 rating to BBVA’s long-term deposits.
Risk management
Credit risk
BBVA Group's risk metrics have continued to perform positively throughout the year:
- Credit risk remained flat in the last quarter, with a cumulative decline of 4.0% since the end of 2016 (up 2.0% both in the quarter and over the year at constant exchange rates). The deleveraging process continued in Spain. At constant exchange rates in year-on-year terms, Turkey and Mexico grew by 4.3% and 6.9% respectively, South America 9.5% (Argentina by 67.9%, Chile and Colombia around 10%) and the United States remained practically stable (up 0.4%).
- Non-performing loans maintained their downward trend, falling by 2.1% over the quarter and 13.2% relative to December 2016. At constant exchange rates, the figures were down 0.8% over the quarter and down 10.5% in annual terms. Good performance in Spain and the United States and increases mainly in Turkey and South America, due to the deterioration of some wholesale customers.
- The Group’s NPL ratio improved again (down 9 basis points over the last three months and 47 basis points compared with the close of 2016) to 4.4% as of 31-Dec-2017, driven by the decline in non-performing loans.
- Provisions also declined, both in the last three months and over the year (down 11.5% and 19.6%, respectively). At constant exchange rates, the rates of variation were down 9.2% and 15.2% since September 2017 and December 2016, respectively.
- As a result, the NPL coverage ratio closed at 65%.
- Finally, the cumulative cost of risk as of December 2017 was 0.87%, showing stable progress in 2017 and closing three basis points above the cumulative figure for 2016 (0.84%).
Non-performing loans (Million euros)

Credit risks (1) (Million euros)
| 31-12-17 (2) | 30-09-17 | 30-06-17 | 31-03-17 | 31-12-16 | |
|---|---|---|---|---|---|
| Non-performing loans and contingent liabilities | 20,492 | 20,932 | 22,422 | 23,236 | 23,595 |
| Credit risks | 461,303 | 461,794 | 471,548 | 480,517 | 480,720 |
| Provisions | 13,319 | 15,042 | 15,878 | 16,385 | 16,573 |
| NPL ratio (%) | 4.4 | 4.5 | 4.8 | 4.8 | 4.9 |
| NPL coverage ratio (%) | 65 | 72 | 71 | 71 | 70 |
- (1) Include gross loans and advances to customers plus guarantees given.
- (2) Figures without considering the reclassi cation of non-current assets held for sale.
Non-performing loans evolution (Million euros)
| 4Q 17(1) | 3Q 17 | 2Q 17 | 1Q 17 | 4Q 16 | |
|---|---|---|---|---|---|
| Beginning balance | 20,932 | 22,422 | 23,236 | 23,595 | 24,253 |
| Additions | 3,757 | 2,268 | 2,525 | 2,490 | 3,000 |
| Recoveries | (2,142) | (2,001) | (1,930) | (1,698) | (2,141) |
| Net variation | 1,616 | 267 | 595 | 792 | 859 |
| Write-offs | (1,980) | (1,575) | (1,070) | (1,132) | (1,403) |
| Exchange rate differences and other | (75) | (181) | (340) | (18) | (115) |
| Period-end balance | 20,492 | 20,932 | 22,422 | 23,236 | 23,595 |
| Memorandum item: | |||||
| Non-performing loans | 19,753 | 20,222 | 21,730 | 22,572 | 22,915 |
| Non-performing contingent liabilities | 739 | 710 | 691 | 664 | 680 |
- (1) Figures without considering the reclassi cation of non-current assets held for sale. Temporary data.
Structural risks
Liquidity and funding
Management of liquidity and funding in BBVA aims to finance the recurring growth of the banking business at suitable maturities and costs, using a wide range of instruments that provide access to a large number of alternative sources of finance, always in compliance with current regulatory requirements.
A core principle in BBVA's management of the Group's liquidity and funding is the financial independence of its banking subsidiaries abroad. This principle prevents the propagation of a liquidity crisis among the Group's different areas and ensures that the cost of liquidity is correctly reflected in the price formation process.
In 2017 liquidity and funding conditions remained comfortable across BBVA Group's global footprint:
- The financial soundness of the Group's banks continues to be based on the funding of lending activity, fundamentally through the use of stable customer funds.
- In the Eurozone, the liquidity situation is comfortable and the credit gap has narrowed on the balance sheet thanks to the positive behavior of customer liabilities.
- In Mexico, the liquidity position is sound, despite market volatility. Deposits have shown a very positive trend over the year, leading to a considerable narrowing of the credit gap.
- In the United States, the credit gap has widened because of the area's deliberate strategy to control the cost of deposits. It is worth noting that in the first quarter of 2017 Standard & Poors (S&P) upgraded its outlook for BBVA Compass’ rating (BBB+) from negative to stable.
- The liquidity situation in Turkey is comfortable, boosted by a maintenance of good market conditions, with a slight increase in the credit gap as a result of the growth of lending spurred by the government's Credit Guarantee Fund (CGF) program.
- In South America, the liquidity situation remains comfortable, allowing a reduction of the growth of wholesale deposits to match growth in lending activity.
- In the fourth quarter of 2017, BBVA S.A. carried out an issuance of additional Tier 1 in the American market for USD 1 billion, with the prospectus registered with the SEC. In total, BBVA S.A. issued €7.1 billion in 2017, of which €5.8 billion were on the wholesale funding markets, using the formats of senior debt (€2.5 billion), Tier 2 (€1 billion), senior non-preferred (€1.5 billion) and Tier 1 (USD 1 billion). It also closed a number of private issuance transactions of senior non-preferred securities for a total of €290m, Tier 2 securities for about €500m and additional Tier 1 for €500m.
- The long-term wholesale funding markets have remained stable in the other geographical areas where the Group operates.
- In Mexico, BBVA Bancomer has carried out two local senior debt issuances for a total of MXN 7 billion, with maturities of three and five years.
- In the United States, BBVA Compass returned to the markets in the second quarter with a five-year senior debt issue of USD 750m.
- In Turkey, Garanti's securities issuances have continued to strengthen its balance-sheet structure over the whole year. Worth noting are the following issuances: senior debt of USD 500m, subordinated debt of USD 750m, collateralized bonds for a total of 1,680m liras, securitizations for USD 685m, and renewal of syndicated loans with a new two-year tranche.
- In South America, BBVA Chile has also made a number of senior debt issuances with maturities ranging from four to ten years on the local market for an equivalent of €505m. BBVA Continental in Peru has also issued €182m on the local market through a number of issues with a maturity of three years; and in Argentina, BBVA Francés has issued a total of €49m in two-year and three-year bonds, as well as making a capital increase of €400m.
- Short-term funding has continued to perform positively, in a context marked by a high level of liquidity.
- BBVA Group's liquidity coverage ratio (LCR) has remained comfortably above 100% throughout 2017, without including liquidity transfers between subsidiaries; in other words, no kind of excess liquidity levels in the subsidiaries abroad is considered in the calculation of the consolidated ratio. As of 31 December 2017, the LCR stood at 128%. Although this requirement is only established at Group level, the minimum level is easily exceeded in all the subsidiaries (Eurozone, 151%; Mexico, 148%; Turkey, 134%; and the United States, 144%1).
- (1) Compass LCR calculated according to local regulation (Fed Modified LCR).
- No relevant changes in the Eurozone, where rates remain at 0% and the deposit facility rate at -0.40%.
- In the United States the upward trend in interest rates continues, with three hikes in 2017 to 1.50%.
- In Mexico, Banxico made five interest-rate hikes during the year, leaving the monetary policy level at 7.25%.
- In Turkey, the period has been marked by the Central Bank's (CBRT's) interest-rate hikes, which have increased the average funding rate to 12.75%.
- In South America, the monetary authorities have continued their expansive policies, lowering rates in Peru (100 basis points), Colombia (275 basis points) and Chile (100 basis points). In Argentina, where inflation has resisted falling, there has been an increase of 400 basis points in the interest rate.
- (1) Calculated by dividing shareholder remuneration over the last twelve months over the closing price at the end of the period.
Foreign exchange
Foreign-exchange risk management of BBVA’s long-term investments, basically stemming from its franchises abroad, aims to preserve the Group's capital adequacy ratios and ensure the stability of its income statement.
The year 2017 was notable for the depreciation against the euro of the main currencies in which the Group operates: the U.S. dollar down 12.1%, the Mexican peso down 8.0% and the Turkish lira down 18.5%. In this context, BBVA has maintained its policy of actively hedging its main investments in emerging countries, covering on average between 30% and 50% of earnings expected for the fiscal year and around 70% of the excess CET1 capital ratio (which is not naturally covered by the ratio itself). In accordance with this policy, the sensitivity of the CET1 ratio to a depreciation of 10% of the main emerging currencies (Mexican peso or Turkish lira) against the euro remains at around one negative basis point for each of these currencies, and the coverage level of the expected earnings for 2018 in these two countries is around 50% in Mexico and 40% in Turkey.
Interest rates
The aim of managing interest-rate risk is to maintain a sustained growth of net interest income in the short and medium term, irrespective of interest-rate fluctuations, while controlling the impact on the capital adequacy ratio through the valuation of the portfolio of available-for-sale assets.
The Group's banks have fixed-income portfolios to manage the balance-sheet structure. In 2017, the results of this management have been satisfactory, with limited risk strategies in all the Group's banks.
Finally, the following is worth noting with respect to the monetary policy pursued by the different central banks of the main geographical areas where BBVA operates:
Economic capital
Consumption of economic risk capital (ERC) at the close of December 2017 stood at €34,401m in consolidated terms, which is equivalent to a decline of 1.7% with respect to the September figure. At constant exchange rates, the variation was up 1.1%, located in: credit risk, due to an increase in activity (higher activity in Turkey and South America); trading risk; focused in Spain and Mexico; and operational risk, due to the annual update of the model. This was partially offset by a fall in the equity investment valuation, due to the decline in Telefónica’s stock price; structural risk, explained by the increased hedges on the Turkish lira and Mexican peso; fixed assets ; and rate interest, especially focused in Mexico. In addition to economic capital, the return on regulatory capital (RORC) is managed, with a focus on maximizing return on RWAs and the allocation of capital in the most efficient way possible.
Attributable economic risk capital breakdown
(Percentage as of December 2017)

The BBVA share
Global economic growth held steady at around 1% quarter-on-quarter in the first nine months of 2017, and latest available indicators suggest that this momentum continued into the final part of the year. Confidence data continues to improve, accompanied by a recovery in world trade and the industrial sector, while private consumption remains robust in developed countries. This positive trend reflects improved economic performance in all regions: in contrast to other post-financial crisis periods, there has been a global synchronous recovery.
With respect to the main stock-market indices, in Europe the Stoxx 50 and Euro Stoxx 50 closed the year with gains of 5.6% and 6.5% respectively. In Spain the Ibex 35 fell back slightly over the last three months by 3.3%, but its cumulative performance for the year has remained positive, recording a gain of 7.4%. In the United States, the S&P 500 index performed very positively during the year, with a gain of 19.4% since December 2016.
The banking sector in Europe has also performed positively in 2017. The European bank index Stoxx Banks, which includes British banks, gained 8.1%, while the Eurozone bank index, the Euro Stoxx Banks, was up 10.9% in the same period. In the United States the S&P Regional Banks index gained 6.0% over the year compared to the closing data as of the end of 2016.
The BBVA share closed 2017 at €7.11, a cumulative gain of 10.9% since December 2016. This represents a relatively better performance than the European banking sector and the Ibex 35.
BBVA share evolution compared with European indices
(Base indice 100=31-12-2016)

The BBVA share and share performance ratios
| 31-12-17 | 31-12-16 | |
|---|---|---|
| Number of shareholders | 891,453 | 935,284 |
| Number of shares issued | 6,667,886,580 | 6,566,615,242 |
| Daily average number of shares traded | 35,820,623 | 47,180,855 |
| Daily average trading (million euros) | 252 | 272 |
| Maximum price (euros) | 7.93 | 6.88 |
| Minimum price (euros) | 5.92 | 4.50 |
| Closing price (euros) | 7.11 | 6.41 |
| Book value per share (euros) | 6.96 | 7.22 |
| Tangible book value per share (euros) | 5.69 | 5.73 |
| Market capitalization (million euros) | 47,422 | 42,118 |
| Yield (dividend/price; %) (1) | 4.2 | 5.8 |
In the Significant Event published on February 1, 2017, BBVA announced its intention of modifying its shareholder remuneration policy to one of a fully cash payment. This policy will be formed each year of an interim dividend (which is expected to be paid in October) and a final dividend (which will be paid out upon completion of the final year and following approval of the application of the result, foreseeably in April). These payouts will be subject to appropriate approval by the corresponding governing bodies. The Board of Directors has agreed to propose to the Annual General meeting a cash payment in a gross amount of euro 0.15 per share to be paid in April as a final dividend for the year 2017.
Shareholder remuneration
(Euros-gross-/share)
As of December 31, 2017, the number of BBVA shares was still 6,668 million and the number of shareholders was 891,453. Investors resident in Spain holded 43.44% of share capital, while non-resident shareholders holded the remaining 56.56%.
Shareholder structure (31-12-2017)
| Number of shares |
Shareholders | Shares | ||
|---|---|---|---|---|
| Number | % | Number | % | |
| Up to 150 | 184,797 | 20.7 | 13,171,010 | 0.2 |
| 151 to 450 | 182,854 | 20.5 | 49,996,632 | 0.7 |
| 451 to 1.800 | 279,883 | 31.4 | 272,309,651 | 4.1 |
| 1,801 to 4,500 | 128,005 | 14.4 | 364,876,715 | 5.5 |
| 4,501 to 9,000 | 59,585 | 6.7 | 375,424,611 | 5.6 |
| 9,001 to 45,000 | 49,938 | 5.6 | 869,649,638 | 13.0 |
| More than 45,001 | 6,391 | 0.7 | 4,722,458,323 | 70.8 |
| Total | 891,453 | 100.0 | 6,667,886,580 | 100.0 |
BBVA shares are listed on the main stock market indices, such as the Ibex 35, Euro Stoxx 50 and Stoxx 50, with a weighting of 8.9%, 2.0% and 1.3% respectively. They are also listed on several sector indices, including the Euro Stoxx Banks, with a weighting of 8.7%, and the Stoxx Banks, with a weighting of 4.3%.
Finally, BBVA maintains a significant presence on a number of international sustainability indices or ESG (environmental, social and governance) indices, which evaluate the performance of companies in this area, as summarized in the table below.
Sustainability indices on which BBVA is listed as of 31-12-2017 (1)

(1)The inclusion of BBVA in any MSCI index, and the use of MSCI logos, trademarks, service marks or index names herein, do not constitute a sponsorship, endorsement or promotion of BBVA by MSCI or any of its affiliates. The MSCI indices are the exclusive property of MSCI. MSCI and the MSCI index names and logos are trademarks or service marks of MSCI or its affiliates.