Notes to the consolidated financial statements
- 1. Introduction, basis for the presentation of the Consolidated Financial Statements, internal control of financial information and other information
- 1.1 Introduction
- 1.2 Basis for the presentation of the Consolidated Financial Statements
- 1.3 Comparative information
- 1.4 Seasonal nature of income and expenses
- 1.5 Responsibility for the information and for the estimates made
- 1.6 BBVA Group’s Internal Control over Financial Reporting
- 2. Principles of consolidation, accounting policies and measurement bases applied and recent IFRS pronouncements
- 2.1 Principles of consolidation
- 2.2 Accounting policies and valuation criteria applied
- 2.2.1 Financial instruments
- 2.2.2 Transfers and derecognition of financial assets and liabilities
- 2.2.3 Financial guarantees
- 2.2.4 Non-current assets and disposal groups held for sale and liabilities included in disposal groups classified as held for sale
- 2.2.5 Tangible assets
- 2.2.6 Inventories
- 2.2.7 Business combinations
- 2.2.8 Intangible assets
- 2.2.9 Insurance and reinsurance contracts
- 2.2.10 Tax assets and liabilities
- 2.2.11 Provisions, contingent assets and contingent liabilities
- 2.2.12 Pensions and other post-employment commitments
- 2.2.13 Equity-settled share-based payment transactions
- 2.2.14 Termination benefits
- 2.2.15 Treasury shares
- 2.2.16 Foreign-currency transactions and exchange differences
- 2.2.17 Recognition of income and expenses
- 2.2.18 Sales of assets and income from the provision of non-financial services
- 2.2.19 Leases
- 2.2.20 Entities and branches located in countries with hyperinflationary economies
- 2.3 Recent IFRS pronouncements
- 3. BBVA Group
- 4. Shareholder remuneration system
- 5. Earnings per share
- 6. Operating segment reporting
- 7. Risk management
- 7.1 General risk management and control model
- 7.1.1 Governance and organization
- 7.1.2 Risk Appetite Framework
- 7.1.3 Decisions and processes
- 7.1.4 Assessment, monitoring and reporting
- 7.1.5 Infrastructure
- 7.1.6 Risk culture
- 7.2 Risk factors
- 7.3 Credit risk
- 7.3.1 Credit risk exposure
- 7.3.2 Mitigation of credit risk, collateralized credit risk and other credit enhancements
- 7.3.3 Credit quality of financial assets that are neither past due nor impaired
- 7.3.4 Past due but not impaired and impaired secured loans risks
- 7.3.5 Impairment losses
- 7.3.6 Refinancing and restructuring operations
- 7.4 Market risk
- 7.5 Liquidity risk
- 7.6 Operational Risk
- 7.7 Risk concentration
- 8. Fair value
- 8.1 Fair value of financial instrument
- 8.1.1 Fair value of financial instrument recognized at fair value, according to valuation criteria
- 8.1.2 Fair value of financial instruments carried at cost
- 8.2 Assets measured at fair value on a non-recurring basis
- 9. Cash and cash balances at central banks and other demands deposits and Financial liabilities measured at amortized cost
- 10. Financial assets and liabilities held for trading
- 11. Financial assets and liabilities designated at fair value through profit or loss
- 12. Available-for-sale financial assets
- 12.1 Available-for-sale financial assets - Balance details
- 12.2 Debt securities
- 12.3 Equity instruments
- 12.4 Gains/losses
- 13. Loans and receivables
- 13.1 Loans and advances - Balance details
- 13.2 Loans and advances to central banks and credit institutions
- 13.3 Loans and advances to customers
- 13.4 Debt securities
- 14. Held-to-maturity investments
- 15. Hedging derivatives and fair value changes of the hedged items in portfolio hedges of interest rate risk
- 16. Investments in joint ventures and associates
- 16.1 Joint ventures and associates
- 16.2 Other information about associates and joint ventures
- 16.3 Impairment
- 17. Tangible assets
- 18. Intangible assetss
- 19. Tax assets and liabilities
- 19.1 Consolidated tax group
- 19.2 Years open for review by the tax authorities
- 19.3 Reconciliation
- 19.4 Income tax recognized in equity
- 19.5 Current and deferred taxes
- 20. Other assets and liabilities
- 21. Non-current assets and disposal groups held for sale
- 22. Financial liabilities at amortized cost
- 22.1 Breakdown of the balance
- 22.2 Deposits from credit institutions
- 22.3 Customer deposits
- 22.4 Debt securities issued (including bonds and debentures)
- 22.5 Other financial liabilities
- 23. Liabilities under insurance and reinsurance contracts
- 24. Provisions
- 25. Post-employment and other employee benefit commitments
- 26-common-stock
- 27. Share premium
- 28. Retained earnings, revaluation reserves and other reserves
- 28.1 Legal reserve
- 28.2 Restricted reserves
- 28.3 Retained earnings, revaluation reserves and other reserves by entity
- 29. Treasury shares
- 30. Accumulated other comprehensive income (loss)
- 31. Non-controlling interest
- 32. Capital base and capital management
- 33. Commitments and guarantees given
- 34. Other contingent assets and liabilities
- 35. Purchase and sale commitments and future payment obligations
- 36. Transactions on behalf of third parties
- 37. Interest income and expense
- 37.1 Interest income
- 37.2 Interest expense
- 37.3 Average return on investments and average borrowing cost
- 38. Dividend income
- 39. Share of profit or loss of entities accounted for using the equity method
- 40. Fee and commission income and expense
- 41. Gains (losses) on financial assets and liabilities, net and Exchange Differences
- 42. Other operating income and expense
- 43. Income and expense from insurance and reinsurance contracts
- 44. Administration costs
- 45. Depreciation and Amortization
- 46. Provisions or reversal of provisions
- 47. Impairment or reversal of impairment on financial assets not measured at fair value through profit or loss
- 48. Impairment or reversal of impairment on non-financial assets
- 49. Gains (losses) on derecognition of non financial assets and subsidiaries, net
- 50. Profit (loss) from non-current assets and disposal groups classified as held for sale not qualifying as discontinued operations
- 51. Consolidated statements of cash flows
- 52. Accountant fees and services
- 53. Related-party transactions
- 53.1 Transactions with significant shareholders
- 53.2 Transactions with BBVA Group entities
- 53.3 Transactions with members of the Board of Directors and Senior Management
- 53.4 Transactions with other related parties
- 54. Remuneration and other benefits received by the Board of Directors and members of the Bank’s Senior Management
- 55. Other information
- 55.1 Environmental impact
- 55.2 Reporting requirements of the Spanish National Securities Market Commission (CNMV)
- 55.3 Mortgage market policies and procedures
- 56. Subsequent events
- 57. Explanation added for translation into English
1.Introduction, basis for the presentation of the Consolidated Financial Statements, internal control of financial information and other information
1.1 Introduction
Banco Bilbao Vizcaya Argentaria, S.A. (hereinafter “the Bank” or “BBVA") is a private-law entity subject to the laws and regulations governing banking entities operating in Spain. It carries out its activity through branches and agencies across the country and abroad.
The Bylaws and other public information are available for inspection at the Bank’s registered address (Plaza San Nicolás, 4 Bilbao) as noted on its web site (www.bbva.com).
In addition to the activities it carries out directly, the Bank heads a group of subsidiaries, joint ventures and associates which perform a wide range of activities and which together with the Bank constitute the Banco Bilbao Vizcaya Argentaria Group (hereinafter, “the Group” or “the BBVA Group”). In addition to its own separate financial statements, the Bank is required to prepare Consolidated Financial Statements comprising all consolidated subsidiaries of the Group.
As of December 31, 2017, the BBVA Group had 331 consolidated entities and 76 entities accounted for using the equity method (see Notes 3 and 16 and Appendix I to V).
The Consolidated Financial Statements of the BBVA Group for the year ended December 31, 2016 were approved by the shareholders at the Annual General Meetings (“AGM”) on March 17, 2017.
BBVA Group’s consolidated financial statements and the financial statements for the Bank and the majority of the remaining entities within the Group have been prepared as of December 31, 2017, and are pending approval by their respective AGMs. Notwithstanding, the Board of Directors of the Bank understands that said financial statements will be approved without changes.
1.2 Basis for the presentation of the Consolidated Financial Statements
The BBVA Group’s Consolidated Financial Statements are presented in accordance with the International Financial Reporting Standards endorsed by the European Union (hereinafter, “EU-IFRS”) applicable as of December 31, 2017, considering the Bank of Spain Circular 4/2004, of December, 22 (and as amended thereafter), and with any other legislation governing financial reporting applicable to the Group in Spain.
The BBVA Group’s accompanying Consolidated Financial Statements for the year ended December 31, 2017 were prepared by the Group’s Directors (through the Board of Directors held on February 12, 2018) by applying the principles of consolidation, accounting policies and valuation criteria described in Note 2, so that they present fairly the Group’s total consolidated equity and financial position as of December 31, 2017, together with the consolidated results of its operations and cash flows generated during the year ended December 31, 2017.
These Consolidated Financial Statements were prepared on the basis of the accounting records kept by the Bank and each of the other entities in the Group. Moreover, they include the adjustments and reclassifications required to harmonize the accounting policies and valuation criteria used by the Group (see Note 2.2).
All effective accounting standards and valuation criteria with a significant effect in the Consolidated Financial Statements were applied in their preparation.
The amounts reflected in the accompanying Consolidated Financial Statements are presented in millions of euros, unless it is more appropriate to use smaller units. Some items that appear without a balance in these Consolidated Financial Statements are due to how the units are expressed. Also, in presenting amounts in millions of euros, the accounting balances have been rounded up or down. It is therefore possible that the totals appearing in some tables are not the exact arithmetical sum of their component figures.
The percentage changes in amounts have been calculated using figures expressed in thousands of euros.
1.3 Comparative information
The information included in the accompanying Consolidated Financial Statements and the explanatory notes referring to December 31, 2016 and December 31, 2015 are presented exclusively for the purpose of comparison with the information for December 31, 2017.
During 2017, there were no significant changes to the existing structure of the BBVA Group’s operating segments in comparison to 2016 (Note 6). Certain prior year balances have been reclassified to conform to current period presentation.
1.4 Seasonal nature of income and expenses
The nature of the most significant activities carried out by the BBVA Group’s entities is mainly related to typical activities carried out by financial institutions, which are not significantly affected by seasonal factors within the same year.
1.5 Responsibility for the information and for the estimates made
The information contained in the BBVA Group’s Consolidated Financial Statements is the responsibility of the Group’s Directors.
Estimates have to be made at times when preparing these Consolidated Financial Statements in order to calculate the recorded or disclosed amount of some assets, liabilities, income, expenses and commitments. These estimates relate mainly to the following:
- Impairment on certain financial assets (see Notes 7, 12, 13, 14 and 16).
- The assumptions used to quantify certain provisions (see Note 24) and for the actuarial calculation of post-employment benefit liabilities and commitments (see Note 25).
- The useful life and impairment losses of tangible and intangible assets (see Notes 17, 18, 20 and 21).
- The valuation of goodwill and price allocation of business combinations (see Note 18).
- The fair value of certain unlisted financial assets and liabilities (see Notes 7, 8, 10, 11 and 12).
- The recoverability of deferred tax assets (See Note 19).
- The exchange rate and the inflation rate of Venezuela (see Notes 2.2.16 and 2.2.20).
Although these estimates were made on the basis of the best information available as of December 31, 2017, future events may make it necessary to modify them (either up or down) over the coming years. This would be done prospectively in accordance with applicable standards, recognizing the effects of changes in the estimates in the corresponding consolidated income statement.
1.6 BBVA Group’s Internal Control over Financial Reporting
BBVA Group’s Financial Statements is prepared under an Internal Control over Financial Reporting Model (hereinafter “ICFR"). It provides reasonable assurance with respect to the reliability and the integrity of the consolidated financial statements. It is also aimed to ensure that the transactions are processed in accordance with the applicable laws and regulations.
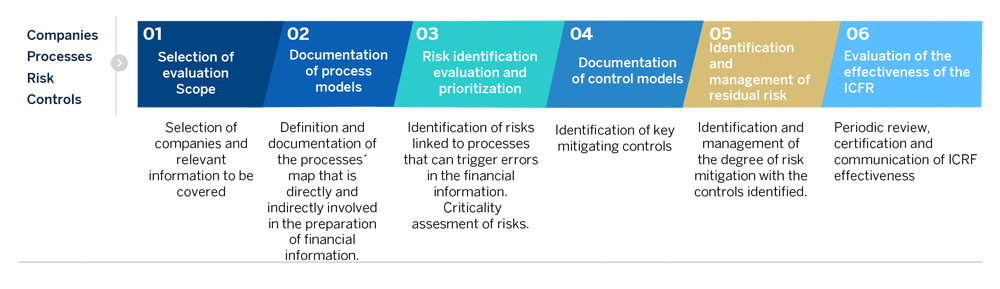
The ICFR is in accordance with the control framework established by the “Committee of Sponsoring Organizations of the Treadway Commission” (hereinafter, "COSO"). The COSO framework sets five components that constitute the basis of the effectiveness and efficiency of the internal control systems:
- The establishment of an appropriate control framework.
- The assessment of the risks that could arise during the preparation of the financial information.
- The design of the necessary controls to mitigate the identified risks.
- The establishment of an appropriate system of information to detect and report system weaknesses.
- The monitoring of the controls to ensure they perform correctly and are effective over time.
The ICFR is a dynamic model that evolves continuously over time to reflect the reality of the BBVA Group’s businesses and processes, as well as the risks and controls designed to mitigate them. It is subject to a continuous evaluation by the internal control units located in the different entities of BBVA Group.
These internal control units are integrated within the BBVA internal control model which is based in two pillars:
- A control system organized into three lines of defense:
- ·The first line is located within the business and support units, which are responsible for identifying risks associated with their processes and to execute the controls established to mitigate them.
- · The second line comprises the specialized control units (Compliance, Internal Financial Control, Internal Risk Control, Engineering Risk, Fraud & Security, and Operations Control among others). This second line defines the models and controls under their areas of responsibility and monitors the design, correct implementation and effectiveness of the controls.
- · The third line is the Internal Audit unit, which conducts an independent review of the model, verifying the compliance and effectiveness of the model.
- A set of committees called Corporate Assurance that helps to escalate the internal control issues to the management at a Group level and also in each of the countries where the Group operates
The internal control units comply with a common and standard methodology established at Group level, as set out in the following diagram:
BBVA's INTERNAL CONTROL OVER FINANCIAL REPORTING
The ICFR Model is subject to annual evaluations by the Group’s Internal Audit Unit. It is also supervised by the Audit and Compliance Committee of the Bank’s Board of Directors
The BBVA Group also complies with the requirements of the Sarbanes-Oxley Act (hereafter “SOX”) for consolidated financial statements as a listed company with the U.S. Securities and Exchange Commission (“SEC”). The main senior executives of the Group are involved in the design, compliance and implementation of the internal control model to make it effective and to ensure the quality and accuracy of the financial information.
The description of the ICFR for financial information in the Corporate Governance Annual Report, which is included within the Management Report attached to the consolidated financial statements for the year ended December 31, 2017.
2. Principles of consolidation, accounting policies and measurement bases applied and recent IFRS pronouncement
The Glossary includes the definition of some of the financial and economic terms used in Note 2 and subsequent Notes.
2.1 Principles of consolidation
In terms of its consolidation, in accordance with the criteria established by IFRS, the BBVA Group is made up of four types of entities: subsidiaries, joint ventures, associates and structured entities, defined as follows:
- Subsidiaries
- Subsidiaries are entities controlled by the Group (for definition of the criterion for control, see Glossary).The financial statements of the subsidiaries are fully consolidated with those of the Bank. The share of non-controlling interests from subsidiaries in the Group’s consolidated total equity is presented under the heading “Non-controlling interests” in the consolidated balance sheet. Their share in the profit or loss for the period or year is presented under the heading “Attributable to minority interest” in the accompanying consolidated income statement (see Note 31).
- Note 3 includes information related to the main subsidiaries in the Group as of December 31, 2017. Appendix I includes other significant information on these entities.
- Joint ventures
- Joint ventures are those entities over which there is a joint arrangement to joint control with third parties other than the Group (for definitions of joint arrangement, joint control and joint venture, refer to Glossary).
- The investments in joint ventures are accounted for using the equity method (see Note 16). Appendix II shows the main figures for joint ventures accounted for using the equity method.
- Associates
- Associates are entities in which the Group is able to exercise significant influence (for definition of significant influence, see Glossary). Significant influence is deemed to exist when the Group owns 20% or more of the voting rights of an investee directly or indirectly, unless it can be clearly demonstrated that this is not the case.
- However, certain entities in which the Group owns 20% or more of the voting rights are not included as Group associates, since the Group does not have the ability to exercise significant influence over these entities. Investments in these entities, which do not represent material amounts for the Group, are classified as “Available-for-sale financial assets".
- In contrast, some investments in entities in which the Group holds less than 20% of the voting rights are accounted for as Group associates, as the Group is considered to have the ability to exercise significant influence over these entities. As of December 31, 2017, these entities are not significant in the Group.
- Appendix II shows the most significant information related to the associates (see Note 16), which are accounted for using the equity method.
- Structured Entities
- A structured entity is an entity that has been designed so that voting or similar rights are not the dominant factor in deciding who controls the entity, such as when the voting rights relate to administrative matters only and the relevant activities are directed by means of contractual arrangements (see Glossary).
- In those cases where the Group sets up entities or has a holding in such entities, in order to allow its customers access to certain investments, to transfer risks or for other purposes, in accordance with internal criteria and procedures and with applicable regulations, the Group determines whether control over the entity in question actually exists and therefore whether it should be subject to consolidation.
- Such methods and procedures determine whether there is control by the Group, considering how the decisions are made about the relevant activities, assesses whether the Group has all power over the relevant elements, exposure, or rights, to variable returns from involvement with the investee and the ability to use power over the investee to affect the amount of the investor’s returns.
- Structured entities subject to consolidation
- To determine if a structured entity is controlled by the Group, and therefore should be consolidated into the Group, the existing contractual rights (different from the voting rights) are analyzed. For this reason, an analysis of the structure and purpose of each investee is performed and, among others, the following factors will be considered:
- - Evidence of the current ability to manage the relevant activities of the investee according to the specific business needs (including any decisions that may arise only in particular circumstances).
- - Potential existence of a special relationship with the investee.
- - Implicit or explicit Group commitments to support the investee.
- - The ability to use the Group ́s power over the investee to affect the amount of the Group’s returns.
- There are cases where the Group has a high exposure to variable returns and retains decision- making power over the investee, either directly or through an agent.
- The main structured entities of the Group are the asset securitization funds, to which the BBVA Group transfers loans and receivables portfolios, and other vehicles, which allow the Group’s customers to gain access to certain investments or to allow for the transfer of risks or for other purposes (see Appendices I and V). The BBVA Group maintains the decision-making power over the relevant activities of these vehicles and financial support through securitized market standard contracts. The most common ones are: investment positions in equity note tranches, funding through subordinated debt, credit enhancements through derivative instruments or liquidity lines, management rights of defaulted securitized assets, “clean-up” call derivatives, and asset repurchase clauses by the grantor.
- For these reasons, the loans and receivable portfolios related to the vast majority of the securitizations carried out by the Bank or Group subsidiaries are not derecognized in the books of said entity and the issuances of the related debt securities are registered as liabilities within the Group’s consolidated balance sheet.
- Non-consolidated structured entities
- The Group owns other vehicles also for the purpose of allowing customers access to certain investments, to transfer risks, and for other purposes, but without the Group having control of the vehicles, which are not consolidated in accordance with “IFRS 10 - Consolidated Financial Statements”. The balance of assets and liabilities of these vehicles is not material in relation to the Group’s Consolidated Financial Statements.
- As of December 31, 2017, there was no material financial support from the Bank or its subsidiaries to unconsolidated structured entities
- The Group does not consolidate any of the mutual funds it manages since the necessary control conditions are not met (see definition of control in the Glossary). Particularly, the BBVA Group does not act as arranger but as agent since it operates the mutual funds on behalf and for the benefit of investors or parties (arranger or arrangers) and, for this reason it does not control the mutual funds when exercising its authority for decision making.
- The mutual funds managed by the Group are not considered structured entities (generally, retail funds without corporate identity over which investors have participations which gives them ownership of said managed equity). These funds are not dependent on a capital structure that could prevent them from carry out activities without additional financial support, being in any case insufficient as far as the activities themselves are concerned. Additionally, the risk of the investment is absorbed by the fund participants, and the Group is only exposed when it becomes a participant, and as such, there is no other risk for the Group.
In all cases, the operating results of equity method investees acquired by the BBVA Group in a particular period only include the period from the date of acquisition to the financial statements date. Similarly, the results of entities disposed of during any only include year the period from the start of the year to the date of disposal.
The consolidated financial statements of subsidiaries, associates and joint ventures used in the preparation of the Consolidated Financial Statements of the Group have the same date of presentation as the Consolidated Financial Statements. If financial statements at those same dates are not available, the most recent will be used, as long as these are not older than three months, and adjusted to take into account the most significant transactions. As of December 31, 2017, except for the case of the consolidated financial statements of a subsidiary and five associates and joint-ventures deemed non-significant for which financial statements as of November 30, 2017 were used, the December 31, 2017 financial statements for of all Group entities were utilized.
BBVA banking subsidiaries, associates and joint venture worldwide, are subject to supervision and regulation from a variety of regulatory bodies in relation to, among other aspects, the satisfaction of minimum capital requirements. The obligation to satisfy such capital requirements may affect the ability of such entities to transfer funds in the form of cash dividends, loans or advances. In addition, under the laws of the various jurisdictions where such entities are incorporated, dividends may only be paid out through funds legally available for such purpose. Even when the minimum capital requirements are met and funds are legally available, the relevant regulators or other public administrations could discourage or delay the transfer of funds to the Group in the form of cash, dividends, loans or advances for prudential reasons.
Separate financial statements
The separate financial statements of the parent company of the Group (Banco Bilbao Vizcaya Argentaria, S.A.) are prepared under Spanish regulations (Circular 4/2004 of the Bank of Spain, and subsequent amendments) and following other regulatory requirements of financial information applicable to the Bank. The Bank uses the cost method to account in its separate financial statements for its investments in subsidiaries, associates and joint venture entities, which are consistent with the requirements of Bank of Spain Circular 4/2004 and IAS 27.
Appendix IX shows BBVA’s financial statements as of and for the years ended December 31, 2017 and 2016.
2.2 Accounting policies and valuation criteria applied
The accounting standards and policies and the valuation criteria applied in preparing these Consolidated Financial Statements may differ from those used by some of the entities within the BBVA Group. For this reason, necessary adjustments and reclassifications have been made in the consolidation process to standardize these principles and criteria and comply with the EU-IFRS.
The accounting standards and policies and valuation criteria used in preparing the accompanying Consolidated Financial Statements are as follows:
2.2.1 Financial instruments
Measurement of financial instruments and recognition of changes in subsequent fair value
All financial instruments are initially accounted for at fair value plus, in the case of a financial asset or financial liability not at fair value through profit or loss, transaction costs that are directly attributable to the acquisition or issue of the financial asset or financial liability, unless there is evidence to the contrary, the best evidence of the fair value of a financial instrument at initial recognition shall be the transaction price.
Excluding all trading derivatives not considered as economic hedges, all the changes in the fair value of the financial instruments arising from the accrual of interest and similar items are recognized under the headings “Interest income” or “Interest expenses”, as appropriate, in the accompanying consolidated income statement in which period the change occurred (see Note 37). The dividends received from other entities, other than associated entities and joint venture entities, are recognized under the heading “Dividend income” in the accompanying consolidated income statement in the period in which the right to receive them arises (see Note 38).
The changes in fair value after the initial recognition, for reasons other than those mentioned in the preceding paragraph, are treated as described below, according to the categories of financial assets and liabilities.
“Financial assets and liabilities held for trading” and “Financial assets and liabilities designated at fair value through profit or loss”
The assets and liabilities recognized under these headings of the consolidated balance sheets are measured upon acquisition at fair value and changes in the fair value (gains or losses) are recognized as their net value under the heading “Gains (losses) on financial assets and liabilities, net” in the accompanying consolidated income statements (see Note 41). Interests from derivatives designated as economic hedges on interest rate are recognized in interest income or expense (Note 37), depending on the result of the hedging instrument. However, changes in fair value resulting from variations in foreign exchange rates are recognized under the heading “Exchange differences, net" in the accompanying consolidated income statements (Note 41).
“Available-for-sale financial assets”
Assets recognized under this heading in the consolidated balance sheets are measured at their fair value. Subsequent changes in fair value (gains or losses) are recognized temporarily net of tax effect, under the heading “Accumulated other comprehensive income- Items that may be reclassified to profit or loss - Available-for-sale financial assets” in the consolidated balance sheets (see Note 30).
The amounts recognized under the headings “Accumulated other comprehensive income- Items that may be reclassified to profit or loss - Available-for-sale financial assets” and “Accumulated other comprehensive income- Items that may be reclassified to profit or loss - Exchange differences” continue to form part of the Group's consolidated equity until the corresponding asset is derecognized from the consolidated balance sheet or until an impairment loss is recognized on the corresponding financial instrument. If these assets are sold, these amounts are derecognized and included under the headings “Gains (losses) on financial assets and liabilities, net” or “Exchange differences, net", as appropriate, in the consolidated income statement for the year in which they are derecognized (see Note 41).
The net impairment losses in “Available-for-sale financial assets” over the year are recognized under the heading “Impairment losses on financial assets, net – Other financial instruments not at fair value through profit or loss” (see Note 47) in the consolidated income statements for that period.
Changes in the value of non-monetary items resulting from changes in foreign exchange rates are recognized temporarily under the heading “Accumulated other comprehensive income- Items that may be reclassified to profit or loss - Exchange differences” in the accompanying consolidated balance sheets. Changes in foreign exchange rates resulting from monetary items are recognized under the heading “Exchange differences, net" in the accompanying consolidated income statements (see Note 41).
“Loans and receivables”, “Held-to-maturity investments” and “Financial liabilities at amortized cost”
Assets and liabilities recognized under these headings in the accompanying consolidated balance sheets are subsequently measured at “amortized cost” using the “effective interest rate” method. This is because the consolidated entities generally intend to hold such financial instruments to maturity.
Net impairment losses of assets recognized under these headings arising in each period are recognized under the heading “Impairment or reversal of impairment on financial assets not measured at fair value through profit or loss – loans and receivables”, “Impairment or reversal of impairment on financial assets not measured at fair value through profit or loss - held to maturity investments” or “Impairment or reversal of impairment on financial assets not measured at fair value through profit or loss – financial assets measured at cost” (see Note 47) in the consolidated income statement for that period.
“Derivatives-Hedge Accounting” and “Fair value changes of the hedged items in portfolio hedges of interest- rate risk”
Assets and liabilities recognized under these headings in the accompanying consolidated balance sheets are measured at fair value.
Changes occurring subsequent to the designation of the hedging relationship in the measurement of financial instruments designated as hedged items as well as financial instruments designated as hedge accounting instruments are recognized as follows:
- In fair value hedges, the changes in the fair value of the derivative and the hedged item attributable to the hedged risk are recognized under the heading “Gains or losses from hedge accounting, net” in the consolidated income statement, with a corresponding offset under the headings where hedging items ("Hedging derivatives") and the hedged items are recognized, as applicable. Almost all of the hedges used by the Group are for interest-rate risks. Therefore, the valuation changes are recognized under the headings “Interest income” or “Interest expenses”, as appropriate, in the accompanying consolidated income statement (see Note 37).
- In fair value hedges of interest rate risk of a portfolio of financial instruments (portfolio-hedges), the gains or losses that arise in the measurement of the hedging instrument are recognized in the consolidated income statement, and the gains or losses that arise from the change in the fair value of the hedged item (attributable to the hedged risk) are also recognized in the consolidated income statement (in both cases under the heading “Gains or losses from hedge accounting, net”, using, as a balancing item, the headings "Fair value changes of the hedged items in portfolio hedges of interest rate risk" in the consolidated balance sheets, as applicable.
- In cash flow hedges, the gain or loss on the hedging instruments relating to the effective portion are recognized temporarily under the heading ”Accumulated other comprehensive income - Items that may be reclassified to profit or loss - Hedging derivatives. Cash flow hedges” in the consolidated balance sheets, with a balancing entry under the heading “Hedging derivatives” of the Assets or Liabilities of the consolidated balance sheets as applicable. These differences are recognized in the accompanying consolidated income statement at the time when the gain or loss in the hedged instrument affects profit or loss, when the forecast transaction is executed or at the maturity date of the hedged item (see Note 37).
- Differences in the measurement of the hedging items corresponding to the ineffective portions of cash flow hedges are recognized directly in the heading “Gains or losses from hedge accounting, net” in the consolidated income statement (see Note 41).
- In the hedges of net investments in foreign operations, the differences attributable to the effective portions of hedging items are recognized temporarily under the heading "Accumulated other comprehensive income - Items that may be reclassified to profit or loss – Hedging of net investments in foreign transactions" in the consolidated balance sheets with a balancing entry under the heading “Hedging derivatives” of the Assets or Liabilities of the consolidated balance sheets as applicable. These differences in valuation are recognized under the heading “Exchange differences, net" in the consolidated income statement when the investment in a foreign operation is disposed of or derecognized (see Note 41).
Other financial instruments
The following exceptions are applicable with respect to the above general criteria:
- Equity instruments whose fair value cannot be determined in a sufficiently objective manner and financial derivatives that have those instruments as their underlying asset and are settled by delivery of those instruments are recorded in the consolidated balance sheet at acquisition cost; this may be adjusted, where appropriate, for any impairment loss (see Note 8).
- Accumulated other comprehensive income arising from financial instruments classified at the consolidated balance sheet date as “Non-current assets and disposal groups classified as held for sale” are recognized with the corresponding entry under the heading “Accumulated other comprehensive income- Items that may be reclassified to profit or loss – Non-current assets and disposal groups classified as held for sale” in the accompanying consolidated balance sheets (see note 30).
Impairment losses on financial assets
Definition of impaired financial assets carried at amortized cost
A financial asset is considered impaired – and therefore its carrying amount is adjusted to reflect the effect of impairment – when there is objective evidence that events have occurred, which:
- In the case of debt instruments (loans and advances and debt securities), reduce the future cash flows that were estimated at the time the instruments were acquired. So they are considered impaired when there are reasonable doubts that the carrying amounts will be recovered in full and/or the related interest will be collected for the amounts and on the dates initially agreed.
- In the case of equity instruments, it means that their carrying amount may not be fully recovered.
As a general rule, the carrying amount of impaired financial assets is adjusted with a charge to the consolidated income statement for the period in which the impairment becomes known. The recoveries of previously recognized impairment losses are reflected, if appropriate, in the consolidated income statement for the year in which the impairment is reversed or reduced, with an exception: any recovery of previously recognized impairment losses for an investment in an equity instrument classified as financial assets available for sale is not recognized in the consolidated income statement, but under the heading " Accumulated other comprehensive income - Items that may be reclassified to profit or loss - Available-for- sale financial assets" in the consolidated balance sheet (see Note 30).
In general, amounts collected on impaired loans and receivables are used to recognize the related accrued interest and any excess amount is used to reduce the unpaid principal.
When the recovery of any recognized amount is considered remote, such amount is written-off on the consolidated balance sheet, without prejudice to any actions that may be taken in order to collect the amount until the rights extinguish in full either because it is time-barred debt, the debt is forgiven, or other reasons.
Impairment on financial assets
The impairment on financial assets is determined by type of instrument and other circumstances that could affect it, taking into account the guarantees received to assure (in part or in full) the performance of the financial assets. The BBVA Group recognizes impairment charges directly against the impaired financial asset when the likelihood of recovery is deemed remote, and uses an offsetting or allowance account when it recognizes non-performing loan provisions for the estimated losses.
Impairment of debt instruments measured at amortized cost
With regard to impairment losses arising from insolvency risk of the obligors (credit risk), a debt instrument, mainly Loans and receivables, is impaired due to insolvency when a deterioration in the ability to pay by the obligor is evidenced, either due to past due status or for other reasons.
The BBVA Group has developed policies, methods and procedures to estimate incurred losses on outstanding credit risk. These policies, methods and procedures are applied in the due diligence, approval and execution of debt instruments and Commitments and guarantees given; as well as in identifying the impairment and, where appropriate, in calculating the amounts necessary to cover estimated losses.
The amount of impairment losses on debt instruments measured at amortized cost is calculated based on whether the impairment losses are determined individually or collectively. First it is determined whether there is objective evidence of impairment individually for individually significant debt instrument, and collectively for debt instrument that are not individually significant. If the Group determines that there is no objective evidence of impairment, the assets are classified in groups of debt instrument based on similar risk characteristics and impairment is assessed collectively.
In determining whether there is objective evidence of impairment the Group uses observable data in the following aspects:
- Significant financial difficulties of the obligors.
- Ongoing delays in the payment of interest or principal.
- Refinancing of credit due to financial difficulties by the counterparty.
- Bankruptcy or reorganization / liquidation are considered likely.
- Disappearance of the active market for a financial asset because of financial difficulties.
- Observable data indicating a reduction in future cash flows from the initial recognition such as adverse changes in the payment status of the counterparty (delays in payments, reaching credit cards limits, etc.).
- National or local economic conditions that are linked to "defaults" in the financial assets (unemployment rate, falling property prices, etc.).
Impairment losses on financial assets individually evaluated for impairment
The amount of the impairment losses incurred on financial assets represents the excess of their respective carrying amounts over the present values of their expected future cash flows. These cash flows are discounted using the original effective interest rate. If a financial asset has a variable interest rate, the discount rate for measuring any impairment loss is the current effective rate determined under the contract.
As an exception to the rule described above, the market value of listed debt instruments is deemed to be a fair estimate of the present value of their expected future cash flows.
The following is to be taken into consideration when estimating the future cash flows of debt instruments:
- All amounts that are expected to be recovered over the remaining life of the debt instrument; including, where appropriate, those which may result from the collateral and other credit enhancements provided for the debt instrument (after deducting the costs required for foreclosure and subsequent sale). Impairment losses include an estimate for the possibility of collecting accrued, past-due and uncollected interest.
- The various types of risk to which each debt instrument is subject.
- The circumstances in which collections will foreseeably be made.
Impairment losses on financial assets collectively evaluated for impairment
With regard to the collective impairment analysis, financial assets are grouped by risk type considering the debtor's capacity to pay based on the contractual terms. As part of this analysis, the BBVA Group estimates the impairment loan losses that are not individually significant, distinguishing between those that show objective evidence of impairment, and those that do not show objective evidence of impairment, as well as the impairment of significant loans that the BBVA Group has deemed as not showing an objective evidence of impairment.
With respect to financial assets that have no objective evidence of impairment, the Group applies statistical methods using historical experience and other specific information to estimate the losses that the Group has incurred as a result of events that have occurred as of the date of preparation of the Consolidated Financial Statements but have not been known and will be apparent, individually after the date of submission of the information. This calculation is an intermediate step until these losses are identified on an individual level, at which time these financial instruments will be segregated from the portfolio of financial assets without objective evidence of impairment.
The incurred loss is calculated taking into account three key factors: exposure at default, probability of default and loss given default.
- Exposure at default (EAD) is the amount of risk exposure at the date of default by the counterparty.
- Probability of default (PD) is the probability of the counterparty failing to meet its principal and/or interest payment obligations. The PD is associated with the rating/scoring of each counterparty/transaction.
- Loss given default (LGD) is the estimate of the loss arising in the event of default. It depends mainly on the characteristics of the counterparty, and the valuation of the guarantees or collateral associated with the asset.
In order to calculate the LGD at each balance sheet date, the Group evaluates the whole amount expected to be obtained over the remaining life of the financial asset. The recoverable amount from executable secured collateral is estimated based on the property valuation, discounting the necessary adjustments to adequately account for the potential fall in value until its execution and sale, as well as execution costs, maintenance costs and sale costs.
In addition, to identify the possible incurred but not reported losses (IBNR) in the unimpaired portfolio, an additional parameter called "LIP" (loss identification period) has to be introduced. The LIP parameter is the period between the time at which the event that generates a given loss occurs and the time when the loss is identified at an individual level.
When the property right is contractually acquired at the end of the foreclosure process or when the assets of distressed borrowers are purchased, the asset is recognized in the consolidated balance sheets (see Note 2.2.4).
Impairment of other debt instruments classified as financial assets available for sale
The impairment losses on other debt instruments included in the “Available-for-sale financial asset” portfolio are equal to the excess of their acquisition cost (net of any principal repayment), after deducting any impairment loss previously recognized in the consolidated income statement over their fair value.
When there is objective evidence that the negative differences arising on measurement of these debt instruments are due to impairment, they are no longer considered as “Accumulated other comprehensive income - Items that may be reclassified to profit or loss - Available-for-sale financial assets” and are recognized in the consolidated income statement.
If all, or part of the impairment losses are subsequently recovered, the amount is recognized in the consolidated income statement for the year in which the recovery occurred, up to the amount previously recognized in the income statement.
Impairment of equity instruments
The amount of the impairment in the equity instruments is determined by the category where they are recognized:
- Equity instruments classified as available for sale: When there is objective evidence that the negative differences arising on measurement of these equity instruments are due to impairment, they are no longer registered as “Accumulated other comprehensive income - Items that may be reclassified to profit or loss - Available-for-sale financial assets” and are recognized in the consolidated income statement. In general, the Group considers that there is objective evidence of impairment on equity instruments classified as available-for-sale when significant unrealized losses have existed over a sustained period of time due to a price reduction of at least 40% or over a period of more than 18 months.
- When applying this evidence of impairment, the Group takes into account the volatility in the price of each individual equity instrument to determine whether it is a percentage that can be recovered through its sale in the market; other different thresholds may exist for certain equity instruments or specific sectors.
- In addition, for individually significant investments, the Group compares the valuation of the most significant equity instruments against valuations performed by independent experts.
- Any recovery of previously recognized impairment losses for an investment in an equity instrument classified as available for sale is not recognized in the consolidated income statement, but under the heading " Accumulated other comprehensive income - Items that may be reclassified to profit or loss - Available-for-sale financial assets" in the consolidated balance sheet (see Note 30).
- Equity instruments measured at cost:: The impairment losses on equity instruments measured at acquisition cost are equal to the excess of their carrying amount over the present value of expected future cash flows discounted at the market rate of return for similar equity instruments. In order to determine these impairment losses, unless there is better evidence, an assessment of the equity of the investee is carried out (excluding Accumulated other comprehensive income due to cash flow hedges) based on the last approved (consolidated) balance sheet, adjusted by the unrealized gains at measurement date.
- Impairment losses are recognized in the consolidated income statement in the year in which they arise as a direct reduction of the cost of the instrument. These impairment losses may only be recovered subsequently in the event of the sale of these assets.
- The transferred financial asset is not derecognized from the consolidated balance sheet and continues to be measured using the same criteria as those used before the transfer.
- A financial liability is recognized at the amount equal to the amount received, which is subsequently measured at amortized cost or fair value with changes in the income statement, whichever the case.
- Both the income generated on the transferred (but not derecognized) financial asset and the expenses of the new financial liability continue to be recognized.
- the sum of the consideration transferred, the amount of all the non-controlling interests and the fair value of stock previously held in the acquired business; and
- the net fair value of the assets acquired and liabilities assumed.
- Is the lowest level at which the entity manages goodwill internally.
- Is not larger than an operating segment.
- Life insurance provisions:
- Represents the value of the net obligations undertaken with the life insurance policyholder. These provisions include:
- · Provisions for unearned premiums. These are intended for the accrual, at the date of calculation, of the premiums written. Their balance reflects the portion of the premiums received until the closing date that has to be allocated to the period from the closing date to the end of the insurance policy period.
- · Mathematical reserves: Represents the value of the life insurance obligations of the insurance entities at year-end, net of the policyholder’s obligations, arising from life insurance contracted.
- Non-life insurance provisions:
- · Provisions for unearned premiums. These provisions are intended for the accrual, at the date of calculation, of the premiums written. Their balance reflects the portion of the premium received until year-end that has to be allocated to the period between the year-end and the end of the policy period.
- · Provisions for unexpired risks: The provision for unexpired risks supplements the provision for unearned premiums by the amount by which that provision is not sufficient to reflect the assessed risks and expenses to be covered by the consolidated insurance subsidiaries in the policy period not elapsed at year-end.
- Provision for claims:
- This reflects the total amount of the outstanding obligations arising from claims incurred prior to year-end. Insurance subsidiaries calculate this provision as the difference between the total estimated or certain cost of the claims not yet reported, settled or paid, and the total amounts already paid in relation to these claims.
- Provision for bonuses and rebates:
- This provision includes the amount of the bonuses accruing to policyholders, insurees or beneficiaries and the premiums to be returned to policyholders or insurees, as the case may be, based on the behavior of the risk insured, to the extent that such amounts have not been individually assigned to each of them.
- Technical provisions for reinsurance ceded:
- Calculated by applying the criteria indicated above for direct insurance, taking account of the assignment conditions established in the reinsurance contracts in force.
- Other technical provisions:
- Insurance entities have recognized provisions to cover the probable mismatches in the market reinvestment interest rates with respect to those used in the valuation of the technical provisions.
- They represent a current obligation that has arisen from a past event. At the date of the Consolidated Financial Statements, there is more probability that the obligation will have to be met than that it will not.
- It is probable that an outflow of resources embodying economic benefits will be required to settle the obligation.
- The amount of the obligation can be reasonably estimated.
- They should be unbiased, i.e. neither unduly optimistic nor excessively conservative.
- Each assumption does not contradict the others and adequately reflect the existing relationship between economic variables such as price inflation, expected wage increases, discount rates and the expected return on plan assets, etc. Future wage and benefit levels should be based on market expectations, at the balance sheet date, for the period over which the obligations are to be settled.
- The interest rate used to discount benefit commitments is determined by reference to market yields, at the balance sheet date, on high quality bonds.
- Conversion of the foreign currency to the entity’s functional currency (currency of the main economic environment in which the entity operates); and
- Conversion to euros of the balances held in the functional currencies of the entities whose functional currency is not the euro.
- Non-monetary items valued at their historical cost are converted to the functional currency at the exchange rate applicable on the purchase date.
- Non-monetary items valued at their fair value are converted at the exchange rate in force on the date on which such fair value was determined.
- Income and expenses are converted at the period’s average exchange rates for all the operations carried out during the period. When applying this criterion the BBVA Group considers whether significant variations have taken place in exchange rates during the year which, owing to their impact on the statements as a whole, may require the application of exchange rates as of the date of the transaction instead of such average exchange rates.
- Assets and liabilities: at the closing spot exchange rates as of the date of each of the consolidated balance sheets.
- Income and expenses and cash flows are converted by applying the exchange rate applicable on the date of the transaction, and the average exchange rate for the financial year may be used, unless it has undergone significant variations.
- Equity items: at the historical exchange rates.
- Since December 31, 2015, the Board of Directors considers that the use of the Venezuelan official exchanges rates for converting bolivars into euros in preparing the Consolidated Financial Statements does not reflect the true picture of the financial statements of the Group and the financial position of the Group subsidiaries in Venezuela.
- Consequently, as of December 31, 2017, 2016 and 2015, the Group has used foreign exchange rates of 18,181, 1,893 and 469 Venezuelan bolivars per euro, respectively in the conversion of the financial statements. These exchanges rates have been calculated taking into account the estimated evolution of inflation in Venezuela, in the absence of published official data (800%, 300%, and 170%, as of December 31, 2017, 2016 and 2015, respectively) (see Note 2.2.20). These inflation rates have been calculated based on the best estimate of the Group, taking into consideration the available information that includes sectorial aspects that affect the Group's subsidiaries in Venezuela.
Interest income and expenses and similar items:
As a general rule, interest income and expenses and similar items are recognized on the basis of their period of accrual using the effective interest rate method. The financial fees and commissions that arise on the arrangement of loans and advances (basically origination and analysis fees) are deferred and recognized in the income statement over the expected life of the loan. From that amount, the transaction costs identified as directly attributable to the arrangement of the loans and advances will be deducted. These fees are part of the effective interest rate for the loans and advances. Also dividends received from other entities are recognized as income when the consolidated entities’ right to receive them arises.
Once a debt instrument has been impaired, interest income is recognized applying the effective interest rate used to discount the estimated recoverable cash flows on the carrying amount of the asset.
Commissions, fees and similar items:
Income and expenses relating to commissions and similar fees are recognized in the consolidated income statement using criteria that vary according to the nature of such items. The most significant items in this connection are:
- · Those relating to financial assets and liabilities measured at fair value through profit or loss, which are recognized when collected/paid.
- · Those arising from transactions or services that are provided over a period of time, which are recognized over the life of these transactions or services.
- · Those relating to a singular transaction, which are recognized when this singular transaction is carried out.
- Non-financial income and expenses:
- These are recognized for accounting purposes on an accrual basis.
- Deferred collections and payments:
- These are recognized for accounting purposes at the amount resulting from discounting the expected cash flows at market rates.
- The country’s population prefers to keep its wealth or savings in non-monetary assets or in a relatively stable foreign currency.
- Prices may be quoted in a relatively stable foreign currency;
- Interest rates, wages and prices are linked to a price index;
- The cumulative inflation rate over three years is approaching, or exceeds, 100%.
- (*) At the date of preparation of consolidated financial statements of each year, the Venezuelan government had not released the official inflation figures at the end of the year. Therefore, the Group estimates the inflation rate applicable to the preparation of the Consolidated Financial Statements for each year, based on the best estimate of BBVA Research of the Group, considering other estimates made by various international organizations.
- Classification and measurement of financial instruments
- Financial assets impairments
- Expected loss at 12 months: expected credit loss that arises from possible default events within the 12 months following the presentation date of the financial statements; and
- Expected loss during the life of the transaction: this is the expected credit loss that arises from all the possible default events over the expected life of the financial instrument.
- Default
- BBVA has applied a definition of default for financial instruments that is consistent with that used in internal credit risk management, as well as the indicators under applicable regulation at the date of entry into force of IFRS 9. Both qualitative and quantitative indicators have been considered.
- The Group has considered there is a default when one of the following situations occurs:
- • payment past-due for more than 90 days; or
- • there are reasonable doubts regarding the full reimbursement of the instrument.
- The 90-day past-due stipulation may be waived in cases where the entity considers it appropriate, based on reasonable and documented information that it is appropriate to use a longer term.
- Credit impaired asset
- An asset is credit-impaired according to IFRS 9 if one or more events have occurred and they have a detrimental impact on the estimated future cash flows of the asset. Evidence that a financial asset is credit-impaired includes observable data about the following events:
- • Significant financial difficulty of the issuer or the borrower.
- • A breach of contract (e.g. a default or past due event).
- • A lender having granted a concession to the borrower – for economic or contractual reasons relating to the borrower’s financial difficulty – that the lender would not otherwise consider.
- • It becoming probable that the borrower will enter bankruptcy or other financial reorganization.
- • The disappearance of an active market for that financial asset because of financial difficulties.
- • The purchase or origination of a financial asset at a deep discount that reflects the incurred credit losses.
- It may not be possible to identify a single discrete event. Instead, the combined effect of several events may cause financial assets to become credit-impaired.
- It may not be possible to identify a single discrete event. Instead, the combined effect of several events may cause financial assets to become credit-impaired.
- Significant increase in credit risk
- The objective of the impairment requirements is to recognize lifetime expected credit losses for financial instruments for which there has been significant increases in credit risk since initial recognition considering all reasonable and supportable information, including that which is forward- looking.
- The model developed by the Group for assessing the significant increase in credit risk has a twin approach that is applied globally, although the specific characteristics of each geographic area are respected:
- • Quantitative criterion: the Group uses a quantitative analysis based on comparing the current expected probability of default over the life of the transaction with the original adjusted expected probability of default, so that both values are comparable in terms of expected default probability for their residual life. The thresholds used for considering a significant increase in risk take into account special cases according to geographic areas and portfolios. Depending on how old current operations are, at the time of entry into force of the standard, some simplification will be made to compare the probabilities of default between the current and the original moment, based on the best information available at that moment.
- • Qualitative criterion: most indicators for detecting significant risk increase are included in the Group's systems through rating/scoring systems or macroeconomic scenarios, so quantitative analysis covers the majority of circumstances. The Group plans to use additional qualitative criteria when it considers it necessary to include circumstances that are not reflected in the rating/score systems or macroeconomic scenarios used.
- Additionally, the instruments in which one of the following circumstances occurs are considered Stage 2:
- o More than 30 days past due. Default of more than 30 days is a presumption that can be refuted in those cases in which the entity considers, based on reasonable and documented information, that such non-payment does not represent a significant increase in risk.
- o They are subject to special watch by the Risks units because they show negative signs in their credit quality, even though there may be no objective evidence of impairment.
- o Refinance or restructuring that does not show evidence of impairment.
- Stage 1– without significant increase in credit risk
Financial assets which are not considered to have significantly increased in credit risk have loss allowances measured at an amount equal to 12 months expected credit losses. - Stage 2– significantly increased in credit risk
When the credit risk of a financial asset has increased significantly since the initial recognition, the value correction for losses of that financial instrument will be calculated as the expected credit loss during the entire life of the asset. - Stage 3 - Impaired
When there is objective evidence that the loan is credit impaired, the financial asset is transferred to this category in which value correction for losses of that financial instrument will be calculated as the expected credit loss during the entire life of the asset. - A considered and unbiased amount, determined by evaluating a range of possible results.
- The time value of money.
- Reasonable and supportable information that is available without undue cost or effort and that reflects current conditions and forecasts of future economic conditions.
- Type of operation.
- Rating or scoring tools.
- Credit risk score or rating.
- Type of collateral.
- Amount of time at default for stage 3.
- Segment.
- Qualitative criteria which can have a significant increase in risk.
- Collateral value if it has an impact on the probability of a default event.
- PD: estimate of the probability of default in each period
- EAD: estimate of the exposure in case of default at each future period, taking into account the changes in exposure after the presentation date of the financial statements.
- LGD: estimate of the loss in case of default, calculated as the difference between the contractual cash flows and receivables, including guarantees.
- Hedge accounting
- Estimated impact of adopting IFRS 9
- • the Group has not concluded the tests or the evaluation of the controls of its new IT systems; and
- • the new accounting policies,methodologies and parameters may be subject to changes until the Group presents its financial statements that include the final impact as of the date of initial application.
- Identify a performance obligation (the promise to transfer a good or a service to a customer) in a contract.
- Determine whether a company is a principal (the provider of a good or service) or an agent (responsible for arranging for the good or service to be provided) and
- Determine whether the revenue from granting a license should be recognized at a point in time or over time.
- When measuring the fair value of a cash-settled share-based payment vesting conditions, other than market conditions, the conditions for the irrevocability shall be taken into account by adjusting the number of awards included in the measurement of the liability arising from the transaction.
- A transaction in which an entity settles a share-base payment arrangement net by withholding a specified portion of the equity instruments to meet a statutory tax withholding obligation will be classified as equity settled in its entirety if, without the net settlement feature, the entire share-based payment would otherwise be classified as equity-settled.
- In case of modification of a share-based payment from cash-settled to equity-settled, the modification will be accounted for derecognizing the original liability and recognizing in equity the fair value of the equity instruments granted to the extent that services have been rendered up to the modification date; any difference will be recognized immediately in profit or loss.
- Spain
- The Group’s activity in Spain is mainly through Banco Bilbao Vizcaya Argentaria, S.A., which is the parent company of the BBVA Group. The Group also has other entities that operate in Spain’s banking sector, insurance sector, real estate sector, services and as operational leasing entities.
- Mexico
- The BBVA Group operates in Mexico, not only in the banking sector, but also in the insurance sector through Grupo Financiero Bancomer.
- South America
- The BBVA Group’s activities in South America are mainly focused on the banking and insurance sectors, in the following countries: Argentina, Chile, Colombia, Peru, Paraguay, Uruguay and Venezuela. It has a representative office in Sao Paulo (Brazil).
- The Group owns more than 50% of most of the entities based in these countries. Appendix I shows a list of the entities which, although less than 50% owned by the BBVA Group as of December 31, 2017, are consolidated (see Note 2.1).
- The United States
- The Group’s activity in the United States is mainly carried out through a group of entities with BBVA Compass Bancshares, Inc. at their head, as well as, the New York BBVA branch and a representative office in Silicon Valley (California)
- Turkey
- The Group’s activity in Turkey is mainly carried out through the Garanti Group.
- Rest of Europe
- The Group’s activity in Europe is carried out through banks and financial institutions in Ireland, Switzerland, Italy, Netherlands, Romania and Portugal, branches in Germany, Belgium, France, Italy and the United Kingdom, and a representative office in Moscow.
- Asia-Pacific
- The Group’s activity in this region is carried out through branches (in Taipei, Tokyo, Hong Kong Singapore and Shanghai) and representative offices (in Beijing, Seoul, Mumbai, Abu Dhabi and Jakarta).
- The Board of Directors, at its meeting held on June 22, 2016, approved the payment in cash of €0.08 (€0.0648 net of withholding tax) per BBVA share as the first gross interim dividend against 2016 results. The total amount paid to shareholders on July 11, 2016, after deducting treasury shares held by the Group's companies, amounted to €517 million and is recognized under the headings “Total Equity- Interim Dividends” of the consolidated balance sheet as of December 31, 2016.
- The Board of Directors, at its meeting held on December 21, 2016, approved the payment in cash of €0.08 (€0.0648 withholding tax) per BBVA share, as the second gross interim dividend against 2016 results. The total amount paid to shareholders on January 12, 2017, after deducting treasury shares held by the Group’s Companies, amounted to €525 million and is recognized under the heading “Total Equity- Interim Dividends” of the consolidated balance sheet as of December 31, 2016.
- The Board of Directors, at its meeting held on September 27, 2017, approved the payment in cash of €0.09 (€0.0729 net of withholding tax) per BBVA share, as the first gross interim dividend against 2017 results. The total amount paid to shareholders on October 10, 2017, after deducting treasury shares held by the Group's companies, amounted to €599 million and is recognized under the heading “Total Equity- Interim Dividends” of the consolidated balance sheet as of December 31, 2017.
- (*) Net Income of BBVA, S.A. (see Appendix IX).
- (**) Concerning to the remuneration to shareholders who choose to be paid in cash through the “Dividend Option”.
- (1) Remuneration in the period related to contingent convertible securities, recognized in equity (see Note 22.3).
- (2) Weighted average number of shares outstanding (millions of euros), excluding weighted average of treasury shares during the period.
- (3) Corrective factor, due to the capital increase with pre-emptive subscription right, applied for the previous years.
- (*) Data recalculated due to the mentioned corrective factor (see Notes 26 and 29).
- Banking activity in Spain
- As in previous years, includes the Retail Network in Spain, Corporate and Business Banking (CBB), Corporate & Investment Banking (CIB), BBVA Seguros and Asset Management units in Spain. It also includes the portfolios, finance and structural interest-rate positions of the euro balance sheet.
- Non Core Real Estate
- Includes specialist management in Spain of loans to developers in difficulties and real-estate assets mainly comprised foreclosed assets, originated from both residential mortgages and loans to developers. New loan production to developers or loans to those that are not in difficulties are managed by Banking activity in Spain.
- The United States
- Includes the Group’s business activity in the country through the BBVA Compass group and the BBVA New York branch.
- Mexico
- Includes all the banking and insurance businesses in the country.
- Turkey
- Includes the activity of the Garanti Group.
- South America
- Includes BBVA’s banking and insurance businesses in the region.
- Rest of Eurasia
- Includes business activity in the rest of Europe and Asia, i.e. the Group ́s retail and wholesale businesses in the area.
- (1) The figures corresponding to 2016 and 2015 have been restated in order to allow homogenous comparisons due to changes in the scope of operating segments.
- (1) The figures corresponding to 2016 and 2015 have been restated (see Note 1.3).
- (2) Since the third quarter of 2015, BBVA has consolidated Garanti (39.9% owned as of December 31, 2015). In prior periods, Garanti's revenues and costs are reflected in the segment information only in the proportion of BBVA´s ownership (25.01%). This column includes adjustments resulting from the accounting of the investment in Garanti group using the equity method (versus reflecting the revenues and costs of Garanti only in proportion of BBVA´s ownership Garanti as stated in the management information). This column also includes inter-segment adjustments (see Note 2).
- Governance and organization.
- Risk Appetite Framework.
- Decisions and processes.
- Assessment, monitoring and reporting.
- Infrastructure.
- The corporate area's risk units develop and submit to the Group CRO the proposal for the Group's Risk Appetite Framework, the corporate policies, rules and global procedures and infrastructures within the framework approved by the corporate bodies; they ensure their application and report either directly or through the CRO to the Bank's corporate bodies. Their functions include:
- • Management of the different types of risks at Group level in accordance with the strategy defined by the corporate bodies.
- • Risk planning aligned with the risk appetite framework principles defined by the Group.
- • Monitoring and control of the Group's risk profile in relation to the risk appetite framework approved by the Bank's corporate bodies, providing accurate and reliable information with the required frequency and in the necessary format.
- • Prospective analyses to enable an evaluation of compliance with the risk appetite framework in stress scenarios and the analysis of risk mitigation mechanisms.
- • Management of the technological and methodological developments required for implementing the Model in the Group.
- • Design of the Group's Internal Control model and definition of the methodology, corporate criteria and procedures for identifying and prioritizing the risk inherent in each unit's activities and processes.
- • Validation of the models used and the results obtained by them in order to verify their adaptation to the different uses to which they are applied.
- The risk units in the business units develop and present to the Chief Risk Officer of the geographical and/or business area the risk appetite framework proposal applicable in each geographical and/or business area, independently and always within the Group's strategy/Risk Appetite Framework. They also ensure that the corporate policies and rules approved and applied consistently at a Group level, adapting them if necessary to local requirements; that they are provided with appropriate infrastructures for management and control of their risks, within the global risk infrastructure framework defined by the corporate areas; and that they report to their corporate bodies and/or to senior management, as appropriate.
- Global Credit Risk Management Committee: It is responsible for analyzing and decision-making related to wholesale credit risk admission.
- Wholesale Credit Risk Management Committee: its purpose is the analysis and decision-making regarding the admission of wholesale credit risk of certain customer segments of the BBVA Group.
- Work Out Committee: its purpose is to be informed about decisions taken under the delegation framework regarding risk proposals concerning clients on Watch List levels 1 and 2 and clients classified as NPL of certain customer segments of the BBVA Group, as well the sanction of proposals regarding entries, exits and changes of the Special Monitoring list.
- Monitoring, Assessment & Reporting Committee: It guarantees and ensures the appropriate development of aspects related to risk identification, assessment, monitoring and reporting, with an integrated and cross-cutting vision.
- Asset Allocation Committee: The executive authority responsible for analyzing and deciding on credit risk issues related to processes aimed at achieving a portfolios combination and composition that, under the restrictions imposed by the Risk Appetite framework, allows to maximize the risk adjusted profit subject to an appropriate risk-adjusted return on equity.
- Technology & Analytics Committee: It ensures an appropriate decision-making process regarding the development, implementation and use of the tools and models required to achieve an appropriate management of those risks to which the BBVA Group is exposed.
- Global Markets Risk Unit Global Committee: It is responsible for formalizing, supervising and communicating the monitoring of trading desk risk in all the Global Markets business units, as well as coordinating and approving GMRU key decisions activity, and developing and proposing to GRMC the corporate regulation of the unit.
- Corporate Operational and Outsourcing Risk Admission Committee: It identifies and assesses the operational risks of new businesses, new products and services, and outsourcing initiatives.
- Retail Risk Committee: It ensures the alignment of the practices and processes of the retail credit risk cycle with the approved risk tolerance and with the business growth and development objectives established in the corporate strategy of the Group.
- Asset Management Global Risk Steering Committee: its purpose is to develop and coordinate the strategies, policies, procedures, and infrastructure necessary to identify, assess, measure and manage the material risks facing the bank in the operation of businesses linked to BBVA Asset Management.
- Global Insurance Risk Committee: its purpose is to guarantee the alignment and the communication between all the Insurance Risk Units in the BBVA Group. It will do this by promoting the application of standardized principles, policies, tools and risk metrics in the different regions with the aim of maintaining proper integration of insurance risk management in the Group.
- COPOR: its purpose is to analyze and make decision in relation to the operations of the various geographies in which Global Markets is present.
- To express the maximum levels of risk it is willing to assume, at both Group and geographical and/or business area level.
- To establish a set of guidelines for action and a management framework for the medium and long term that prevent actions from being taken (at both Group and geographical and/or business area level) that could compromise the future viability of the Group.
- To establish a framework for relations with the geographical and/or business areas that, while preserving their decision-making autonomy, ensures they act consistently, avoiding uneven behavior.
- To establish a common language throughout the organization and develop a compliance-oriented risk culture.
- Alignment with the new regulatory requirements, facilitating communication with regulators, investors and other stakeholders, thanks to an integrated and stable risk management framework.
- Solvency: a sound capital position, maintaining resilient capital buffer from regulatory and internal requirements that supports the regular development of banking activity even under stress situations. As a result, BBVA proactively manages its capital position, which is tested under different stress scenarios from a regular basis.
- Liquidity and funding: A sound balance-sheet structure to sustain the business model. Maintenance of an adequate volume of stable resources, a diversified wholesale funding structure, which limits the weight of short term funding and ensures the access to the different funding markets, optimizing the costs and preserving a cushion of liquid assets to overcome a liquidity survival period under stress scenarios.
- Profitability and income recurrence: A sound margin-generation capacity supported by a recurrent business model based on the diversification of assets, a stable funding and a customer focus; combined with a moderate risk profile that limits the credit losses even under stress situations; all focused on allowing income stability and maximizing the risk-adjusted profitability.
- A standardized set of regulations.
- Risk planning.
- Comprehensive management of risks over their life cycle.
- Hierarchy and structure: well-structured information through a clear and simple hierarchy creating relations between documents that depend on each other.
- Simplicity: an appropriate and sufficient number of documents.
- Standardization: a standardized name and content of document.
- Accessibility: ability to search for, and easy access to, documentation through the corporate risk management library.
- Planning: with the aim of ensuring that the Group's activities are consistent with the target risk profile and guaranteeing solvency in the development of the strategy.
- Assessment: a process focused on identifying all the risks inherent to the activities carried out by the Group.
- Formalization: includes the risk origination, approval and formalization stages.
- Monitoring and reporting: continuous and structured monitoring of risks and preparation of reports for internal and/or external (market, investors, etc.) consumption.
- Active portfolio management: focused on identifying business opportunities in existing portfolios and new markets, businesses and products.
- Assess compliance with the risk appetite framework at the present time, through monitoring of the core metrics, metrics by type of risk and the basic structure of limits.
- Assess compliance with the risk appetite framework in the future, through the projection of the risk appetite framework variables, in both a baseline scenario determined by the budget and a risk scenario determined by the stress tests.
- Identify and assess the risk factors and scenarios that could compromise compliance with the risk appetite framework, through the development of a risk repository and an analysis of the impact of those risks.
- Act to mitigate the impact in the Group of the identified risk factors and scenarios, ensuring this impact remains within the target risk profile.
- Supervise the key variables that are not a direct part of the risk appetite framework, but that condition its compliance. These can be either external or internal.
- Identification of the risk factors that can compromise the performance of the Group or of the geographical and/or business areas in relation to the defined risk thresholds.
- Assessment of the impact of the materialization of the risk factors on the metrics that define the Risk Appetite Framework based on different scenarios, including stress scenarios.
- Response to unwanted situations and proposals for readjustment to enable a dynamic management of the situation, even before it takes place.
- Monitoring of the Group's risk profile and of the identified risk factors, through internal, competitor and market indicators, among others, to anticipate their future development.
- Reporting: Complete and reliable information on the development of risks for the corporate bodies and senior management, with the frequency and completeness appropriate to the nature, significance and complexity of the reported risks. The principle of transparency governs al reporting of risk information.
- Standardization: the criteria are consistent across the Group, thus ensuring that risk handling is standardized at geographical and/or business area level.
- Integration in management: the tools incorporate the corporate risk policies and are applied in the Group's day-to-day management.
- Automation of the main processes making up the risk management cycle.
- Appropriateness: provision of adequate information at the right time.
- Communication: promotes the dissemination of the Model, and in particular the principles that must govern risk management in the Group, in a consistent and integrated manner across the organization, through the most appropriate channels. GRM has a number of communication channels to facilitate the transmission of information and knowledge among the various teams in the function and the Group, adapting the frequency, formats and recipients based on the proposed goal, in order to strengthen the basic principles of the risk function. The risk culture and the management model thus emanate from the Group's corporate bodies and senior management and are transmitted throughout the organization.
- Training: its main aim is to disseminate and establish the model of risk management across the organization, ensuring standards in the skills and knowledge of the different persons involved in the risk management processes.
- Well defined and implemented training ensures continuous improvement of the skills and knowledge of the Group's professionals, and in particular of the GRM area, and is based on four aspects that aim to develop each of the needs of the GRM group by increasing its knowledge and skills in different fields such as: finance and risks, tools and technology, management and skills, and languages.
- Motivation: the aim in this area is for the incentives of the risk function teams to support the strategy for managing those teams and the function's values and culture at all levels. Includes compensation and all those elements related to motivation – working environment, etc. which contribute to the achievement Model objectives.
- Macroeconomic and geopolitical risks
- Global growth has improved during 2017, and is more synchronized across developed and emerging markets, which makes the recovery more sustainable. Healthy global trade growth and calm financial markets, which rely on the support from central banks and the lack of inflation pressure, also contribute to the more upbeat outlook. The performance of the most advanced economies is solid, especially the Eurozone, where global demand adds to domestic factors and reduced political uncertainty. Growth momentum in The United States will be supported in the short term by the recently approved tax reform, although its long-term impact is unlikely to be large. As regards emerging economies, China's growth moderation continues, with a mix of policies oriented to diminish financial imbalances, while economic activity in Latin America recovers against a background of higher commodity prices and favorable global funding conditions.
- The uncertainty around these positive economic perspectives has a downward bias but continues to be elevated. First, following a long period of exceptionally loose monetary policies, the main central banks are tapering their support, with uncertainty on their impact on markets and economies given the background of high leverage and signs of overvaluation in some financial assets. A second source of uncertainty is related with the political support to the multilateral global governance of trade. Third, both global geopolitics and domestic politics in some countries are relevant for the economic perspectives within the BBVA's footprint.
- In this regard, the Group's geographical diversification remains a key element in achieving a high level of revenue recurrence, despite the background conditions and economic cycles of the economies in which it operates.
- Regulatory and reputational risks
- • Financial institutions are exposed to a complex and ever-changing regulatory environment defined by governments and regulators. This can affect their ability to grow and the capacity of certain businesses to develop, and result in stricter liquidity and capital requirements with lower profitability ratios. The Group constantly monitors changes in the regulatory framework (such as IFRS9, Basel IV, etc.) that allow for anticipation and adaptation to them in a timely manner, adopt industry practices and more efficient and rigorous criteria in its implementation.
- • The financial sector is under ever closer scrutiny by regulators, governments and society itself. Negative news or inappropriate behavior can significantly damage the Group's reputation and affect its ability to develop a sustainable business. The attitudes and behaviors of the group and its members are governed by the principles of integrity, honesty, long-term vision and industry practices through, inter alia, internal control Model, the Code of Conduct, tax strategy and Responsible Business Strategy of the Group.
- Business, operational and legal risks
- • New technologies and forms of customer relationships: Developments in the digital world and in information technologies pose significant challenges for financial institutions, entailing threats (new competitors, disintermediation...) but also opportunities (new framework of relations with customers, greater ability to adapt to their needs, new products and distribution channels...). Digital transformation is a priority for the Group as it aims to lead digital banking of the future as one of its objectives.
- • Technological risks and security breaches: The Group is exposed to new threats such as cyber- attacks, theft of internal and customer databases, fraud in payment systems, etc. that require major investments in security from both the technological and human point of view. The Group gives great importance to the active operational and technological risk management and control. One example was the early adoption of advanced models for management of these risks (AMA - Advanced Measurement Approach).
- • The financial sector is exposed to increasing litigation, so the financial institutions face a large number of proceedings which economic consequences are difficult to determine. The Group manages and monitors these proceedings to defend its interests, where necessary allocating the corresponding provisions to cover them, following the expert criteria of internal lawyers and external attorneys responsible for the legal handling of the procedures, in accordance with applicable legislation.
- Availability of basic information for the study and proposal of risk, and supporting documentation for approval, which sets out the conditions required by the internal relevant body.
- Sufficient generation of funds and asset solvency of the customer to assume principal and interest repayments of loans owed.
- Establishment of adequate and sufficient guarantees that allow effective recovery of the operation, this being considered a secondary and exceptional method of recovery when the first has failed.
- At Group level: frameworks for action and standard rules of conduct are defined for handling risk, specifically, the circuits, procedures, structure and supervision.
- At the business area level: they are responsible for adapting the Group's criteria to the local realities of each geographical area and for direct management of risk according to the decision-making circuit:
- In the case of financial assets recognized in the consolidated balance sheets, exposure to credit risk is considered equal to its carrying amount (not including impairment losses), with the sole exception of derivatives and hedging derivatives.
- The maximum credit risk exposure on financial guarantees granted is the maximum that the Group would be liable for if these guarantees were called in, and that is their carrying amount.
- The calculation of risk exposure for derivatives is based on the sum of two factors: the derivatives fair value and their potential risk (or "add-on").
- Analysis of the financial risk of the operation, based on the debtor’s capacity for repayment or generation of funds.
- The constitution of guarantees that are adequate, or at any rate generally accepted, for the risk assumed, in any of the generally accepted forms: monetary, secured, personal or hedge guarantees; and finally.
- Assessment of the repayment risk (asset liquidity) of the guarantees received.
- Financial instruments held for trading: The guarantees or credit enhancements obtained directly from the issuer or counterparty are implicit in the clauses of the instrument.
- Derivatives and hedging derivatives: In derivatives, credit risk is minimized through contractual netting agreements, where positive- and negative-value derivatives with the same counterparty are offset for their net balance. There may likewise be other kinds of guarantees, depending on counterparty solvency and the nature of the transaction.
- Other financial assets designated at fair value through profit or loss and Available-for-sale financial assets: The guarantees or credit enhancements obtained directly from the issuer or counterparty are inherent to the structure of the instrument.
- Loans and receivables:
- • Loans and advances to credit institutions: These usually only have the counterparty’s personal guarantee.
- • Loans and advances to customers: Most of these loans and advances are backed by personal guarantees extended by the own customer. There may also be collateral to secure loans and advances to customers (such as mortgages, cash collaterals, pledged securities and other collateral), or to obtain other credit enhancements (bonds, hedging, etc.).
- • Debt securities: The guarantees or credit enhancements obtained directly from the issuer or counterparty are inherent to the structure of the instrument.
- Financial guarantees, other contingent risks and drawable by third parties: These have the counterparty’s personal guarantee.
- Reactive scoring: measures the risk of a transaction requested by an individual using variables relating to the requested transaction and to the customer’s socio-economic data available at the time of the request. The new transaction is approved or rejected depending on the score.
- Behavioral scoring: scores transactions for a given product in an outstanding risk portfolio of the entity, enabling the credit rating to be tracked and the customer’s needs to be anticipated. It uses transaction and customer variables available internally. Specifically, variables that refer to the behavior of both the product and the customer.
- Proactive scoring: gives a score at customer level using variables related to the individual’s general behavior with the entity, and to his/her payment behavior in all the contracted products. The purpose is to track the customer’s credit quality and it is used to pre-approved new transactions.
- (*) Corresponding to €2,763 million of specific allowances for financial assets, individually estimated and €5,940 million of specific allowances for financial assets collectively estimated.
- (*) Reflects the total amount of impaired loans derecognized from the consolidated balance sheet throughout the period as a result of mortgage foreclosures and real estate assets received in lieu of payment as well as monetary recoveries (see Notes 20 and 21 to the consolidated financial statement for additional information).
- Refinancing and restructuring is authorized according to the capacity of customers to pay the new installments. This is done by first identifying the origin of the payment difficulties and then carrying out an analysis of the customers’ viability, including an updated analysis of their economic and financial situation and capacity to pay and generate funds. If the customer is a company, the analysis also covers the situation of the industry in which it operates.
- With the aim of increasing the solvency of the operation, new guarantees and/or guarantors of demonstrable solvency are obtained where possible. An essential part of this process is an analysis of the effectiveness of both the new and original guarantees.
- This analysis is carried out from the overall customer or group perspective.
- Refinancing and restructuring operations do not in general increase the amount of the customer’s loan, except for the expenses inherent to the operation itself.
- The capacity to refinance and restructure loan is not delegated to the branches, but decided on by the risk units.
- The decisions made are reviewed from time to time with the aim of evaluating full compliance with refinancing and restructuring policies.
- Analysis of the viability of operations based on the customer’s willingness and ability to pay, which may be reduced, but should nevertheless be present. The customer must therefore repay at least the interest on the operation in all cases. No arrangements may be concluded that involve a grace period for both principal and interest.
- Refinancing and restructuring of operations is only allowed on those loans in which the BBVA Group originally entered into.
- Customers subject to refinancing and restructuring operations are excluded from marketing campaigns of any kind.
- Forecasted future income, margins and cash flows to allow entities to implement cost adjustment measures (industrial restructuring) and a business development plan that can help reduce the level of leverage to sustainable levels (capacity to access the financial markets).
- Where appropriate, the existence of a divestment plan for assets and/or operating segments that can generate cash to assist the deleveraging process.
- The capacity of shareholders to contribute capital and/or guarantees that can support the viability of the plan.
- "Impaired assets", as although the customer is up to date with payments, they are classified as impaired for reasons other than their default when there are significant doubts that the terms of their refinancing may not be met; or
- "Normal-risk assets under special monitoring" until the conditions established for their consideration as normal risk are met.
- The customer must have paid past-due amounts (principal and interest) since the date of the renegotiation or restructuring of the loan or other objective criteria, demonstrating the borrower ́s ability to pay, have been verified; and
- At least two years must have elapsed since completion of the renegotiation or restructuring of the loan;
- It is unlikely that the customer will have financial difficulties and, therefore, it is expected that the customer will be able to meet its loan payment obligations (principal and interest) in a timely manner.
- Interest-rate risk: This arises as a result of exposure to movements in the different interest-rate curves involved in trading. Although the typical products that generate sensitivity to the movements in interest rates are money-market products (deposits, interest-rate futures, call money swaps, etc.) and traditional interest-rate derivatives (swaps and interest-rate options such as caps, floors, swaptions, etc.), practically all the financial products are exposed to interest-rate movements due to the effect that such movements have on the valuation of the financial discount.
- Equity risk: This arises as a result of movements in share prices. This risk is generated in spot positions in shares or any derivative products whose underlying asset is a share or an equity index. Dividend risk is a sub-risk of equity risk, arising as an input for any equity option. Its variation may affect the valuation of positions and it is therefore a factor that generates risk on the books.
- Exchange-rate risk: This is caused by movements in the exchange rates of the different currencies in which a position is held. As in the case of equity risk, this risk is generated in spot currency positions, and in any derivative product whose underlying asset is an exchange rate. In addition, the quanto effect (operations where the underlying asset and the instrument itself are denominated in different currencies) means that in certain transactions in which the underlying asset is not a currency, an exchange-rate risk is generated that has to be measured and monitored.
- Credit-spread risk: Credit spread is an indicator of an issuer's credit quality. Spread risk occurs due to variations in the levels of spread of both corporate and government issues, and affects positions in bonds and credit derivatives.
- Volatility risk: This occurs as a result of changes in the levels of implied price volatility of the different market instruments on which derivatives are traded. This risk, unlike the others, is exclusively a component of trading in derivatives and is defined as a first-order convexity risk that is generated in all possible underlying assets in which there are products with options that require a volatility input for their valuation.
- (*) Includes mainly assets and liabilities managed by ALCO.
- VaR without smoothing, which awards equal weight to the daily information for the previous two years. This is currently the official methodology for measuring market risks for the purpose of monitoring compliance with risk limits.
- VaR with smoothing, which gives a greater weight to more recent market information. This metric supplements the previous one.
- VaR: In regulatory terms, the VaR charge incorporates the stressed VaR charge, and the sum of the two (VaR and stressed VaR) is calculated. This quantifies the losses associated with the movements of the two risk factors inherent to market operations (interest rates, FX, RV, credit, etc.). Both VaR and stressed VaR are rescaled by a regulatory multiplier set at three and by the square root of ten to calculate the capital charge.
- Specific Risk: Incremental Risk Capital (“IRC”) Quantification of the risks of default and downgrading of the credit ratings of the bond and credit derivative positions in the portfolio. The specific capital risk by IRC is a charge exclusively used in the geographical areas with the internal model approved (BBVA S.A. and Bancomer). The capital charge is determined according to the associated losses (at 99.9% in a 1-year horizon under the hypothesis of constant risk) due to the rating migration and/or default state the issuer of an asset. In addition, the price risk is included in sovereign positions for the items specified.
- Specific Risk: Securitization and correlation portfolios. Capital charge for securitizations and the correlation portfolio to include the potential losses associated at the level of rating a specific credit structure (rating). Both are calculated by the standard method. The scope of the correlation portfolios refers to the FTD-type market operation and/or tranches of market CDOs and only for positions with an active market and hedging capacity.
- (*) The diversification effect is the difference between the sum of the average individual risk factors and the total VaR figure that includes the implied correlation between all the variables and scenarios used in the measurement.
- "Hypothetical" backtesting: the daily VaR is compared with the results obtained, not taking into account the intraday results or the changes in the portfolio positions. This validates the appropriateness of the market risk metrics for the end-of-day position.
- "Real" backtesting: the daily VaR is compared with the total results, including intraday transactions, but discounting the possible minimum charges or fees involved. This type of backtesting includes the intraday risk in portfolios.
- Credit shock: reflected mainly in the increase of credit spreads and downgrades in credit ratings.
- Increased volatility in most of the financial markets (giving rise to a great deal of variation in the prices of different assets (currency, equity, debt).
- Liquidity shock in the financial systems, reflected by a major movement in interbank curves, particularly in the shortest sections of the euro and dollar curves.
- (*) Percentage of "1 year" net interest income forecast for each unit.
- (**) Percentage of Core Capital for each unit.
- (***) In Europe downward movement allowed until more negative level than current rates.
- (*) Perimeter: Spain, Portugal and Rest of Eurasia
- (**) Compass LCR calculated according to local regulation (Fed Modified LCR)
- (1)It includes Spain, Portugal and Rest of Eurasia.
- (1) It includes Banco Bilbao Vizcaya Argentaria, S.A. and Banco Bilbao Vizcaya Argentaria (Portugal), S.A.
- Figures originally reported in the year 2016 in accordance to the applicable regulation, without restatements.
- Figures originally reported in the year 2016 in accordance to the applicable regulation, without restatements.
-
Active management of operational risk and its integration into day-to-day decision-making means:
- • Knowledge of the real losses associated with this type of risk.
- • Identification, prioritization and management of real and potential risks.
- • The existence of indicators that enable the Bank to analyze operational risk over time, define warning signals and verify the effectiveness of the controls associated with each risk.
- The above helps create a proactive model for making decisions about control and business, and for prioritizing the efforts to mitigate relevant risks in order to reduce the Group's exposure to extreme events.
- Improved control environment and strengthened corporate culture.
- Generation of a positive reputational impact.
- Model based on three lines of defense, aligned with international industry practices.
- Be aligned with the risk appetite framework statement set out by the Board of BBVA.
- Anticipate the potential operational risks to which the Group would be exposed as a result of new or modified products, activities, processes, systems or outsourcing decisions, and establish procedures to enable their evaluation and reasonable mitigation prior to their implementation.
- Establish methodologies and procedures to enable a regular reassessment of the relevant operational risks to which the Group is exposed in order to adopt appropriate mitigation measures in each case, once the identified risk and the cost of mitigation (cost/benefit analysis) have been considered, while preserving the Group's solvency at all times.
- Identify the causes of the operational losses sustained by the Group and establish measures to reduce them. Procedures must therefore be in place to enable the capture and analysis of the operational events that cause those losses.
- Analyze the events that have caused operational risk losses in other institutions in the financial sector and promote, where appropriate, the implementation of the measures needed to prevent them from occurring in the Group.
- Identify, analyze and quantify events with a low probability of occurrence and high impact in order to evaluate their mitigation. Due to their exceptional nature, it is possible that such events may not be included in the loss database or, if they are, they have impacts that are not representative.
- Have an effective system of governance in place, where the functions and responsibilities of the areas and bodies involved in operational risk management are clearly defined.
- The aim is, as much as possible, to reconcile the customer's credit needs (commercial/financial, short-term/long-term, etc.) with the interests of the Group.
- Any legal limits that may exist concerning risk concentration are taken into account (relationship between risks with a customer and the capital of the shareholder ́s entity that assumes them), the markets, the macroeconomic situation, etc.
- In the case of completed homes, the final aim is the sale of these homes to private individuals, thus reducing the risk and beginning a new business cycle. Here, the strategy has been to help subrogation (the default rate in this channel of business is notably lower than in any other channel of residential mortgages) and to support customers’ sales directly, using BBVA’s own channel (BBVA Services and its branches), creating incentives for sale and including sale orders for BBVA. In exceptional case we have even accepted partial haircuts, with the aim of making the sale easier.
- In the case of ongoing home construction, the strategy has been to help and promote the completion of the construction in order to transfer the investment to completed homes. The whole developer Works in Progress portfolio has been reviewed and classified into different stages with the aim of using different tools to support the strategy. This includes the use of developer accounts-payable financing as a form of payment control, the use of project monitoring supported by the Real Estate Unit itself, and the management of direct suppliers for the works as a complement to the developer’s own management.
- With respect to land, the fact that the risk of rustic land is not significant simplifies the management. Urban management and liquidity control to tackle urban planning costs are also subject to special monitoring.
- Level 1: Measurement using market observable quoted prices for the financial instrument in question, secured from independent sources and trading in active markets - according to the Group policies. This level includes, listed equity instruments, some debt securities, some derivatives and mutual funds.
- Level 2: Measurement that applies techniques using inputs drawn from observable market data.
- Level 3: Measurement using techniques where some of the material inputs are not derived from market observable data. As of December 31, 2017, the affected instruments accounted for approximately 0.13% of financial assets and 0.02% of the Group’s financial liabilities registered at fair value. Model selection and validation is undertaken by control areas outside the market area.
- The net present value (net present value method): This technique uses the future cash flows of each debt security, which are established in the different contracts, and discounted to their present value. This technique often includes many observable inputs, but may also include unobservable inputs, as described below:
- • Credit Spread: This input represents the difference in yield of a debt security and the reference rate, reflecting the additional return that a market participant would require to take the credit risk of that debt security. Therefore, the credit spread of the debt security is part of the discount rate used to calculate the present value of the future cash flows.
- • Recovery rate: This input represents the percentage of principal and interest recovered from a debt instrument that has defaulted.
- Comparable prices (similar asset prices): This input represents the prices of comparable financial instruments and benchmarks used to calculate a reference yield based on relative movements from the entry price or current market levels. Further adjustments to account for differences that may exist between financial instrument being valued and the comparable financial instrument may be added. It can also be assumed that the price of the financial instrument is equivalent to the comparable instrument.
- Net asset value: This input represents the total value of the financial assets and liabilities of a fund and is published by the fund manager thereof.
- Gaussian copula: This model is used to integrate default probabilities of credit instruments referenced to more than one underlying CDS. The joint density function used to value the instrument is constructed by using a Gaussian copula that relates the marginal densities by a normal distribution, usually extracted from the correlation matrix of events approaching default by CDS issuers.
- Black 76: variant of Black Scholes model, whose main application is the valuation of bond options, cap floors and swaptions where the behavior of the Forward and not the Spot itself, is directly modeled.
- Black Scholes: The Black Scholes model postulates log-normal distribution for the prices of securities, so that the expected return under the risk neutral measure is the risk free interest rate. Under this assumption, the price of vanilla options can be obtained analytically, so that inverting the Black- Scholes formula, the implied volatility for process of the price can be calculated.
- Heston: This model, typically applied to equity OTC options, assumes stochastic behavior of volatility. According to which, the volatility follows a process that reverts to a long-term level and is correlated with the underlying equity instrument. As opposed to local volatility models, in which the volatility evolves deterministically, the Heston model is more flexible, allowing it to be similar to that observed in the short term today.
- Libor market model: This model assumes that the dynamics of the interest rate curve can be modeled based on the set of forward contracts that compose the underlying interest rate. The correlation matrix is parameterized on the assumption that the correlation between any two forward contracts decreases at a constant rate, beta, to the extent of the difference in their respective due dates. The input “Credit default volatility” is a volatility input of the credit factor dynamic. The multifactorial frame of this model makes it ideal for the valuation of instruments sensitive to the slope or curve, including interest rate option.
- Local Volatility: In the local volatility models of the volatility, instead of being static, evolves over time according to the level of moneyness of the underlying, capturing the existence of smiles. These models are appropriate for pricing path dependent options when use Monte Carlo simulation technique is used.
- (*) Profit or loss that is attributable to gains or losses relating to those financial assets and liabilities held as of December 31, 2017, 2016 and 2015. Valuation adjustments are recorded under the heading “Gains (losses) on financial assets and liabilities, net”.
- (**) Of which, in 2017, the assets roll forward is comprised of €432 million of acquisitions, €348 millions of disposals and €51 millions of liquidations. The liabilities roll forward is comprised of €403 million of acquisitions and €83 millions of liquidations.
- Transfers between Levels 1 and 2 represents mainly debt securities, which are either no longer listed on an active market (transfer from Level 1 to 2) or have just started to be listed (transfer from Level 2 to 1).
- Transfers from Level 1 to Level 3 generally affect equity instruments, using variables not obtained from observable date in the market.
- The fair value of "Cash and cash balances at central banks and other demand deposits" approximates their book value, as it is mainly short-term balances.
- The fair value of the "Loans and receivables", “Held-to-maturity unlisted investments” and "financial liabilities at amortized cost" was estimated using the method of discounted expected future cash flows using market interest rates at the end of each year. Additionally, factors such as credit spreads and prepayment rates are taken into account.
- Analysis of the property sales performed during the year and comparison of the cost to sell these properties to the appraisal values obtained most recently. From this analysis derived a conclusion by type of property and location.
- Individual valuation of a material sample of the entire portfolio considering type of properties. The results obtained from these valuations have been compared with the adjusted values of the above analysis, obtaining a second conclusion by type and location.
- Comparative Market Method: the property under study is compared with others with similar characteristics which have been recently sold or are for sale on the market, making a comparative analysis, making adjustments due to factors that can cause differences, such as location, size, dimensions, shape, topography, access, urban classification, type of construction, age, storage, distribution, function, or design.
- Dynamic Residual Method (DRM): this is considered the most accurate method to conduct an appraisal of poorly developed or undeveloped land, where there is minimal planning (use and a gross floor area) or a more defined development planning, since in these cases the market is often not very transparent. It starts from the consideration that the development and sale of finished real estate product is conceived from the beginning as a business project, as such it involves a risk, taking place in a time frame in which an initial capital investment occurs generating income and expenses. As such business project, the goal is to maximize profits and therefore the principle of highest and best use.
- Yield Method (DCF): the value of assets is determined by the profits that they could generate in the future (projections) discounted at an appropriate rate of discount. This is an overall assessment, reflecting the economic potential and profitability.
- Size, location, and type of property.
- Current condition of the property market, sales price trends and rental competition in the real estate market or industry risk, adjusted based on the statistical information of local real estate and macroeconomic variables.
- The fullest and best use of the asset, which must be legally allowed, physically possible, economically viable, and provide the maximum possible value, supported in economic terms. Analysis of the fullest and best use contemplates its current condition, whether free and available, based on the mentioned appraisals.
- Market Value of the property, considering this as vacant and available for use, analyzing factors such as location, size, physical characteristics, similar transactions and value adjustments proposed by the current economic conditions.
- (*) The amortized cost includes portfolio gains/losses linked to insurance contracts in which the policyholder assumes the risk in case of redemption.
- (*) The amortized cost includes portfolio gains/losses linked to insurance contracts in which the policyholder assumes the risk in case of redemption.
- (*) The amortized cost includes portfolio gains/losses linked to insurance contracts in which the policyholder assumes the risk in case of redemption.
- (*) As of December 31, 2015 the Group BBVA has not registered any balances in this heading.
- (*) The decrease in book value is mainly due to amortizations since the date of reclassification.
- Fair value hedging:
- • Available-for-sale fixed-interest debt securities and loans and receivables: The interest rate risk of these securities is hedged using interest rate derivatives (fixed-variable swaps) and forward sales.
- • Long-term fixed-interest debt securities issued by the Bank: the interest rate risk of these securities is hedged using interest rate derivatives (fixed-variable swaps).
- • Fixed-interest loans: The equity price risk of these instruments is hedged using interest rate derivatives (fixed-variable swaps).
- • Fixed-interest and/or embedded derivative deposit portfolio hedges: it covers the interest rate risk through fixed-variable swaps. The valuation of the borrowed deposits corresponding to the interest rate risk is in the heading "Fair value changes of the hedged items in portfolio hedges of interest rate risk”
- Cash-flow hedges: Most of the hedged items are floating interest-rate loans and asset hedges linked to the inflation of the available for sale portfolio. This risk is hedged using foreign-exchange, interest- rate swaps, inflation and FRA’s (“Forward Rate Agreement”).
- Net foreign-currency investment hedges: These hedged risks are foreign-currency investments in the Group’s foreign subsidiaries. This risk is hedged mainly with foreign-exchange options and forward currency sales and purchases.
- The forecast cash flows estimated by the Group's management, and based on the latest available budgets for the next 5 years.
- The constant sustainable growth rate for extrapolating cash flows, starting in the fifth year (2022), beyond the period covered by the budgets or forecastss.
- The discount rate on future cash flows, which coincides with the cost of capital assigned to each CGU, and which consists of a risk-free rate plus a premium that reflects the inherent risk of each of the businesses evaluated.
- (*) Based on historical changes, the use of 50 basis points to calculate the sensitivity analysis would be a reasonable variation with respect to the observed variations over the last five years.
- (*) After the purchase, it has been reclassified under the heading “Available-for-sale financial assets”
- (**) It corresponds to non-controlling interests that Catalunya Banc held, prior to integration in the BBVA Group
- (*) Calculated by applying the difference between the tax rate in force in Spain and the one applied to the Group’s earnings in each jurisdiction.
- (*) Laws guaranteeing the deferred tax assets have been approved in Spain and Portugal in 2013 and 2014.
- The evolution of the deferred tax assets and liabilities (without taking into consideration the guaranteed deferred tax asset and the tax losses) in net terms is a decrease of €561 million mainly due to the register in non-current assets and disposal groups held for sale of the mayority of the tax assets and liabilities of Chile, to the regularization of the tax assets and liabilities of the United States due to the tax reform and to the operation of the corporate income tax in which differences between accounting and taxation produce movements in the deferred taxes.
- The increase in tax losses is mainly due to the generation of negative tax bases and deductions during year 2017.
- Spain: Net deferred tax assets recognized in Spain totaled €2,052 million as of December 31, 2017 (€2,007 and €1,437 million as of December 31, 2016 and 2015, respectively). €1,184 million of the figure recorded in the year ended December 31, 2017 for net deferred tax assets related to tax credits and tax loss carry forwards and €868 million relate to temporary differences.
- Mexico: Net deferred tax assets recognized in Mexico amounted to €615 million as of December 31, 2017 (€698 and €608 million as of December 31, 2016 and 2015, respectively). 98.24% of deferred tax assets as of December 31, 2017 relate to temporary differences. The remainders are tax credits carry forwards.
- South America: Net deferred tax assets recognized in South America amounted to €26 million as of December 31, 2017 (€362 and €330 million as of December 31, 2016 and 2015, respectively). All the deferred tax assets relate to temporary differences.
- The United States: Net deferred tax assets recognized in The United States amounted to €180 million as of December 31, 2017 (€345 and €300 million as of December 31, 2016 and 2015, respectively). All the deferred tax assets relate to temporary differences.
- Turkey: Net deferred tax assets recognized in Turkey amounted to €224 million as of December 31, 2017 (€135 and €217 million as of December 31, 2016 and 2015 respectively). As of December 31, 2017, all the deferred tax assets correspond to €13 million of tax credits related to tax losses carry forwards and deductions and €211 million relate to temporary differences.
- (*) As of December 31, 2017, included mainly the agreement with Cerberus to transfer the "Real Estate" business in Spain (see Note 3)
- (**) As of December 31, 2016, included mainly Real Estate Investments from BBVA Propiedad, S.A. which were transferred to Testa Residencial, S.A. in the first quarter of 2017 (see Note 16).
- (***) As of December 31, 2017, included mainly the BBVA’s stake in BBVA Chile (see Note 3).
- (****) Amortization accumulated until related asset reclassified as “non-current assets and disposal groups held for sale”.
- (*) Net of amortization accumulated until assets were reclassified as non-current assets held for sale
- (**) As of December 31, 2017, included mainly the BBVA’s stake in BBVA Chile and the agreement with Cerberus to transfer the "Real Estate" business in Spain (see Note 3)
- (*) Net of amortization accumulated until assets were reclassified as non-current assets held for sale
- (*) Net of amortization accumulated until assets were reclassified as non-current assets held for sale
- (**) Business sale agreement (Note 3)
- (*) Including mortgage-covered bonds (see Appendix X).
- (1) Listed on the London and New York stock exchanges.
- (2) Unnim Group: Issuances prior to the acquisition by BBVA.
- Technical risk: arises from deviations in the estimation of the casualty rate of insurances, either in terms of numbers, the amount of such claims and the timing of its occurrence.
- Biometric risk: depending on the deviations in the expected mortality behavior or the survival of the insured persons.
- (1) Provides coverage in the event of death or disability.
- (2) The insurance policies purchased by employers (other than BBVA Group) on behalf of its employees.
- (1) Provides coverage in the case of one or more of the following events: death and disability.
- (2) Insurance policies purchased by companies (other than Group BBVA entities) on behalf of their employees.
- (1) During the year 2015 and 2016, provisions corresponding to different concepts and different geographies that are not individually significant individually, except originated of the Purchase Price Agreement of Catalunya Banc and Garanti Group (see Note 18.1).
- (1) Correspond to actuarial losses (gains) arising from certain defined-benefit post-employment pension commitments and other similar benefits recognized in “Equity” (see Note 2.2.12).
- (2) In the year 2015 this line item correspond mainly to the incorporation of Garanti y Catalunya Banc (see Note 3).
- (*) In the year 2015 this line item mainly includes the incorporation of Garanti y Catalunya Banc in year 2015 (see Note 3).
- (1) In Turkey, the foundation responsible for managing the benefit commitments holds an additional asset of 142€ million which, in accordance with IFRS regarding the asset ceiling, has not been recognized in the Consolidated Financial Statements, because although it could be used to reduce future pension contributions it could not be immediately refunded to the employer.
- (2) Recorded under the heading “Other Assets - Other” of the consolidated balance sheet (see Note 20).
- (3) Recorded under the heading “Provisions - Provisions for pensions and similar obligations” of the consolidated balance sheet (see Note 24).
- (4) Recorded under the heading “Provisions – Other long-term employee benefits” of the consolidated balance sheet.
- (*) Actuarial losses (gains) on remeasurement of the net defined benefit liability relating to early retirements in Spain and other long-term employee benefits that are charged to the income statements (see Note 2.2.12).
- (1) Including gains and losses arising from settlements.
- (2) Excluding interest, which is recorded under "Interest income or expense".
- (1) Including gains and losses arising from settlements.
- (2) Excluding interest, which is recorded under "Interest income or expense".
- (1) Includes gains and losses from settlements.
- (2) Excludes interest which is reflected in the line item “Interest income and expenses”.
- (1) Including gains and losses arising from settlements.
- (2) Excluding interest, which is recorded under "Interest income or expense".
- (*) Total reserves of BBVA, S.A. (see Appendix IX).
- (*) Provisional data.
- (**) Includes updates on the calculation of Structural FX RWA, pending confirmation by ECB and the subordinated debt (Tier2) issued by Garanti pending approval by ECB.
- (***) Figures originally reported in the Prudential Relevance Report corresponding to the year 2016, without restatements.
- (*)Provisional data
- (1) Correspond to balances of entities fully consolidated in the public balance sheet but consolidated by the equity method in the regulatory balance sheet
- (2) Correspond to intragroup adjustments and other consolidation adjustments.
- Maintain a level of capitalization according to the business objectives in all countries in which it operates and, simultaneously,
- Maximize the return on shareholders’ funds through the efficient allocation of capital to the different units, a good management of the balance sheet and appropriate use of the various instruments forming the basis of the Group’s equity: shares, preferred securities and subordinate debt.
- (*) Non performing financial guarantees given amounted to €739, €680 and €664 million as of December 31, 2017, 2016 and 2015, respectively.
- (*)Excludes balances from securitization funds.
- (1) The volume effect is calculated as the result of the interest rate of the initial period multiplied by the difference between the average balances of both periods.
- (2) The price effect is calculated as the result of the average balance of the last period multiplied by the difference between the interest rates of both periods.
- The Annual Variable Remuneration of Identified Staff members would be paid in equal parts in cash and in BBVA shares.
- The payment of 40% of the Annual Variable Remuneration, both in cash and in shares, would be deferred in its entirety for a three–year period. Its accrual and payment would be subject to compliance with certain multi-year performance indicators related to the share performance and the Group’s fundamental control and risk management metrics regarding solvency, liquidity and profitability, which would be calculated over the deferral period (hereinafter “Multi-year Performance Indicators”). These Multi-year Performance Indicators could lead to a reduction in the amounts deferred, and might even bring it down to zero, but they would not be used under any circumstances to increase the aforementioned deferred remuneration.
- All the shares delivered pursuant to the rules indicated above would be withheld for a period of one year from the date of delivery. This withholding would be applied over the net amount of the shares, after discounting the necessary part to pay any tax accruing on the shares received.
- A prohibition was also established against hedging, both regarding vested shares that were withheld and shares whose delivery was pending.
- Moreover, circumstances were established under which the payment of the deferred Annual Variable Remuneration could be limited or impeded ("malus" clauses), as well as the adjustment to update these deferred parts.
- Finally, the variable component of the remuneration corresponding to a year for the Identified Staff would be limited to a maximum amount of 100% of the fixed component of total remuneration, unless the General Meeting resolved to increase such limit which, in any event, could not exceed 200% of the fixed component of total remuneration.
- A significant percentage of variable remuneration – 60% in the case of executive directors, Senior Management and those Identified Staff members with particularly high variable remuneration, and 40% for the rest of the Identified Staff– shall be deferred over a five- year period, in the case of executive directors and Senior Management, and over a three-year period, for the remaining Identified Staff.
- 50% of the variable remuneration of each year (including both upfront and deferred portions), shall be established in BBVA shares, albeit a larger proportion (60%) in shares shall be deferred in the case of executive directors and Senior Management.
- The variable remuneration will be subject to ex ante adjustments, so that it will not be accrued, or will be accrued in a reduced amount, should a certain level of profit or capital ratio not be obtained. Likewise, the Annual Variable Remuneration will be reduced upon performance assessment in the event of negative evolution of the Bank’s results or other parameters such as the level of achievement of budgeted targets.
- The deferred component of the variable remuneration (in shares and in cash) may be reduced in its entirety, yet not increased, based on the result of multi-year performance indicators aligned with the Bank’s fundamental risk management and control metrics, related to the solvency, capital, liquidity, funding or profitability, or to the share performance and recurring results of the Group.
- During the entire deferral period (5 or 3 years, as applicable) and retention period, variable remuneration shall be subject to malus and clawback arrangements, both linked to a downturn in financial performance of the Bank, specific unit or area, or individual, under certain circumstances.
- All shares shall be withheld for a period of one year after delivery, except for those shares required to honor the payment of taxes.
- No personal hedging strategies or insurance may be used in connection with remuneration and responsibility that may undermine the effects of alignment with sound risk management.
- The deferred amounts in cash subject to multi-year performance indicators that are finally paid shall be subject to updating, in the terms determined by the Bank’s Board of Directors, upon proposal of the Remunerations Committee, whereas deferred amounts in shares shall not be updated.
- Finally, the variable component of the remuneration of the Identified Staff members shall be limited to a maximum amount of 100% of the fixed component of total remuneration, unless the General Meeting resolves to increase this percentage up to 200%.
- (*) The consolidated companies do not expect to terminate the lease contracts early.
- (*) Includes various sales in CNCB (see Note 3)
- (*) Including fees pertaining to annual legal audits (€22.6 million).
- (**) Regardless of the billed period.
- (*) Services provided by KPMG Auditores, S.L. to companies located in Spain.
- (1) Includes the amounts for memberships of the different committees during the year 2017. The composition of these committees was modified on May 31, 2017.
- In addition, José Luis Palao García-Suelto and James Andrew Stott, who ceased as directors on March 17, 2017 and on May 31, 2017, respectively, received a total amount of €70 thousand and €178 thousand, respectively, as members of the Board of Directors and of the different Board committees.
- The upfront payment of the annual variable remuneration for executive directors corresponding to the year 2016 has been paid in equal parts in cash and in BBVA shares.
- The remaining 50% of the annual variable remuneration, both in cash and in shares, has been deferred in its entirety for a three-year period, with its accrual and payment subject to compliance with a series of multi-year indicators.
- All the shares delivered pursuant to the indicated rules will be withheld for a one-year period from the date of delivery. This withholding will be applied to the net amount of the shares, after discounting the amount necessary to honor the payment of taxes accruing on the shares received.
- A prohibition against hedging has been established, both regarding withheld vested shares and shares pending delivery.
- The deferred part of the annual variable remuneration will be subject to updating under the terms established by the Board of Directors.
- The variable component of the remuneration of executive directors corresponding to the year 2016 is limited to a maximum amount of 200% of the fixed component of total remuneration, as agreed by the General Meeting.
- (1) Amounts corresponding to 50% of 2016 annual variable remuneration.
- (2) Amounts corresponding to the sum of the deferred parts of the annual variable remuneration from previous years (2014 and 2013), and their corresponding updating in cash, payment or delivery of which has been made in 2017, in accordance with the settlement and payment system, as broken down below:
- - 2nd third of deferred annual variable remuneration from 2014:
- Under this item, the executive directors have received: €321 thousand and 37,392 BBVA shares in the case of the Group Executive Chairman; €101 thousand and 11,766 BBVA shares in the case of the Chief Executive Officer; and €32 thousand and 3,681 BBVA shares in the case of the executive director Head of GERPA.
- - 3rd third of deferred annual variable remuneration from 2013:
- Under this item, the executive directors have received: €301 thousand and 29,555 BBVA shares in the case of the Group Executive Chairman; €81 thousand and 7,937 BBVA shares in the case of the Chief Executive Officer; and €18 thousand and 1,768 BBVA shares in the case of the executive director Head of GERPA.
- 40% of the annual variable remuneration corresponding to 2017 will be paid, during the first quarter of 2018, in equal parts in cash and in shares, which amounts to €660 thousand and 90,933 BBVA shares in the case of the Group Executive Chairman; €562 thousand and 77,493 BBVA shares in the case of the Chief Executive Officer; and €87 thousand and 12,029 BBVA shares in the case of the executive director Head of GERPA.
- The remaining 60% will be deferred for a five-year period, subject to compliance with the multi-year performance indicators (the “Deferred Component”), which will vest, 40% in cash and 60% in shares, under the following schedule: 60% of the Deferred Component after the third year of deferral; 20% after the fourth year of deferral; and 20% after the fifth year of deferral.
- The Deferred Component of the annual variable remuneration will be subject to compliance with the multi-year performance indicators determined by the Board of Directors at the beginning of the year, calculated over the first three years of deferral. The application of these indicators may lead to a reduction of the Deferred Component, even in its entirety, but in no event lead to an increase in its amount.
- Shares delivered to executive directors as annual variable remuneration shall be withheld for a one-year period from the date of delivery. Upon reception of the shares, executive directors will not be allowed to transfer a number of shares equivalent to twice their annual fixed remuneration for at least three years after their delivery. The foregoing shall not apply to the transfer of those shares required to honor the payment of taxes.
- The annual variable remuneration deferred in cash will be subject to updating in the terms established by the Board of Directors.
- Executive directors shall not be allowed to use personal hedging strategies or insurance in connection with remuneration and responsibility that may undermine the effects of alignment with sound risk management.
- The variable component of the remuneration of executive directors for the year 2017 will be limited to a maximum amount of 200% of the fixed component of total remuneration, as approved by the General Meeting.
- Finally, the entire annual variable remuneration of executive directors will be subject to malus and clawback arrangements during the entire deferral and retention period.
- The upfront payment of 2016 annual variable remuneration for members of the Senior Management has been paid in equal parts in cash and in BBVA shares.
- The remaining 50% of the annual variable remuneration, both in cash and in shares, has been deferred in its entirety for a three-year period, and its accrual and vesting shall be subject to compliance with a series of multi-year indicators.
- All the shares delivered pursuant to the indicated rules shall be withheld for a one-year period from the date of delivery. This withholding will be applied to the net amount of the shares, after discounting the amount necessary to honor the payment of taxes accruing on the shares received.
- A prohibition against hedging has been established, both regarding withheld vested shares and shares pending delivery.
- The deferred part of the annual variable remuneration will be subject to updating under the terms established by the Board of Directors.
- The variable component of the remuneration corresponding to the year 2016 for the Senior Management is limited to a maximum amount of 200% of the fixed component of total remuneration as agreed by the General Meeting.
- (*) This section includes aggregate information regarding those who were members of the Senior Management, excluding executive directors, as at December, 31, 2017 (15 members).
- (1) Amounts corresponding to 50% of 2016 annual variable remuneration.
- (2) Amounts corresponding to the sum of the deferred parts of the annual variable remuneration from previous years (2014 and 2013), and their corresponding updating in cash, payment or delivery of which has been made in 2017 to members of the Senior Management who were entitled to them, as broken down below:
- - 2nd third of deferred annual variable remuneration from 2014: corresponds to an aggregate amount of €555 thousand and 64,873 BBVA shares.
- - 3rd third of deferred annual variable remuneration from 2013: corresponds to an aggregate amount of €461 thousand and 45,232 BBVA shares.
- (1) In addition, in the first semester of 2017, 8,752 theoretical shares were allocated to José Luis Palao García-Suelto and 10,226 theoretical shares were allocated to James Andrew Stott, who ceased as directors on March 17, 2017 and on May 31, 2017 respectively.
- (*) Profit attributable to non-controlling interests.
2.2.2 Transfers and derecognition of financial assets and liabilities
The accounting treatment of transfers of financial assets is determined by the form in which risks and benefits associated with the financial assets involved are transferred to third parties. Thus the financial assets are only derecognized from the consolidated balance sheet when the cash flows that they generate are extinguished, when their implicit risks and benefits have been substantially transferred to third parties or when the control of financial asset is transferred even in case of no physical transfer or substantial retention of such assets. In the latter case, the financial asset transferred is derecognized from the consolidated balance sheet, and any right or obligation retained or created as a result of the transfer is simultaneously recognized.
Similarly, financial liabilities are derecognized from the consolidated balance sheet only if their obligations are extinguished or acquired (with a view to subsequent cancellation or renewed placement).
The Group is considered to have transferred substantially all the risks and benefits if such risks and benefits account for the majority of the risks and benefits involved in ownership of the transferred financial assets. If substantially all the risks and benefits associated with the transferred financial asset are retained:
2.2.3 Financial guarantees
Financial guarantees are considered to be those contracts that require their issuer to make specific payments to reimburse the holder of the financial guarantee for a loss incurred when a specific borrower breaches its payment obligations on the terms – whether original or subsequently modified – of a debt instrument, irrespective of the legal form it may take. Financial guarantees may take the form of a deposit, bank guarantee, insurance contract or credit derivative, among others.
In their initial recognition, financial guarantees are recognized as liabilities in the consolidated balance sheet at fair value, which is generally the present value of the fees, commissions and interest receivable from these contracts over the term thereof, and the Group simultaneously recognize a corresponding asset in the consolidated balance sheet for the amount of the fees and commissions received at the inception of the transactions and the amounts receivable at the present value of the fees, commissions and interest outstanding.
Financial guarantees, irrespective of the guarantor, instrumentation or other circumstances, are reviewed periodically so as to determine the credit risk to which they are exposed and, if appropriate, to consider whether a provision is required for them. The credit risk is determined by application of criteria similar to those established for quantifying impairment losses on debt instruments measured at amortized cost (see Note 2.2.1).
The provisions recognized for financial guarantees considered impaired are recognized under the heading “Provisions - Provisions for contingent risks and commitments” on the liability side in the consolidated balance sheets (see Note 24). These provisions are recognized and reversed with a charge or credit, respectively; to “Provisions or reversal of provision” in the consolidated income statements (see Note 46)
Income from financial guarantees is recorded under the heading “Fee and commission income” in the consolidated income statement and is calculated by applying the rate established in the related contract to the nominal amount of the guarantee (see Note 40).
2.2.4 Non-current assets and disposal groups held for sale and liabilities included in disposal groups classified as held for sale
The headings “Non-current assets and disposal groups held for sale” and “liabilities included in disposal groups classified as held for sale” in the consolidated balance sheets includes the carrying amount of assets that are not part of the BBVA Group’s operating activities. The recovery of this carrying amount is expected to take place through the price obtained on its disposal (see Note 21).
These headings include individual items and groups of items (“disposal groups”) and disposal groups that form part of a major operating segment and are being held for sale as part of a disposal plan (“discontinued operations”). The individual items include the assets received by the subsidiaries from their debtors, in full or partial settlement of the debtors’ payment obligations (assets foreclosed or received in payment of debt and recovery of lease finance transactions), unless the Group has decided to make continued use of these assets. The BBVA Group has units that specialize in real estate management and the sale of this type of asset.
Symmetrically, the heading “Liabilities included in disposal groups classified as held for sale” in the consolidated balance sheets reflects the balances payable arising from disposal groups and discontinued operations.
Non-current assets and disposal groups classified as held for sale are generally measured, at the acquisition date and at any later date deemed necessary, at either their carrying amount or the fair value of the property (less costs to sell), whichever is lower.
In the case of real estate assets foreclosed or received in payment of debts, they are initially recognized at the lower of: the restated carrying amount of the financial asset and the fair value at the time of the foreclosure or receipt of the asset less estimated sales costs. The carrying amount of the financial asset is updated at the time of the foreclosure, treating the real property received as a secured collateral and taking into account the credit risk coverage that would correspond to it according to its classification prior to the delivery. For these purposes, the collateral will be valued at its current fair value (less sale costs) at the time of foreclosure. This carrying amount will be compared with the previous carrying amount and the difference will be recognized as a provision increase, if applicable. On the other hand, the fair value of the foreclosed asset is obtained by appraisal, evaluating the need to apply a discount on the asset derived from the specific conditions of the asset or the market situation for these assets, and in any case, deducting the company’s estimated sale costs.
At the time of the initial recognition, these real estate assets foreclosed or received in payment of debts, classified as “Non-current assets and disposal groups held for sale” and “liabilities included in disposal groups classified as held for sale” are valued at the lower of: their restated fair value less estimated sale costs and their carrying amount; a deterioration or impairment reversal can be recognized for the difference if applicable.
Non-current assets and disposal groups held for sale groups classified as held for sale are not depreciated while included under the heading “Non-current assets and disposal groups held for sale”
Fair value of non-current assets held for sale from foreclosures or recoveries is based, mainly, in appraisals or valuations made by independent experts on an annual basis or more frequently, should there be indicators of impairment.
Gains and losses generated on the disposal of assets and liabilities classified as non-current held for sale, and liabilities included in disposal groups classified as held for sale as well as impairment losses and, where pertinent, the related recoveries, are recognized in “Profit or loss from non-current assets and disposal groups classified as held for sale not qualifying as discontinued operations” in the consolidated income statement (see Note 50). The remaining income and expense items associated with these assets and liabilities are classified within the relevant consolidated income statement headings.
Income and expenses for discontinued operations, whatever their nature, generated during the year, even if they have occurred before their classification as discontinued operations, are presented net of the tax effect as a single amount under the heading “Profit from discontinued operations” in the consolidated income statement, whether the business remains on the consolidated balance sheet or is derecognized from the consolidated balance sheet. As long as an asset remains in this category, it will not be amortized. This heading includes the earnings from their sale or other disposal.
2.2.5 Tangible assets
Property, plant and equipment for own use
This heading includes the assets under ownership or acquired under lease finance, intended for future or current use by the BBVA Group and that it expects to hold for more than one year. It also includes tangible assets received by the consolidated entities in full or partial settlement of financial assets representing receivables from third parties and those assets expected to be held for continuing use.
Property, plant and equipment for own use are presented in the consolidated balance sheets at acquisition cost, less any accumulated depreciation and, where appropriate, any estimated impairment losses resulting from comparing this net carrying amount of each item with its corresponding recoverable amount.
Depreciation is calculated using the straight-line method, on the basis of the acquisition cost of the assets less their residual value; the land is considered to have an indefinite life and is therefore not depreciated.
The tangible asset depreciation charges are recognized in the accompanying consolidated income statements under the heading "Depreciation and Amortization" (see Note 45) and are based on the application of the following depreciation rates (determined on the basis of the average years of estimated useful life of the various assets):
Depreciation Rates for Tangible Assets
| Type of Assets | Annual Percentage |
|---|---|
| Buildings for own use | 1% - 4% |
| Furniture | 8% - 10% |
| Fixtures | 6% - 12% |
| Office supplies and hardware | 8% - 25% |
The BBVA Group’s criteria for determining the recoverable amount of these assets, in particular buildings for own use, is based on independent appraisals that are no more than 3-5 years old at most, unless there are indications of impairment.
At each reporting date, the Group entities analyze whether there are internal or external indicators that a tangible asset may be impaired. When there is evidence of impairment, the Group analyzes whether this impairment actually exists by comparing the asset’s net carrying amount with its recoverable amount (as the higher between its recoverable amount less disposal costs and its value in use). When the carrying amount exceeds the recoverable amount, the carrying amount is written down to the recoverable amount and depreciation charges going forward are adjusted to reflect the asset’s remaining useful life.
Similarly, if there is any indication that the value of a tangible asset is now recoverable, the consolidated entities will estimate the recoverable amounts of the asset and recognize it in the consolidated income statement, recording the reversal of the impairment loss registered in previous years and thus adjusting future depreciation charges. Under no circumstances may the reversal of an impairment loss on an asset raise its carrying amount above that which it would have if no impairment losses had been recognized in prior years.
Running and maintenance expenses relating to tangible assets held for own use are recognized as an expense in the year they are incurred and recognized in the consolidated income statements under the heading "Administration costs - Other administrative expenses - Property, fixtures and equipment" (see Note 44.2).
Other assets leased out under an operating lease
The criteria used to recognize the acquisition cost of assets leased out under operating leases, to calculate their depreciation and their respective estimated useful lives and to recognize the impairment losses on them, are the same as those described in relation to tangible assets for own use.
Investment properties
The heading “Tangible assets - Investment properties” in the consolidated balance sheets reflects the net values (purchase cost minus the corresponding accumulated depreciation and, if appropriate, estimated impairment losses) of the land, buildings and other structures that are held either to earn rentals or for capital appreciation through sale and that are neither expected to be sold off in the ordinary course of business nor are destined for own use (see Note 17).
The criteria used to recognize the acquisition cost of investment properties, calculate their depreciation and their respective estimated useful lives and recognize the impairment losses on them, are the same as those described in relation to tangible assets held for own use.
The BBVA Group’s criteria for determining the recoverable amount of these assets is based on independent appraisals that are no more than one year old at most, unless there are indications of impairment.
2.2.6 Inventories
The balance under the heading “Other assets - Inventories” in the consolidated balance sheets mainly includes the land and other properties that the BBVA Group’s real estate entities hold for development and sale as part of their real estate development activities (see Note 20).
The cost of inventories includes those costs incurred in their acquisition and development, as well as other direct and indirect costs incurred in getting them to their current condition and location.
In the case of the cost of real-estate assets accounted for as inventories, the cost is comprised of: the acquisition cost of the land, the cost of urban planning and construction, non-recoverable taxes and costs corresponding to construction supervision, coordination and management. Financing cost incurred during the year form part of cost, provided that the inventories require more than a year to be in a condition to be sold.
Properties purchased from customers in distress, which the Group manages for sale, are measured at the acquisition date and any subsequent time, at either their related carrying amount or the fair value of the property (less costs to sell), whichever is lower. The carrying amount at acquisition date of these properties is defined as the balance pending collection on those assets that originated said purchases (net of provisions).
Impairment
The amount of any subsequent adjustment due to inventory valuation for reasons such as damage, obsolescence, reduction in sale price to its net realizable value, as well as losses for other reasons and, if appropriate, subsequent recoveries of value up to the limit of the initial cost value, are registered under the heading "Impairment or reversal of impairment on non-financial assets” in the accompanying consolidated income statements (see Note 48) for the year in which they are incurred.
In the case of the above mentioned real-estate assets, if the fair value less costs to sell is lower than the carrying amount of the loan recognized in the consolidated balance sheet, a loss is recognized under the heading "Impairment or reversal of impairment on non-financial assets" in the consolidated income statement for the period. In the case of real-estate assets accounted for as inventories, the BBVA Group’s criterion for determining their net realizable value is mainly based on independent appraisals no more than one year old, or less if there are indications of impairment.
Inventory sales
In sale transactions, the carrying amount of inventories is derecognized from the consolidated balance sheet and recognized as an expense under the income statement heading "Other operating expenses – Changes in inventories” in the year in which the income from its sale is recognized. This income is recognized under the heading “Other operating income – Financial income from non-financial services” in the consolidated income statements (see Note 42).
2.2.7 Business combinations
A business combination is a transaction, or any other deal, by which the Group obtains control of one or more businesses. It is accounted for by applying the acquisition method.
According to this method, the acquirer has to recognize the assets acquired and the liabilities and contingent liabilities assumed, including those that the acquired entity had not recognized in the accounts. The method involves the measurement of the consideration received for the business combination and its allocation to the assets, liabilities and contingent liabilities measured according to their fair value, at the purchase date, as well as the recognition of any non-controlling participation (minority interests) that may arise from the transaction.
In a business combination achieved in stages, the acquirer shall remeasure its previously held equity interest in the acquiree at its acquisition-date fair value and recognize the resulting gain or loss, if any, in profit or loss under the heading “Gains (losses) on derecognized of non-financial assets and subsidiaries, net” of the consolidated income statements. In prior reporting periods, the acquirer may have recognized changes in the value of its equity interest in the acquiree in other comprehensive income. If so, the amount that was recognized in other comprehensive income shall be recognized on the same basis as would be required if the acquirer had disposed directly of the previously held equity interest.
In addition, the acquirer shall recognize an asset in the consolidated balance sheet under the heading “Intangible asset - Goodwill” if on the acquisition date there is a positive difference between::
If this difference is negative, it shall be recognized directly in the income statement under the heading “Gain on Bargain Purchase in business combinations”.
Non-controlling interests in the acquired entity may be measured in two ways: either at their fair value; or at the proportional percentage of net assets identified in the acquired entity. The method of valuing non- controlling interest may be elected in each business combination. BBVA Group has always elected for the second method.
2.2.8 Intangible assets
Goodwill
Goodwill represents a portion of consideration transferred in advance by the acquiring entity for the future economic benefits from assets that cannot be individually identified and separately recognized. Goodwill is never amortized. It is subject periodically to an impairment analysis, and is written off if there has been impairment.
Goodwill is assigned to one or more cash-generating units that expect to be the beneficiaries of the synergies derived from the business combinations. The cash-generating units represent the Group’s smallest identifiable asset groups that generate cash flows for the Group and that are largely independent of the flows generated from the Group’s other assets or groups of assets. Each unit or units to which goodwill is allocated:
The cash-generating units to which goodwill has been allocated are tested for impairment (including the allocated goodwill in their carrying amount). This analysis is performed at least annually or more frequently if there is any indication of impairment.
For the purpose of determining the impairment of a cash-generating unit to which a part of goodwill has been allocated, the carrying amount of that cash-generating unit, adjusted by the theoretical amount of the goodwill attributable to the non-controlling interests, in the event they are not valued at fair value, is compared with its recoverable amount.
The recoverable amount of a cash-generating unit is equal to the fair value less sale costs or its value in use, whichever is greater. Value in use is calculated as the discounted value of the cash flow projections that the unit’s management estimates and is based on the latest budgets approved for the coming years. The main assumptions used in its calculation are: a sustainable growth rate to extrapolate the cash flows indefinitely, and the discount rate used to discount the cash flows, which is equal to the cost of the capital assigned to each cash-generating unit, and equivalent to the sum of the risk-free rate plus a risk premium inherent to the cash-generating unit being evaluated for impairment.
If the carrying amount of the cash-generating unit exceeds the related recoverable amount, the Group recognizes an impairment loss; the resulting loss is apportioned by reducing, first, the carrying amount of the goodwill allocated to that unit and, second, if there are still impairment losses remaining to be recognized, the carrying amount of the remainder of the assets. This is done by allocating the remaining loss in proportion to the carrying amount of each of the assets in the unit. In the event the non-controlling interests are measured at fair value, the deterioration of goodwill attributable to non-controlling interests will be recognized. In any case, an impairment loss recognized for goodwill shall not be reversed in a subsequent period.
Goodwill impairment losses are recognized under the heading "Impairment or reversal of impairment on non-financial assets – Intangible assets” in the consolidated income statements (see Note 48).
Other intangible assets
These assets may have an indefinite useful life if, based on an analysis of all relevant factors, it is concluded that there is no foreseeable limit to the period over which the asset is expected to generate net cash flows for the consolidated entities. In all other cases they have a finite useful life.
Intangible assets with a finite useful life are amortized according to the duration of this useful life, using methods similar to those used to depreciate tangible assets. The defined useful life intangible asset is made up mainly of IT applications acquisition costs which have a useful life of 3 to 5 years. The depreciation charge of these assets is recognized in the accompanying consolidated income statements under the heading "Depreciation" (see Note 45).
The consolidated entities recognize any impairment loss on the carrying amount of these assets with charge to the heading “Impairment or reversal of impairment on non - financial assets- Intangible assets” in the accompanying consolidated income statements (see Note 48). The criteria used to recognize the impairment losses on these assets and, where applicable, the recovery of impairment losses recognized in prior years, are similar to those used for tangible assets.
2.2.9 Insurance and reinsurance contracts
The assets of the BBVA Group’s insurance subsidiaries are recognized according to their nature under the corresponding headings of the consolidated balance sheets and the initial recognition and valuation is carried out according to the criteria set out in IFRS 4.
The heading “Insurance and reinsurance assets” in the accompanying consolidated balance sheets includes the amounts that the consolidated insurance subsidiaries are entitled to receive under the reinsurance contracts entered into by them with third parties and, more specifically, the share of the reinsurer in the technical provisions recognized by the consolidated insurance subsidiaries.
The heading “Liabilities under insurance and reinsurance contracts” in the accompanying consolidated balance sheets includes the technical provisions for direct insurance and inward reinsurance recognized by the consolidated insurance subsidiaries to cover claims arising from insurance contracts in force at period- end (see Note 23).
The income or expenses reported by the BBVA Group’s consolidated insurance subsidiaries on their insurance activities is recognized, in accordance with their nature, in the corresponding items of the consolidated income statements.
The consolidated insurance entities of the BBVA Group recognize the amounts of the premiums written to the income statement and a charge for the estimated cost of the claims that will be incurred at their final settlement to their consolidated income statements. At the close of each year the amounts collected and unpaid, as well as the costs incurred and unpaid, are accrued.
The most significant provisions registered by consolidated insurance entities with respect to insurance policies issued by them are set out by their nature in Note 23.
According to the type of product, the provisions may be as follows:
The BBVA Group controls and monitors the exposure of the insurance subsidiaries to financial risk and, to this end, uses internal methods and tools that enable it to measure credit risk and market risk and to establish the limits for these risks.
2.2.10 Tax assets and liabilities
Expenses on corporate income tax applicable to the BBVA Group’s Spanish entities and on similar income taxes applicable to consolidated foreign entities are recognized in the consolidated income statement, except when they result from transactions on which the profits or losses are recognized directly in equity, in which case the related tax effect is also recognized in equity.
The total corporate income tax expense is calculated by aggregating the current tax arising from the application of the corresponding tax rate to the tax for the year (after deducting the tax credits or discounts allowable for tax purposes) and the change in deferred tax assets and liabilities recognized in the consolidated income statement.
Deferred tax assets and liabilities include temporary differences, defined as the amounts to be payable or recoverable in future years arising from the differences between the carrying amount of assets and liabilities and their tax bases (the “tax value”), and tax loss and tax credit or discount carry forwards (see Note 19).
The "Tax Assets" line item in the accompanying consolidated balance sheets includes the amount of all the assets of a tax nature, and distinguishes between: "Current” (amounts recoverable by tax in the next twelve months) and "Deferred" (which includes the amount of tax to be recovered in future years, including those arising from tax losses or credits for deductions or rebates that can be compensated). The "Tax Liabilities" line item in the accompanying consolidated balance sheets includes the amount of all the liabilities of a tax nature, except for provisions for taxes, broken down into: "Current” (income tax payable on taxable profit for the year and other taxes payable in the next twelve months) and "Deferred" (the amount of corporate tax payable in subsequent years).
Deferred tax liabilities attributable to taxable temporary differences associated with investments in subsidiaries, associates or joint venture entities are recognized as such, except where the Group can control the timing of the reversal of the temporary difference and it is unlikely that it will reverse in the future. Deferred tax assets are recognized to the extent that it is considered probable that the consolidated entities will have sufficient taxable profits in the future against which the deferred tax assets can be utilized and are not from the initial recognition (except in the case of a business combination) of other assets or liabilities in a transaction that does not affect the fiscal outcome or the accounting result.
The deferred tax assets and liabilities recognized are reassessed by the consolidated entities at each balance sheet date in order to ascertain whether they still qualify as deferred tax assets and liabilities, and the appropriate adjustments are made on the basis of the findings of the analyses performed. In those circumstances in which it is unclear how a specific requirement of the tax law applies to a particular transaction or circumstance, and the acceptability of the definitive tax treatment depends on the decisions taken by the relevant taxation authority in future, the entity recognizes current and deferred tax liabilities and assets considering whether it is probable or not that a taxation authority will accept an uncertain tax treatment. Thus, if the entity concludes that it is not probable that the taxation authority will accept an uncertain tax treatment, the entity uses the amount expected to be paid to (recovered from) the taxation authorities.
The income and expenses directly recognized in consolidated equity that do not increase or decrease taxable income are accounted for as temporary differences.
2.2.11 Provisions, contingent assets and contingent liabilities
The heading “Provisions” in the consolidated balance sheets includes amounts recognized to cover the BBVA Group’s current obligations arising as a result of past events. These are certain in terms of nature but uncertain in terms of amount and/or settlement date. The settlement of these obligations is deemed likely to entail an outflow of resources embodying economic benefits (see Note 24). The obligations may arise in connection with legal or contractual provisions, valid expectations formed by Group entities relative to third parties in relation to the assumption of certain responsibilities or through virtually certain developments of particular aspects of the regulations applicable to the operation of the entities; and, specifically, future legislation to which the Group will certainly be subject. The provisions are recognized in the consolidated balance sheets when each and every one of the following requirements is met:
Among other items, these provisions include the commitments made to employees by some of the Group entities (mentioned in Note 2.2.12), as well as provisions for tax and legal litigation.
Contingent assets are possible assets that arise from past events and whose existence is conditional on, and will be confirmed only by, the occurrence or non-occurrence of events beyond the control of the Group. Contingent assets are not recognized in the consolidated balance sheet or in the consolidated income statement; however, they will be disclosed, should they exist, in the Notes to the Consolidated Financial Statements, provided that it is probable will give rise to an increase in resources embodying economic benefits.
Contingent liabilities are possible obligations of the Group that arise from past events and whose existence is conditional on the occurrence or non-occurrence of one or more future events beyond the control of the Group. They also include the existing obligations of the Group when it is not probable that an outflow of resources embodying economic benefits will be required to settle them; or when, in extremely rare cases, their amount cannot be measured with sufficient reliability.
Contingent liabilities are not recognized in the consolidated balance sheet or the income statement (excluding contingent liabilities from business combination) but are disclosed in the Consolidated Financial Statements, unless the possibility of an outflow of resources embodying economic benefits is remote.
2.2.12 Pensions and other post-employment commitments
Below we provide a description of the most significant accounting policies relating to post-employment and other employee benefit commitments assumed by BBVA Group entities (see Note 25).
Short-term employee benefits
Benefits for current active employees which are accrued and settled during the year and for which a provision is not required in the entity ́s accounts. These include wages and salaries, social security charges and other personnel expenses.
Costs are charged and recognized under the heading “Administration costs – Personnel expenses – Other personnel expenses” of the consolidated income statement (see Note 44.1).
Post-employment benefits – Defined-contribution plans
The Group sponsors defined-contribution plans for the majority of its active employees. The amount of these benefits is established as a percentage of remuneration and/or as a fixed amount.
The contributions made to these plans in each period by BBVA Group entities are charged and recognized under the heading “Administration costs – Personnel expenses – Defined-contribution plan expense” of the consolidated income statement (see Note 44.1).
Post-employment benefits – Defined-benefit plans
Some Group entities maintain pension commitments with employees who have already retired or taken early retirement, certain closed groups of active employees still accruing defined benefit pensions, and in-service death and disability benefits provided to most active employees. These commitments are covered by insurance contracts, pension funds and internal provisions.
In addition, some of the Spanish entities have offered certain employees the option to retire before their normal retirement age, recognizing the necessary provisions to cover the costs of the associated benefit commitments, which include both the liability for the benefit payments due as well as the contributions payable to external pension funds during the early retirement period.
Furthermore, certain Group entities provide welfare and medical benefits which extend beyond the date of retirement of the employees entitled to the benefits.
All of these commitments are quantified based on actuarial valuations, with the amounts recorded under the heading “Provisions – Provisions for pensions and similar obligations” in the consolidated balance sheet and determined as the difference between the value of the defined-benefit commitments and the fair value of plan assets at the date of the Consolidated Financial Statements (see Note 25).
Current service cost are charged and recognized under the heading “Administration costs – Personnel expenses – Defined-benefit plan expense” of the consolidated income statement (see Note 44.1).
Interest credits/charges relating to these commitments are charged and recognized under the headings “Interest income” and “Interest expense” of the consolidated income statement (see Note 37).
Past service costs arising from benefit plan changes as well as early retirements granted during the period are recognized under the heading “Provisions or reversals of provisions” of the consolidated income statement (see Note 46).
Other long-term employee benefits
In addition to the above commitments, certain Group entities provide long-term service awards to their employees, consisting of monetary amounts or periods of vacation granted upon completion of a number of years of qualifying service.
These commitments are quantified based on actuarial valuations and the amounts recorded under the heading “Provisions – Other long-term employee benefits” of the consolidated balance sheet (see Note 24).
Valuation of commitments: actuarial assumptions and recognition of gains/losses
The present value of these commitments is determined based on individual member data. Active employee costs are determined using the “projected unit credit” method, which treats each period of service as giving rise to an additional unit of benefit and values each unit separately.
In establishing the actuarial assumptions we take into account that:
The BBVA Group recognizes actuarial gains/losses relating to early retirement benefits, long service awards and other similar items under the heading “Provisions or reversal of provisions” of the consolidated income statement for the period in which they arise (see Note 46). Actuarial gains/losses relating to pension and medical benefits are directly charged and recognized under the heading "Accumulated other comprehensive income – Items that will not be reclassified to profit or loss – Actuarial gains or losses on defined benefit pension plans" of equity in the consolidated balance sheet (see Note 30).
2.2.13 Equity-settled share-based payment transactions
Provided they constitute the delivery of such equity instruments following the completion of a specific period of services, equity-settled share-based payment transactions are recognized as an expense for services being provided by employees, by way of a balancing entry under the heading “Shareholders’ funds – Other equity instruments” in the consolidated balance sheet (Note 44.1.1). These services are measured at fair value for the employees services received, unless such fair value cannot be calculated reliably. In such case, they are measured by reference to the fair value of the equity instruments granted, taking into account the date on which the commitments were granted and the terms and other conditions included in the commitments.
When the initial compensation agreement includes what may be considered market conditions among its terms, any changes in these conditions will not be reflected in the consolidated income statement, as these have already been accounted for in calculating the initial fair value of the equity instruments. Non-market vesting conditions are not taken into account when estimating the initial fair value of equity instruments, but they are taken into account when determining the number of equity instruments to be issued. This will be recognized on the consolidated income statement with the corresponding increase in total consolidated equity.
2.2.14 Termination benefits
Termination benefits are recognized in the financial statements when the BBVA Group agrees to terminate employment contracts with its employees and has established a detailed plan.
2.2.15 Treasury shares
The value of common stock issued by the BBVA Group’s entities and held by them - basically, shares and derivatives on the Bank’s shares held by some consolidated entities that comply with the requirements to be recognized as equity instruments - are recognized as a decrease to net equity, under the heading "Shareholders’ funds - Treasury stock" in the consolidated balance sheets (see Note 29).
These financial assets are recognized at acquisition cost, and the gains or losses arising on their disposal are credited or debited, as appropriate, to the heading “Shareholders’ funds - Retained earnings” in the consolidated balance sheets (see Note 28).
2.2.16 Foreign-currency transactions and exchange differences
The BBVA Group’s functional currency, and thus the currency in which the Consolidated Financial Statements are presented, is the euro. As such, all balances and transactions denominated in currencies other than the euro are deemed to be denominated in “foreign currency”.
Conversion to euros of the balances held in foreign currency is performed in two consecutive stages:
Conversion of the foreign currency to the entity’s functional currency
Transactions denominated in foreign currencies carried out by the consolidated entities (or accounted for using the equity method) are initially accounted for in their respective currencies. Subsequently, the monetary balances in foreign currencies are converted to their respective functional currencies using the exchange rate at the close of the financial year. In addition,
The exchange differences produced when converting the balances in foreign currency to the functional currency of the consolidated entities are generally recognized under the heading "Exchange differences, net" in the consolidated income statements (see Note 41). However, the exchange differences in non-monetary items, measured at fair value, are recognized temporarily in consolidated equity under the heading “Accumulated other comprehensive income - Items that may be reclassified to profit or loss - Exchange differences” in the consolidated balance sheets (see Note 30).
Conversion of functional currencies to euros
The balances in the financial statements of consolidated entities whose functional currency is not the euro are converted to euros as follows:
The exchange differences arising from the conversion to euros of balances in the functional currencies of the consolidated entities whose functional currency is not the euro are recognized under the heading “Accumulated other comprehensive income – Items that may be reclassified to profit or loss - Exchange differences” in the consolidated balance sheets (Notes 30 and 31 respectively). Meanwhile, the differences arising from the conversion to euros of the financial statements of entities accounted for by the equity method are recognized under the heading " Accumulated other comprehensive income - Items that may be reclassified to profit or loss - Entities accounted for using the equity method" (Note 30) until the item to which they relate is derecognized, at which time they are recognized in the income statement.
The breakdown of the main consolidated balances in foreign currencies, with reference to the most significant foreign currencies, is set forth in Appendix VII.
Venezuela
Local financial statements of the Group subsidiaries in Venezuela are expressed in Venezuelan Bolivar, and converted into euros for the consolidated financial statements, as indicated below, since Venezuela is a country with strong exchange restrictions and has different rates officially published:
The summarized balance sheet and income statements of the Group subsidiaries in Venezuela as of December 31, 2017, whose local financial statements are expressed in Venezuelan bolivars comparing their conversion to euros with the estimated exchange rate with the balances that would have result by applying the last published exchange rate, are as follows:
Balance sheet. December 31, 2017 (Millions of euros)
| Estimated exchange rate | Official Exchange rate | Variation | |
|---|---|---|---|
| Cash and balances with central banks | 597 | 2,287 | 1,690 |
| Securities portfolio | 42 | 148 | 107 |
| Loans and receivables | 364 | 1,650 | 1,285 |
| Tangible assets | 60 | 272 | 212 |
| Other | 28 | 131 | 103 |
| TOTAL ASSETS | 1,091 | 4,487 | 3,397 |
| Deposits from central bank and credit institutions | - | 1 | 1 |
| Customer deposits | 839 | 3,772 | 2,933 |
| Provisions | 5 | 24 | 18 |
| Other | 127 | 465 | 338 |
| TOTAL LIABILITIES | 971 | 4,262 | 3,291 |
Income statements December 31, 2017 (Millions of euros)
| Estimated exchange rate | Official Exchange rate | Variation | |
|---|---|---|---|
| NET INTEREST ICOME | 90 | 410 | 319 |
| GROSS INCOME | 70 | 319 | 249 |
| Administration costs | 55 | 249 | 194 |
| NET OPERATING INCOME | 15 | 70 | 54 |
| OPERATING PROFIT BEFORE TAX | 12 | 53 | 41 |
| Tax expense or (-) income related to profit or loss from continuing operation | 20 | 90 | 70 |
| PROFIT | (8) | (38) | (29) |
| Attributable to minority interest [non-controlling interests] | (4) | (16) | (13) |
| Attributable to owners of the parent | (5) | (21) | (17) |
2.2.17 Recognition of income and expenses
The most significant policies a used by the BBVA Group to recognize its income and expenses are as follows.
2.2.18 Sales of assets and income from the provision of non-financial services
The heading “Other operating income” in the consolidated income statements includes the proceeds of the sales of assets and income from the services provided by the Group entities that are not financial institutions. In the case of the Group, these entities are mainly real estate and service entities (see Note 42).
2.2.19 Leases
Lease contracts are classified as finance leases from the inception of the transaction if they substantially transfer all the risks and rewards incidental to ownership of the asset forming the subject-matter of the contract. Leases other than finance leases are classified as operating leases.
When the consolidated entities act as the lessor of an asset under finance leases, the aggregate present values of the lease payments receivable from the lessee plus the guaranteed residual value (normally the exercise price of the lessee’s purchase option on expiration of the lease agreement) are recognized as financing provided to third parties and, therefore, are included under the heading “Loans and receivables” in the accompanying consolidated balance sheets (see Note 13)
When the consolidated entities act as lessors of an asset in operating leases, the acquisition cost of the leased assets is recognized under "Tangible assets – Property, plant and equipment – Other assets leased out under an operating lease" in the consolidated balance sheets (see Note 17). These assets are depreciated in line with the criteria adopted for items of tangible assets for own use, while the income arising from the lease arrangements is recognized in the consolidated income statements on a straight-line basis within "Other operating expenses" (see Note 42).
If a fair value sale and leaseback results in an operating lease, the profit or loss generated from the sale is recognized in the consolidated income statement at the time of sale. If such a transaction gives rise to a finance lease, the corresponding gains or losses are accrued over the lease period.
The assets leased out under operating lease contracts to other entities in the Group are treated in the Consolidated Financial Statements as for own use, and thus rental expense and income is eliminated in consolidation and the corresponding depreciation is recognized.
2.2.20 Entities and branches located in countries with hyperinflationary economies
In order to assess whether an economy is under hyperinflation, the country’s economic environment is evaluated, analyzing whether certain circumstances exist, such as:
The fact that any of these circumstances is present will not be a decisive factor in considering an economy hyperinflationary, but it does provide some reasons to consider it as such.
Since 2009, the economy of Venezuela can be considered hyperinflationary under the above criteria. As a result, the financial statements of the BBVA Group’s entities located in Venezuela have therefore been adjusted to correct for the effects of inflation in accordance with IAS 29 “ Financial Reporting in Hyperinflationary Economies“.
The breakdown of the General Price Index (“GPI”) and the inflation index used as of December 31, 2017, 2016 and 2015 for the inflation restatement of the financial statements of the Group companies located in Venezuela is as follows:
General Price Index
| 2017 | 2016 | 2015 | |
|---|---|---|---|
| GPI | 84,886.50 | 9,431.60 | 2,357.90 |
| Average GPI | 27,714.47 | 5,847.74 | 1,460.50 |
| Inflation of the period (*) | 800.0% | 300.0% | 170.0% |
The impact on the consolidated financial statements that would result from applying the latest official inflation data published against the Group's estimate of the inflation index would not be significant due to its correlation with the estimated exchange rate (see Note 2.2.16).
The losses recognized under the heading “Profit attributable to the parent company” in the accompanying consolidated income statement as a result of the adjustment for inflation on net monetary position of the Group entities in Venezuela amounted to €13 and €28 million in 2017 and 2016 respectively.
2.3 Recent IFRS pronouncements
Changes introduced in 2017
The following amendments to the IFRS standards or their interpretations (hereinafter “IFRIC”) became effective after January 1, 2017. They have not had a significant impact on the BBVA Group’s Consolidated Financial Statements corresponding to the year ended December 31, 2017.
IAS 12 – “Income Taxes. Recognition of Deferred Tax Assets for Unrealized Losses”
The amendments made to IAS 12 clarify the requirements on recognition of deferred tax assets for unrealized losses. The following aspects are clarified:
An unrealized loss on a debt instrument measured at fair value gives rise to a deductible temporary difference regardless of whether the holder expects to recover its carrying amount by holding the debt instrument until maturity or by selling the debt instrument.
An entity assesses the utilization of deductible temporary differences in combination with other deductible temporary differences. In circumstances in which tax laws restricts the utilization of tax losses, an entity would assess a deferred tax asset in combination with other deferred tax assets of the appropriate type
An entity’s estimate of future taxable profit can include the recovery of its assets for amounts more than their carrying amounts if there is sufficient evidence to conclude that it is probable that the entity will achieve this.
An entity’s estimate of future taxable profit excludes tax deductions resulting from the reversal of deductible temporary difference.
IAS 7 – “Statement of Cash Flows. Disclosure Initiative”
The amendments to IAS 7 introduce the following new disclosure requirements related to changes in liabilities arising from financing activities, to enable users of financial statements to evaluate changes in those liabilities: changes from financing cash flows; changes arising from obtaining or losing control of subsidiaries or other businesses; the effect of changes in foreign exchange rates; changes in fair values; and other changes.
Liabilities arising from financing activities are liabilities for which cash flows were, or future cash flows will be, classified in the statement of cash flows as cash flows arising from financing activities. Additionally, the disclosure requirements also apply to changes in financial assets if cash flows from those financial assets were, or future cash flows will be, included in cash flows from financing activities.
Annual improvements cycle to IFRSs 2014-2016 – Minor amendments to IFRS 12
The annual improvements cycle to IFRSs 2014-2016 includes minor changes and clarifications to IFRS 12 – Disclosure of Interests in Other Entities. The European Union has not yet approved the adoption of the amendments.
Standards and interpretations issued but not yet effective as of December 31, 2017
New International Financial Reporting Standards together with their interpretations had been published at the date of preparation of the accompanying Consolidated Financial Statements, but are not obligatory as of June 30, 2017. Although in some cases the IASB permits early adoption before they come into force, the BBVA Group has not done such application in advance. The most relevant are the following:
IFRS 9 - “Financial instruments”
As of July, 24, 2014, IASB issued IFRS 9 which replaces IAS 39 on financial statements from January 2018 onwards and includes new classification and measurement requirements of financial assets and liabilities, impairment requirements of financial assets and hedge accounting policy (See Note 56).
Since the initial drafts of the standards were published, the Group has been analyzing their implications once in effect in 2018, both in terms of classification of the portfolios and the valuation models for financial instruments and, in particular, the models for calculating impairment of financial assets using expected loss models.
In the fiscal years 2016 and 2017, the Group implemented a project for applying IFRS 9 with the participation of all the areas affected: finance, risks, technology, business areas, etc., with the involvement of the Group's senior management.
The Project sets the definition of accounting policies and processes on the implementation of the Standard, which has implications both on the financial statements and on the Group ́s daily operations (initial and subsequent risk assessment, changes in systems, management metrics, etc.), and also on the models used for the presentation of financial statements.
The main requirements of IFRS 9 are:
Financial assets
IFRS 9 has a new approach to classification and measurement of financial assets which is a mirror of the business model used for asset management purposes and its cash flow characteristics.
IFRS 9 contains three main categories for financial assets classification: valued at amortized cost, valued at fair value with changes in other accumulated comprehensive income, and valued at fair value through profit or loss. The standard eliminates the existing IAS 39 categories of held-to-maturity investments, loans and receivables, and available-for-sale financial assets.
The classification of financial instruments as measured at amortized cost or fair value must be carried out on the basis of: the entity's business model and the assessment of the contractual cash flow, commonly known as the "solely payments of principle and interest" criterion (hereinafter, the SPPI). The purpose of the SPPI test is to determine whether in accordance with the contractual characteristics of the instrument its cash flows only represent the return of the principal and interest, basically understood as consideration for the time value of money and the debtor's credit risk.
A financial instrument will be classified in the amortized cost portfolio when it is managed with a business model whose purpose is to maintain the financial assets to receive contractual cash flows, and passes the SPPI test. They will be classified in the portfolio of financial assets at fair value with changes in other comprehensive income if they are managed with a business model whose purpose combines collection of the contractual cash flows and sale of the assets, and meets the SPPI test. They will be classified at fair value with changes in profit and loss provided that the entity's business model for their management or the contractual characteristics of its cash flows do not require classification into one of the portfolios described above.
During 2017, the Group reviewed the existing business models in the geographic areas where it operates to establish their classification in accordance with IFRS 9, taking into account the special characteristics of the local structures and organizations, as well as the type of products.
The Group has defined criteria to determine the acceptable frequency and reasons for sales so that the instrument can remain in the category of held to collect contractual cash flows.
Regardless of the frequency and importance of the sales, some types of sales are not incompatible with the category of held to collect contractual flows: sales due to reduction in credit quality; sales close to the maturity of transactions so that variations in market prices will not have a significant effect on the cash flows of the financial asset; sales in response to a change in regulations or in taxation; sales in response to an internal restructuring or significant business combination; sales derived from the execution of a liquidity crisis plan when the crisis event is not reasonably foreseeable.
The Group has segmented the portfolio of instruments for carrying out the SPPI test by differentiating products with standard contracts (all the instruments have identical contractual characteristics and are broadly used), for which the Group has carried out the SPPI test by reviewing the standard framework contract. Those products with similar characteristics, but not identical, compliance has been assessed through a sampling exercise of contracts. Finally, all the financial instruments with specific contractual characteristics have been analyzed individually.
As a result of the analyses carried out on both the business model and the contractual characteristics, certain accounting reclassifications are expected affecting both financial assets and, as the case may be, financial liabilities related to those assets. In general, there will be a greater volume of assets valued at fair value with changes in the income statement and the valuation method of some instruments will also be changed according to the one that best reflects the business model to which they belong. Changes in the valuation model in order not to exceed the criterion of payment of principal and interest are not significant.
As of December 31, 2017, the Group had certain investments in asset instruments classified as available-for- sale which, in accordance with IFRS 9, starting in 2018 the Group will designate these investments as financial assets at fair value through changes in accumulated other comprehensive income. As a result, all the gains and losses at fair value of these instruments will be reported in other cumulative comprehensive income. Impairment losses will not be recognized to profit and loss, and gains or losses will not be reclassified to the income statement in the case of divestment. The remaining investments held by the Group as of December 31, 2017 in equity instruments classified as available-for-sale will be accounted at fair value through changes in profit or loss.
Financial liabilities
IFRS 9 largely maintains the requirements under IAS 39 for classifying financial liabilities. Thus, save for the above mentioned changes derived from the business model allocation of assets associated to them, the classification of financial liabilities in accordance with IAS 39 will not be changed. However, a new aspect introduced by IFRS 9 is the recognition of changes in the fair value of the financial liabilities to which the fair value option is applied. In this case, the changes in the fair value attributable the credit risk itself should be recognized as other comprehensive income, while the rest of the variation will be recognized in the income statement. In any case, the variation of credit risk itself may be recognized in the income statement if the treatment described above generates some accounting asymmetry.
IFRS 9 replaces the "incurred loss" model in IAS 39 with one of "expected credit loss". The new impairment model will be applied to financial assets valued at amortized cost; to financial assets valued at fair value with changes in accumulated other comprehensive income, except for investments in equity instruments; and contracts for financial guarantees and loan commitments.
The new standard classifies financial instruments into three categories, which depend on the evolution of their credit risk from the moment of initial recognition. The first category includes the operations when they are initially recognized; the second comprises the operations for which a significant increase in credit risk has been identified since its initial recognition and the third one, the impaired operations.
The calculation of the hedges for credit risk in each of these three categories must be done differently. In this way, the expected loss to 12 months for the operations classified in the first of the aforementioned categories must be recorded, while the losses estimated for the remaining expected life of the operations classified in the other two categories must be recorded. Thus, IFRS 9 differentiates between the following concepts of expected loss:
All this will require considerable judgment, both in the modeling for the estimation of the expected losses and in the forecasts, on how the economic factors affect such losses, which must be carried out on a weighted probability basis.
For the purposes of the implementation of IFRS 9 project, the BBVA Group has applied the following definitions:
Although the standard introduces a series of operational simplifications or practical solutions for analyzing the increase in significant risk, the Group does not expect to use them as a general rule. However, for high- quality assets, mainly related to certain government institutions and bodies, the standard allows for considering directly that their credit risk has not increased significantly because they have a low credit risk at the presentation date.
Thus the classification of financial instruments subject to impairment under the new IFRS 9 will be as follows:
Based on the impairment methodology described below, the Group has estimated that the application of the impairment requirements under IFRS 9 as of January 1, 2018 will give rise to additional impairment losses.
Method for calculating expected loss
In accordance with IFRS 9, the measurement of expected losses must reflect:
The Group plans to measure the expected loss both individually and collectively. The purpose of the Group's individual measurement is to estimate expected losses for significant impaired risks, or risks classified in Stage 2. In these cases, the amount of credit losses is calculated as the difference between expected discounted cash flows at the effective interest rate of the transaction and the carrying amount of the instrument.
For the collective measurement of expected losses the instruments are grouped into groups of assets based on their risk characteristics. Exposure within each group is segmented according to the common credit risk characteristics, similar characteristics of the credit risk, indicative of the payment capacity of the borrower in accordance with their contractual conditions. These risk characteristics will have to be relevant in estimating the future flows of each group. The characteristics of credit risk may consider, among others, the following factors:
The estimated losses are derived from the following parameters:
In the case of debt securities, the Group supervises the changes in credit risk through monitoring the external published credit ratings.
To determine whether there is a significant increase in credit risk as of January 1, 2018 that is not reflected in the published ratings, the Group has also revised the changes in bond yields, and when they are available, the prices of CDS, together with the news and regulatory information available on the issuers.
Use of present, past and future information
IFRS 9 requires incorporation of present, past and future information to detect any significant increase in risk and measure expected loss.
The standard does not require identification of all possible scenarios for measuring expected loss. However, the probability of a loss event occurring and the probability it will not occur will also have to be considered, even though the possibility of a loss may be very small. Also, when there is no linear relation between the different future economic scenarios and their associated expected losses, more than one future economic scenario must be used for the measurement.
The approach used by the Group consists of using first the most probable scenario (baseline scenario) consistent with that used in the Group's internal management processes, and then applying an additional adjustment, calculated by considering the weighted average of expected losses in other economic scenarios (one more positive and the other more negative).
IFRS 9 will also affect hedge accounting, because the focus of the Standard is different from that of the current IAS 39, as it tries to align the accounting requirements with economic risk management. IFRS 9 will also permit to apply hedge accounting to a wider range of risks and hedging instruments. The Standard does not address the accounting for macro hedging strategies. To avoid any conflict between the current macro hedge accounting and the new general hedge accounting requirements, IFRS 9 includes an accounting policy choice to continue applying hedge accounting according to IAS 39.
Macro-hedges accounting is being developed as a separate project. The companies have the option to continue applying the hedge accounting as established by IAS39 until the project is completed. According to the analysis carried out, the Group will continue applying IAS 39 to its hedge accounting to the implementation date of IFRS 9.
The Group has assessed the estimated impact on its consolidated financial statements of the initial application of IFRS 9. The estimated impact of adopting this standard on the Group's capital as of January 1, 2018 is based on the assessments made to date. It is summed up below. The final impacts of adopting the standards as of January 1, 2018 may change because:
As of the date of preparing these Annual Accounts, the estimated impact on the CET1 fully-loaded ratio would be a reduction of approximately 31 basis points and the average estimated impact on the volume of provisions would be an increase of approximately 10% on the current level of provisions. This increase in provisions is mainly due to non-impaired risks that would be classified within Stage 2, which are the risks most affected by the change in the calculation methodology of provisions. By geographies, the increase in provisions is centered in Spain and Mexico. Finally, based on the analysis carried out to date, the impact on consolidated equity as a result of changes in classification and valuation of financial instruments is not expected to be significant.
However, the European Parliament and Commission have established a mechanism for applying IFRS 9 on capital ratios, transitional and of voluntary application by the entities. It is the intention of the Group to adhere to that provision.
Amended IFRS 7 - “Financial instruments: Disclosures”
The IASB modified IFRS 7 in December 2011 to include new disclosures on financial instruments that entities will have to provide as soon as they apply IFRS 9 for the first time.
IFRS 15 - “Revenue from contracts with customers”
IFRS 15 contains the principles that an entity shall apply to account for revenue and cash flows arising from a contract with a customer.
The core principle of IFRS 15 is that a company should recognize revenue to depict the transfer of promised goods or services to the customer in an amount that reflects the consideration to which the company expects to be entitled in exchange for those goods or services, in accordance with contractual agreements. It is considered that the good or service is transferred when the customer obtains control over it.
The new Standard replaces IAS 18 - Revenue IAS 11 - Construction Contracts, IFRIC 13 - Customer Loyalty Programmes, IFRIC 15 - Agreements for the Construction of Real Estate, IFRIC 18 - Transfers of Assets from Customers and SIC 31 – Revenue-Transactions Involving Advertising Services.
This Standard will be applied to the accounting years starting on or after January 1, 2018, although early adoption is permitted. It does not have a significant impact on the Consolidated Financial Statements.
IFRS 15 – “Clarifications to IFRS 15 Revenue from Contracts with Customers”
The amendments to the Revenue Standard clarify how some of the underlying principles of the new Standard should be applied. Specifically, they clarify how to:
In addition to the clarifications, the amendments include two additional reliefs to reduce cost and complexity for a company when it first applies the new Standard
The amendments will be applied at the same time as the IFRS 15, i.e. to the accounting periods beginning on or after January 1, 2018, although early application is permitted. It does not have a significant impact on the Consolidated Financial Statements.
Amended IFRS 10 – “Consolidated Financial Statements” and Amended IAS 28 - “Investments in Associates and Joint Ventures”
The amendments to IFRS 10 and IAS 28 establish that when an entity sells or transfers assets are considered a business (including its consolidated subsidiaries) to an associate or joint venture of the entity, the latter will have to recognize any gains or losses derived from such transaction in its entirety. Notwithstanding, if the assets sold or transferred are not considered a business, the entity will have to recognize the gains or losses derived only to the extent of the interests in the associate or joint venture with unrelated investors
These changes will be applicable to accounting periods beginning on the effective date, still to be determined, although early adoption is allowed.
IFRS 16 – “Leases”
On January 13, 2016 the IASB issued the IFRS 16 which will replace IAS 17. The new standard introduces a single lessee accounting model and will require a lessee to recognize assets and liabilities for all leases with a term of more than 12 months, unless the underlying asset is of low value. A lessee will be required to recognize a right-of–use asset representing its right to use the underlying leased asset and a lease liability representing its obligation to make lease payments.
With regard to lessor accounting, IFRS 16 substantially carries forward the lessor accounting requirements in IAS 17. Accordingly, a lessor will continue to classify its leases as operating leases or finance leases, and account for those two types of leases differently.
The standard will be applied to the accounting years starting on or after January 1, 2019, although early application is permitted if IFRS 15 is also applied.
IFRS 2 – “Classification and Measurement of Share-based Payment Transactions”
The amendments made to IFRS 2 provide requirements on three different aspects:
These amendments will be applied to the accounting periods beginning on or after January 1, 2018, although early application is permitted. It does not have a significant impact on the Consolidated Financial Statements.
Amended IFRS 4 “Insurance Contracts”
The amendments made to IFRS 4 address the temporary accounting consequences of the different effective dates of IFRS 9 and the forthcoming insurance contracts Standard, by introducing two optional solutions:
The deferral approach or temporary exemption, that gives entities whose predominant activities are connected with insurance the option to defer the application of IFRS 9 and continue applying IAS 39 until 2021.
The overlay approach, that gives all issuers of insurance contracts the option to recognize in other comprehensive income, rather than profit or loss, the additional accounting volatility that may arise from applying IFRS 9 compared to applying IAS 39 before applying the forthcoming insurance contracts Standard.
These modifications will be applied to the accounting periods beginning on or after January 1, 2018, although early application is permitted. It does not have a significant impact on the Consolidated Financial Statements.
Annual improvements cycle to IFRSs 2014-2016 – Minor amendments to IFRS 1 and IAS 28
The annual improvements cycle to IFRSs 2014-2016 includes minor changes and clarifications to IFRS 1- Frist-time Adoption of International Financial Reporting Standards and IAS 28 – Investments in Associates and Joint Ventures, which will be applied to the accounting periods beginning on or after January 1, 2018, although early application is permitted to amendments to IAS 28. It does not have a significant impact on the Consolidated Financial Statements.
IFRIC 22- Foreign Currency Transactions and Advance Consideration
The Interpretation addresses how to determine the date of the transaction, and thus, the exchange rate to use to translate the related asset, expense or income on initial recognition, in circumstances in which a non- monetary prepayment asset or a non-monetary deferred income liability arising from the payment or receipt of advance consideration is recognized in advance of the related asset, income or expense. It requires that the date of the transaction will be the date on which an entity initially recognizes the non-monetary asset or non-monetary liability.
If there are multiple payments or receipts in advance, the entity shall determine a date of the transaction for each payment or receipt of advance consideration.
The interpretation will be applied to the accounting periods beginning on or after January 1, 2018, although early application is permitted. It does not have a significant impact on the Consolidated Financial Statements.
Amended IAS 40 – Investment Property
The amendment states that an entity shall transfer a property to, or from, investment property when, and only when, there is evidence of a change in use. A change in use occurs when the property meets, or ceases to meet, the definition of investment property.
The amendments will be applied to the accounting periods beginning on or after January 1, 2018, although early adoption is allowed. It does not have a significant impact on the Consolidated Financial Statements.
IFRS 17 – Insurance Contracts
IFRS 17 establishes the principles for the accounting for insurance contracts and supersedes IFRS 4. The new standard introduces a single accounting model for all insurance contracts and requires the entities to use updated assumptions.
An entity shall divide the contracts into groups and recognize and measure groups of insurance contracts at the total of:
the fulfilment cash flows, that comprises the estimate of future cash flows, an adjustment to reflect the time value of money and the financial risk associated with the future cash flows and a risk adjustment for non- financial risk; and
the contractual service margin that represents the unearned profit.
The amounts recognized in the consolidate income statement shall be disaggregated into insurance revenue, insurance service expenses and insurance finance income or expenses. Insurance revenue and insurance service expenses shall exclude any investment components. Insurance revenue shall be recognized over the period the entity provides insurance coverage and in proportion to the value of the provision of coverage that the insurer provides in the period.
The new Standard will be applied to the accounting periods beginning on or after January 1, 2021, although early adoption is allowed.
IFRIC 23– Uncertainty over Income Tax Treatments
IFRIC 23 provides guidance on how to apply the recognition and measurement requirements in IAS 12 when there is uncertainty over income tax treatments.
If the entity considers that it is probable that the taxation authority will accept an uncertain tax treatment, the Interpretation requires the entity to determine taxable profit (tax loss), tax bases, unused tax losses, unused tax credits or tax rates consistently with the tax treatment used or planned to be used in its income tax filings.
If the entity considers that it is not probable that the taxation authority will accept an uncertain tax treatment, the Interpretation requires the entity to use the most likely amount or the expected value (sum of the probability. weighted amounts in a range of possible outcomes) in determining taxable profit (tax loss), tax bases, unused tax losses, unused tax credits and tax rates. The method used should be the method that the entity expects to provide the better prediction of the resolution of the uncertainty.
The interpretation will be applied to the accounting periods beginning on or after January 1, 2019, although early application is permitted.
Amended IFRS 9 – Prepayment Features with Negative Compensation
The amendments to IFRS 9 allow companies to measure particular prepayable financial assets with negative compensation at amortized cost or at fair value through other comprehensive income if a specified condition is met, instead of at fair value through profit or loss. The condition is that the financial asset would otherwise meet the criteria of having contractual cash flows that are solely payments of principal and interest but do not meet that condition only as a result of that prepayment feature.
The amendments will be applied to the accounting periods beginning on or after January 1, 2019, although early application is permitted.
Amended IAS 28 – Long-term Interests in Associates and Joint Ventures
The amendments to IAS 28 clarify that an entity is required to apply IFRS 9 to long term interests in an associate or joint venture that, in substance, form part of the net investment in the associate or joint venture but to which the equity method is not applied.
The amendments will be applied to the accounting periods beginning on or after January 1, 2019, although early application is permitted.
Annual improvements cycle to IFRSs 2015-2017
The annual improvements cycle to IFRSs 2015-2017 includes minor changes and clarifications to IFRS 3- Business Combinations, IFRS 11 – Joint Arrangements, IAS 12 – Income Taxes and IAS 23 – Borrowing Costs, which will be applied to the accounting periods beginning on or after January 1, 2019, although early application is permitted.
3. BBVA Group
The BBVA Group is an international diversified financial group with a significant presence in retail banking, wholesale banking, asset management and private banking. The Group also operates in other sectors such as insurance, real estate, operational leasing, etc.
Appendices I and II provide relevant information as of December 31, 2017 on the Group’s subsidiaries, consolidated structured entities, and investments in associate entities and joint venture entities. Appendix III shows the main changes in investments for the year ended December 31, 2017, and Appendix IV gives details of the consolidated subsidiaries which, are more than 10% owned by non-Group shareholders as of December 31, 2017.
The following table sets forth information related to the Group’s total assets as of December 31, 2017, 2016 and 2015, broken down by the Group’s entities according to their activity:
Contribution to Consolidated Group Total Assets. Entities by Main Activities (Millions of euros)
| 2017 | 2016 | 2015 | |
|---|---|---|---|
| Banks and other financial services | 659,414 | 699,592 | 717,981 |
| Insurance and pension fund managing companies | 26,134 | 26,831 | 25,741 |
| Other non-financial services | 4,511 | 5,433 | 6,133 |
| Total | 690,059 | 731,856 | 749,855 |
The total assets and results of operations broken down by the geographical areas, in which the BBVA Group operates, are included in Note 6.
The BBVA Group’s activities are mainly located in Spain, Mexico, South America, the United States and Turkey, with active presence in other countries, as shown below:
Main transactions in the Group in 2017
Investments
On February 21, 2017, BBVA Group entered into an agreement for the acquisition from Dogus Holding A.S. and Dogus Arastirma Gelistirme ve Musavirlik Hizmetleri A.S of 41,790,000,000 shares of Turkiye Garanti Bankasi, A.S. (“Garanti Bank”), amounting to 9.95% of the total issued share capital of Garanti Bank. On March 22, 2017, the sale and purchase agreement was completed, and therefore BBVA ́s total stake in Garanti Bank as of December 31, 2017 amounts to 49.85% (See Note 31).
Ongoing divestitures
Offer for the acquisition of BBVA’s stake in BBVA Chile
On November 28, 2017, BBVA received a binding offer from The Bank of Nova Scotia group (“Scotiabank”) for the acquisition, at a price of approximately USD 2,200 million of BBVA’s stake in Banco Bilbao Vizcaya Argentaria, Chile (“BBVA Chile”) as well as in other companies of the Group in Chile which operations are complementary to the banking business (amongst them, BBVA Seguros Vida, S.A.). BBVA owns, directly and indirectly, approximately 68.19% of BBVA Chile share capital. On December 5, 2017, BBVA accepted the Offer and entered into a sale and purchase agreement.
The Offer received does not include BBVA’s stake in the automobile financing companies of Forum group and in other Chilean entities from BBVA’s Group which are engaged in corporate activities of BBVA Group.
Completion of the transaction is subject to obtaining the relevant regulatory approvals.
Agreement for the creation of a “joint-venture” and transfer of the real estate business in Spain
On November 29, 2017, BBVA reached an agreement with a subsidiary of Cerberus Capital Management, L.P. (“Cerberus”) for the creation of a “joint venture” to which an important part of the real estate business of BBVA in Spain will be transferred (the “Business”). BBVA will contribute the Business to a single company (the “Company”) and will sell 80% of the shares of such Company to Cerberus at the closing date of the transaction.
The Business comprises: (i) foreclosed real estate assets (the “REOs”), with a gross book value of approximately €13,000 million, taking as starting point the situation of the REOs on June 26, 2017; and (ii) the necessary assets and employees to manage the Business in an autonomous manner. For the purpose of the agreement with Cerberus, the whole Business was valued at approximately €5,000 million.
Considering the valuation of the whole Business previously mentioned and assuming that all the Business’ REOs on June 26, 2017 will be contributed to the Company, the sale price for 80% of the shares would amount to approximately €4,000 million. The price finally paid will be determined by the volume of REOs effectively contributed that may vary depending on, among other matters, the sales carried out from the date of reference 26 June 2017 until the date of closing of the transaction and the fulfilment of the usual conditions in this kind of transactions.
The transaction as a whole is subject to obtaining the relevant authorizations from the competent authorities and it is not expected to have significant impact on the Consolidated Financial Statements when completed.
Main transaction in the Group in 2016
Mergers
The BBVA Group, at its Board of Directors meeting held on March 31, 2016, adopted a resolution to begin a merger process of BBVA S.A. (absorbing company), Catalunya Banc, S.A., Banco Depositario BBVA, S.A. y Unoe Bank, S.A.
This transaction was part of the corporate reorganization of its banking subsidiaries in Spain, was successfully completed throughout 2016 and has no impact in the Consolidated Financial Statements both from the accounting and the solvency stand points.
Main transactions in the Group in 2015
During 2015, the Group consolidated Garanti from the date of effective control (third quarter) and recorded the acquisition of Catalunya Banc (second quarter). These effects impact on the period-on-period comparison of all the income statements was affected with the previous first semester results.
Investments
Acquisition of an additional 14.89% of Garanti
On November 19, 2014, the Group signed a new agreement with Dogus Holding AS, Ferit Faik Sahenk, Dianne Sahenk and Defne Sahenk (hereinafter "Dogus") to, among other terms, the acquisition of 62,538,000,000 additional shares of Garanti (equivalent to 14.89% of the capital of this entity) for a maximum total consideration of 8.90 Turkish lira per batch (Garanti traded in batches of 100 shares each).
In the same agreement it stated that if the payment of dividends for the year 2014 was executed by Dogus before the closing of the acquisition, that amount would be deducted from the amount payable by BBVA. On April 27, 2015, Dogus received the amount of the dividend paid to shareholders of Garanti, which amounted to Turkish Liras 0.135 per batch.
On July 27, 2015, after obtaining all the required regulatory approvals, the Group materialized said participation increase after the acquisition of the new shares. As of December 31, 2015, the Group's interest in Garanti was 39.9%.
In accordance with the EU-IFRS accounting rules, and as a consequence of the agreements reached, the BBVA Group shall, at the date of effective control, measure at fair value its previously acquired stake of 25.01% in Garanti (classified as a joint venture accounted for using the equity method) and shall consolidate Garanti in the consolidated financial statements of the BBVA Group, beginning on the above-mentioned effective control date.
Measuring the above-mentioned stake in Garanti Bank at fair value resulted in a negative impact in “Gains or (-) losses on derecognition of non-financial assets and subsidiaries, net” in the consolidated income statement of the BBVA Group for the second semester of 2015, which resulted in a net negative impact in the Profit attributable to owners of the parent of the BBVA Group in 2015 amounting to €1,840 million. Such accounting impact does not translate into any additional cash outflow from BBVA. Most of this impact was generated by the exchange rate differences due to the depreciation of the TL against Euro since the initial acquisition by BBVA of the 25.01% stake in Garanti Bank up to the date of effective control. As of December 31, 2015, these exchange rate differences were already recorded as Other Comprehensive Income reducing the stock shareholder’s equity of the BBVA Group.
The agreements with the Dogus group included an agreement for the management of the bank and the appointment by the BBVA Group of the majority of the members of its Board of Directors (7 of 10). Garanti was consolidated in the BBVA Group, because of these management agreements.
The Group estimated according to the acquisition method, the fair values assigned to the assets acquired and the liabilities assumed from Garanti, along with the identified intangible assets, and cash payment made by the BBVA Group in consideration of the transaction was recorded under the heading "Intangible assets - Goodwill" in the accompanying consolidated balance sheets as of December 31, 2017 (see Note 18.1).
Acquisition of Catalunya Banc
On July 21, 2014, the Management Commission of the Banking Restructuring Fund (known as “FROB”) accepted BBVA ́s bid in the competitive auction for the acquisition of Catalunya Banc, S.A. (“Catalunya Banc”).
On April 24, 2015, once the necessary authorizations had been obtained and all the agreed conditions precedent have been fulfilled, BBVA announced that it acquired 1,947,166,809 shares of Catalunya Banc, S.A. (approximately 98.4% of its share capital) for a price of approximately €1,165 million.
According to the purchase method, the comparison between the fair values assigned to the assets acquired and the liabilities assumed from Catalunya Banc, and the cash payment made to the FROB in consideration of the transaction generated a difference of €26 million, which was recorded under the heading “Negative goodwill recognized in profit or loss” in the accompanying consolidated income statement for the year ended December 31, 2015. According to the IFRS 3, there is a period, up to a year, to complete the necessary adjustments to the calculation of initial acquisition (see Note 18.1). After the deadline, there has not been any significant adjustment that involves amending the calculation recorded in the year 2015.
Divestitures
Partial sale of China CITIC Bank Corporation Limited (CNCB)
On January 23, 2015 the BBVA Group signed an agreement to sell 4.9% in China CITIC Bank Corporation Limited (CNCB) to UBS AG, London Branch (UBS), who entered into transactions pursuant to which such CNCB shares will be transferred to a third party and the ultimate economic benefit of ownership of such CNCB shares will be transferred to Xinhu Zhongbao Co., Ltd (Xinhu) (the Relevant Transactions). On March 12, 2015, after having obtained the necessary approvals, BBVA completed the sale.
The selling price to UBS is HK$ 5.73 per share, amounting to a total of HK$ 13,136 million, equivalent to approximately €1,555 million (with an exchange rate of EUR/HK$=8.45 as of the date of the closing).
In addition to the above mentioned 4.9%, during the first semester of 2015 various sales were made in the market to total a 6.34% participation sale. The impact of these sales on the consolidated financial statements of the BBVA Group was a gain net of taxes of approximately €705 million. This gain gross of taxes was recognized under "Profit or loss from non-current assets and disposal groups classified as held for sale not qualifying as discontinued operations” in 2015 consolidated financial statements.
Sale of the participation in Citic International Financial Holding (CIFH)
On December 23, 2014, the BBVA Group signed an agreement to sell its participation of 29.68% in Citic International Financial Holdings Limited (hereinafter “CIFH”), to China CITIC Bank Corporation Limited (hereinafter “CNCB”). CIFH is a non-listed subsidiary of CNCB domiciled in Hong Kong. The selling price is HK$8,162 million.
On August 27, 2015, BBVA completed the sale of this participation. The impact on the consolidated financial statements of the BBVA Group was not significant.
4. Shareholder remuneration system
In accordance with BBVA’s shareholder remuneration policy communicated in October 2013, which established the distribution of an annual pay-out of between 35% and 40% of the profits earned in each year and the progressive reduction of the remuneration via “Dividend Options”, so that the shareholders’ remuneration would ultimately be fully in cash, on February 1, 2017 BBVA announced that it was expected to be proposed for the consideration of the competent governing bodies the approval of a capital increase to be charged to voluntary reserves for the instrumentation of one “Dividend Option” in 2017, being the subsequent shareholders’ remunerations that could be approved fully in cash.
This fully in cash shareholders’ remuneration policy would be composed, for each year, of a distribution on account of the dividend of such year (which is expected to be paid in October) and a final dividend (which would be paid once the year has ended and the profit allocation has been approved, which is expected for April), subject to the applicable authorizations by the competent governing bodies.
Shareholder remuneration scheme “Dividend Option”
During 2012, 2013, 2014, 2015, 2016 and 2017, the Group implemented a shareholder remuneration system referred to as “Dividend Option.
Under such remuneration scheme, BBVA offered its shareholders the possibility to receive all or part of their remuneration in the form of newly-issued BBVA ordinary shares, whilst maintaining the possibility for BBVA shareholders to receive their entire remuneration in cash by selling the rights of free allocation assigned either to BBVA (in execution of the commitment assumed by BBVA to acquire the rights of free allocation at a guaranteed fixed price) or by selling the rights of free allocation on the market at the prevailing market price at that time. However, the execution of the commitment assumed by BBVA was only available to whoever had been originally assigned such rights of free allocation and only in connection with the rights of free allocation initially allocated at such time.
On March 29, 2017, BBVA’s Board of Directors resolved to execute the capital increase to be charged to voluntary reserves approved by the Annual General Meeting (“AGM”) held on March 17, 2017, under agenda item three, to implement a “Dividend Option” this year. As a result of this increase, the Bank’s share capital increased by €49,622,955.62 through the issuance of 101,271,338 newly-issued BBVA ordinary shares at 0.49 euros par value, given that 83.28% of owners of the rights of free allocation opted to receive newly- issued BBVA ordinary shares. The remaining 16.72% of the owners of the rights of free allocation exercised the commitment assumed by BBVA, and as a result, BBVA acquired 1,097,962,903 rights (at a gross price of €0.131 each) for a total amount of €143,833,140.29. This amount is recorded in “Total Equity-Dividends and Remuneration” of the consolidated balance sheet as of December 31, 2017 (see Note 26).
On September, 28 2016, BBVA’s Board of Directors resolved to execute the second of the share capital increases to be charged to voluntary reserves, as agreed by the AGM held on March 11, 2016. As a result of this increase, the Bank’s share capital increased by €42,266,085.33 through the issuance of 86,257,317 newly-issued BBVA ordinary shares at 0.49 euros par value, given that 87.85% of owners of the rights of free allocation opted to receive newly-issued BBVA ordinary shares. The remaining 12.15% of the owners of the rights of free allocation exercised the commitment assumed by BBVA, and as a result, BBVA acquired 787,374,942 rights (at a gross price of €0.08 each) for a total amount of €62,989,995.36. This amount is recorded in “Total Equity-Dividends and Remuneration” of the consolidated balance sheet as of December 31, 2016 (see Note 26).
On March 31, 2016, BBVA’s Board of Directors resolved to execute the first of the share capital increases to be charged to voluntary reserves, as agreed by the AGM held on March 11, 2016 for the implementation of the shareholder remuneration system called the “Dividend Option”. As a result of this increase, the Bank’s share capital increased by €55,702,125.43 through the issuance of 113,677,807 newly-issued BBVA ordinary shares at a €0.49 par value, given that 82.13% of owners of the rights of free allocation opted to receive newly-issued BBVA ordinary shares. The remaining 17.87% of the owners of the rights of free allocation exercised the commitment assumed by BBVA, and as a result, BBVA acquired 1,137,500,965 rights (at a gross price of €0.129 each) for a total amount of €146,737,624.49. This amount is recorded in “Total Equity- Dividends and Remuneration” of the consolidated balance sheet as of December 31, 2016 (see Note 26).
Cash Dividends
Throughout 2016 and 2017, BBVA’s Board of Directors approved the payment of the following interim dividends, recorded in “Total Equity- Interim Dividends” of the consolidated balance sheet of the relevant year:
The interim accounting statements prepared in accordance with legal requirements evidencing the existence of sufficient liquidity for the distribution of said amounts are as follows:
Available Amount for Interim Dividend Payments (Millions of euros)
| August 31, 2017 | |
|---|---|
| Profit of BBVA, S.A. at each of the dates indicated, after the provision for income tax | 1,832 |
| Less | |
| Estimated provision for Legal Reserve | 10 |
| Acquisition by the bank of the free allotment rights in 2017 capital increase | 144 |
| Additional Tier I capital instruments remuneration | 224 |
| Interim dividends for 2017 already paid | - |
| Maximum amount distributable | 1,454 |
| Amount of proposed interim dividend | 600 |
| BBVA cash balance available to the date | 5,095 |
Proposal on allocation of earnings for 2017
The allocation of earnings for 2017 subject to the approval of the Board of Directors at the Annual Shareholders Meeting is presented below:
Allocation of Earnings (Millions of euros)
| 2017 | |
|---|---|
| Profit for year (*) | 2,083 |
| Distribution: | |
| Interim dividends | 600 |
| Final dividend | 1,000 |
| Acquisition by the bank of the free allotment rights (**) | 144 |
| Additional Tier 1 securities | 301 |
| Legal reserve | 10 |
| Voluntary reserves | 28 |
5. Earnings per share
Basic and diluted earnings per share are calculated in accordance with the criteria established by IAS 33. For more information see Glossary of terms.
The Bank issued additional share capital in 2017, 2016 and 2015 (see Note 26). In accordance with IAS 33, when there is a capital increase, earnings per share, basic and diluted, should be recalculated for previous periods applying a corrective factor to the denominator (the weighted average number of shares outstanding) This corrective factor is the result of dividing the fair value per share immediately before the exercise of rights by the theoretical ex-rights fair value per share. The basic and diluted earnings per share for 2016 were recalculated on this basis.
The calculation of earnings per share is as follows:
Basic and Diluted Earnings per Share
| 2017 | 2016 (*) | 2015 (*) | |
|---|---|---|---|
| Numerator for basic and diluted earnings per share (millions of euros) | |||
| Profit attributable to parent company | 3,519 | 3,475 | 2,642 |
| Adjustment: Additional Tier 1 securities (1) | (301) | (260) | (212) |
| Profit adjusted (millions of euros) (A) | 3,218 | 3,215 | 2,430 |
| Profit from discontinued operations (net of non-controlling interest) (B) | - | - | - |
| Denominator for basic earnings per share (number of shares outstanding) | - | - | - |
| Weighted average number of shares outstanding (2) | 6,642 | 6,468 | 6,290 |
| Weighted average number of shares outstanding x corrective factor (3) | 6,642 | 6,592 | 6,647 |
| Adjusted number of shares - Basic earning per share (C) | 6,642 | 6,592 | 6,647 |
| Adjusted number of shares - diluted earning per share (D) | 6,642 | 6,592 | 6,647 |
| Earnings per share | 0.48 | 0.49 | 0.37 |
| Basic earnings per share from continued operations (Euros per share)A-B/C | 0.48 | 0.49 | 0.37 |
| Diluted earnings per share from continued operations (Euros per share)A-B/D | 0.48 | 0.49 | 0.37 |
| Basic earnings per share from discontinued operations (Euros per share)B/C | - | - | - |
| Diluted earnings per share from discontinued operations (Euros per share)B/D | - | - | - |
As of December 31, 2017, 2016 and 2015, there were no other financial instruments or share option commitments to employees that could potentially affect the calculation of the diluted earnings per share for the years presented. For this reason, basic and diluted earnings per share are the same for both dates.
6. Operating segment reporting
The information about operating segments is presented in accordance with IFRS 8. Operating segment reporting represents a basic tool in the oversight and management of the BBVA Group’s various activities. The BBVA Group compiles reporting information on disaggregated business activities. These business activities are then aggregated in accordance with the organizational structure determined by the BBVA Group and, ultimately, into the reportable operating segments themselves.
During 2017, there have not been significant changes in the reporting structure of the operating segments of the BBVA Group compared to the structure existing at the end of 2016. The structure of the operating segment is as follows:
Lastly, the Corporate Center is comprised of the rest of the assets and liabilities that have not been allocated to the operating segments. It includes: the costs of the head offices that have a corporate function; management of structural exchange-rate positions; specific issues of capital instruments to ensure adequate management of the Group’s global solvency; portfolios and their corresponding results, whose management is not linked to customer relations, such as industrial holdings; certain tax assets and liabilities; funds due to commitments with employees; goodwill and other intangibles.
The breakdown of the BBVA Group’s total assets by operating segments as of December 31, 2017, 2016 and 2015, is as follows:
Total Assets by Operating Segments (Millions of euros)
| 2017 | 2016 (1) | 2015 (1) | |
|---|---|---|---|
| Banking Activity in Spain | 319,417 | 335,847 | 343,793 |
| Non Core Real Estate | 9,714 | 13,713 | 17,122 |
| United States | 80,493 | 88,902 | 86,454 |
| Mexico | 89,344 | 93,318 | 99,591 |
| Turkey | 78,694 | 84,866 | 89,003 |
| South America | 74,636 | 77,918 | 70,657 |
| Rest of Eurasia | 17,265 | 19,106 | 19,579 |
| Subtotal Assets by Operating Segments | 669,563 | 713,670 | 726,199 |
| Corporate Center | 20,496 | 18,186 | 23,656 |
| Total Assets BBVA Group | 690,059 | 731,856 | 749,855 |
The attributable profit and main earning figures in the consolidated income statements for the years ended December 31, 2017, 2016 and 2015 by operating segments are as follows:
Main Margins and Profits by Operating Segments (Millions of euros)
| Operating Segments | |||||||||||
|---|---|---|---|---|---|---|---|---|---|---|---|
| BBVA Group | Spain | Non Core Real Estate | United Sates | Mexico | Turkey | South America | Rest of Eurasia | Corporate Center | Adjustments (2) | ||
| 2017 | Notes | ||||||||||
| Net interest income | 17,758 | 3,738 | 71 | 2,158 | 5,437 | 3,331 | 3,200 | 180 | (357) | - | |
| Gross income | 25,270 | 6,180 | (17) | 2,919 | 7,080 | 4,115 | 4,451 | 468 | 73 | - | |
| Operating profit /(loss) before tax | 6,931 | 1,866 | (673) | 784 | 2,948 | 2,147 | 1,691 | 177 | (2,009) | - | |
| Profit | 55.2 | 3,519 | 1,381 | (501) | 511 | 2,162 | 826 | 861 | 125 | (1,844) | |
| 2016 (1) | |||||||||||
| Net interest income | 17,059 | 3,877 | 60 | 1,953 | 5,126 | 3,404 | 2,930 | 166 | (455) | - | |
| Gross income | 24,653 | 6,416 | (6) | 2,706 | 6,766 | 4,257 | 4,054 | 491 | (31) | - | |
| Operating profit /(loss) before tax | 6,392 | 1,268 | (743) | 612 | 2,678 | 1,906 | 1,552 | 203 | (1,084) | - | |
| Profit | 55.2 | 3,475 | 905 | (595) | 459 | 1,980 | 599 | 771 | 151 | (794) | |
| 2015 (1) | |||||||||||
| Net interest income | 16,022 | 4,015 | 71 | 1,811 | 5,387 | 2,194 | 3,202 | 176 | (432) | (404) | |
| Gross income | 23,362 | 6,803 | (28) | 2,631 | 7,081 | 2,434 | 4,477 | 465 | (183) | (318) | |
| Operating profit /(loss) before tax | 4,603 | 1,540 | (716) | 685 | 2,772 | 853 | 1,814 | 103 | (1,172) | (1,276) | |
| Profit | 55.2 | 2,642 | 1,080 | (496) | 517 | 2,094 | 371 | 905 | 70 | (1,899) | |
The accompanying Consolidated Management Report presents the consolidated income statements and the balance sheets by operating segments in more detail.
7. Risk management
7.1 General risk management and control model
The BBVA Group has an overall risk management and control model (hereinafter 'the model') tailored to its business model, its organization and the geographies in which it operates. This model allows BBVA Group to develop its activity in accordance with the risk strategy and risk controls and management policies defined by the governing bodies of the Bank and to adapt to a changing economic and regulatory environment, tackling risk management globally and adapted to the circumstances at all times. The model establishes a system of appropriate risk management regarding risk profile and strategy of the Group.
This model is applied comprehensively in the Group and consists of the basic elements listed below:
The Group promotes the development of a risk culture that ensures consistent application of the risk management and control model in the Group, and that guarantees that the risk function is understood and assimilated at all levels of the organization.
7.1.1 Governance and organization
BBVA Group ́s risk governance model is characterized by a special involvement of its corporate bodies, both in setting the risk strategy and in the ongoing monitoring and supervision of its implementation.
Thus, as developed below, the corporate bodies are the ones that approve this risk strategy and corporate policies for the different types of risk. The risk function is responsible at management level for their implementation and development, and reporting to the governing bodies.
The responsibility for the daily management of the risks lies on the businesses which abide in the development of their activity to meet the policies, rules, procedures, infrastructures and controls, which are defined by the function risk on the basis of the framework set by the governing bodies.
To perform this task properly, the risk function in the BBVA Group is configured as a single, global function with an independent role from commercial areas.
Corporate bodies
BBVA Board of Directors (hereinafter also referred to as "the Board") approves the risk strategy and oversees the internal management and control systems. Specifically, in relation to the risk strategy, the Board approves the Group's risk appetite statement, the core metrics and the main metrics by type of risk, as well as the general risk management and control model.
The Board of Directors is also responsible for approving and monitoring the strategic and business plan, the annual budget and management goals, as well as the investment and funding policy, in a consistent way and in line with the approved Risk Appetite Framework. For this reason, the processes for defining the Risk Appetite Framework proposals and the strategic and budgetary planning at Group level are coordinated by the executive areas for submission to the Board.
With the aim of ensuring the integration of the Risk Appetite Framework into management, on the basis established by the Board of Directors, the Executive Committee approves the remaining metrics by type of risk (in 2017 those in relation to concentration, profitability and reputational risk) and the Group's basic structure of limits by geographical area, risk type, asset type and portfolio level. This committee also approves specific corporate policies for each type of risk.
Lastly, the Board has set up a Board committee specialized in risks, the Risk Committee, that assists the Board and the Executive Committee in determining the Group's risk strategy and the risk limits and policies, respectively, analyzing and assessing beforehand the proposals submitted to those bodies. The Board of Directors has the exclusive authority to amend the Group’s risk strategy and its elements, including the Risk Appetite Framework metrics within its scope of decision, while the Executive Committee is responsible for amending the metrics by type of risk within its scope of decision and the Group's basic structure of limits (core limits), when applicable. In both cases, the amendments follow the same decision-making process described above, so the proposals for amendment are submitted by the executive area (Chief Risk Officer, “CRO”) and analyzed by the Risk Committee, for later submission to the Board of Directors or to the Executive Committee, as appropriate.
Moreover, the Risk Committee, the Executive Committee and the Board itself conduct proper monitoring of the risk strategy implementation and of the Group's risk profile. The risk function regularly reports on the development of the Group's Risk Appetite Framework metrics to the Board and to the Executive Committee, after the analysis by the Risk Committee, whose role in this monitoring and control work is particularly relevant.
Risk Function: CRO. Organizational structure and committees
The head of the risk function at executive level is the Group’s CRO, who carries out his functions independently and with the necessary authority, rank, experience, knowledge and resources. He is appointed by the Board as a member of its senior management and has direct access to its corporate bodies (Board, Executive Standing Committee and Risk Committee), to whom he reports regularly on the status of risks in the Group.
The CRO, for a better performance of its functions, is supported in the performance of its functions by a structure consisting of cross-sectional risk units in the corporate area and the specific risk units in the geographical and/or business areas of the Group. Each of the latter units is headed by a Chief Risk Officer for the geographical and/or business area who, within his/her area of responsibility, carries out risk management and control functions and is responsible for applying the corporate policies and rules approved at Group level in a consistent manner, adapting them if necessary to local requirements and reporting to the local corporate bodies.
The Chief Risk Officers of the geographical and/or business areas report both to the Group's CRO and to the head of their geographical and/or business area. This dual reporting system aims to ensure that the local risk management function is independent from the operating functions and enable its alignment with the Group's corporate risk policies and goals.
As explained above, the risk management function consists of risk units from the corporate area, which carry out cross-sectional functions, and risk units from the geographical and/or business areas.
The local risk units thus work with the corporate area risk units in order to adapt to the risk strategy at Group level and share all the information necessary for monitoring the development of their risks.
The risk function has a decision-making process to perform its functions, underpinned by a structure of committees, where the Global Risk Management Committee (GRMC) acts as the top-level committee within the risk function. It proposes, examines and, where applicable, approves, among others, the internal risk regulatory framework and the procedures and infrastructures needed to identify, assess, measure and manage the material risks faced by the Group in carrying out its business, and the determination of risk limits by portfolio. The members of this Committee are the Group's CRO and the heads of the risk units of the corporate area and of the most representative geographical and/or business areas.
The GRMC carries out its functions assisted by various support committees which include:
Each geographical and/or business area has its own risk management committee (or committees), with objectives and contents similar to those of the corporate area, which perform their duties consistently and in line with corporate risk policies and rules, whose decisions are reflected in the corresponding minutes.
Under this organizational scheme, the risk management function ensures the risk strategy, the regulatory framework, and standardized risk infrastructures and controls are integrated and applied across the entire Group. It also benefits from the knowledge and proximity to customers in each geographical and/or business area, and transmits the corporate risk culture to the Group's different levels. Moreover, this organization enables the risks function to conduct and report to the corporate bodies integrated monitoring and control of the entire Group's risks.
Internal Risk Control and Internal Validation
The Group has a specific Internal Risk Control unit. Its main function is to ensure there is an adequate internal regulatory framework, a process and measures defined for each type of risk identified in the Group (and for those other types of risk that may potentially affect the Group). It controls their application and operation, as well as ensuring the integration of the risk strategy into the Group's management. In this regard, the Internal Risk Control unit verifies the performance of their duties by the units that develop the risk models, manage the processes and execute the controls. Its scope of action is global, from the geographical point of view and the type of risks.
The Group's Head of Internal Risk Control is responsible for the function and reports on its activities and informs of its work plans to the CRO and to the Board's Risk Committee, assisting it in any matters where requested. For these purposes the Internal Risk Control department has a Technical Secretary's Office, which offers the Committee the technical support it needs to better perform its duties.
In addition, the Group has an Internal Validation unit, which reviews the performance of its duties by the units that develop the risk models and of those that use them in management. Its functions include review and independent validation at internal level of the models used for management and control of risks in the Group.
7.1.2 Risk Appetite Framework
The Group's Risk Appetite Framework, approved by the corporate bodies, determines the risks (and their level) that the Group is willing to assume to achieve its business objectives considering an organic evolution of its business. These are expressed in terms of solvency, profitability, liquidity and funding, or other metrics, which are reviewed periodically as well as in case of material changes to the entity’s business or relevant corporate transactions. The definition of the risk appetite has the following goals:
Risk appetite framework is expressed through the following elements:
Risk Appetite Statement
It sets out the general principles of the Group's risk strategy and the target risk profile. The 2017 Group’s Risk appetite statement is:
BBVA Group’s risk policy is designed to achieve a moderate risk profile for the entity, through: prudent management and a responsible universal banking business model targeted to value creation, risk-adjusted return and recurrence of results; diversified by geography, asset class, portfolio and clients; and with presence in emerging and developed countries, maintaining a medium/low risk profile in every country, and focusing on a long term relationship with the client.
Core metrics
Based on the risk appetite statement, statements are established to set down the general risk management principles in terms of solvency, liquidity and funding, profitability and income recurrence.
The core metrics define, in quantitative terms, the principles and the target risk profile set out in the risk appetite statement and are in line with the strategy of the Group. Each metric has three thresholds (traffic- light approach) ranging from a standard business management to higher deterioration levels: Management reference, Maximum appetite and Maximum capacity. The 2017 Group’s Core metrics are:
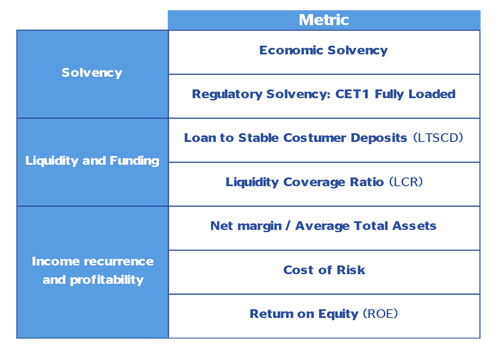
By type of risk metrics
Based on the core metrics, statements are established for each type of risk reflecting the main principles governing the management of that risk and several metrics are calibrated, compliance with which enables compliance with the core metrics and the risk appetite statement of the Group. By type of risk metrics have a maximum appetite threshold.
Basic limits structure (core limits)
The purpose of the basic limits structure or core limits is to shape the Risk Appetite Framework at geographical area risk type, asset type and portfolio level, ensuring that the management of risks on an ongoing basis is within the thresholds set forth for "by type of risk".
In addition to this framework, there’s a level of management limits level that is defined and managed by the risk function developing the core limits, in order to ensure that the anticipatory management of risks by subcategories or by subportfolios complies with that core limits and, in general, with the Risk Appetite Framework.
The following graphic summarizes the structure of BBVA’s Risk Appetite Framework:
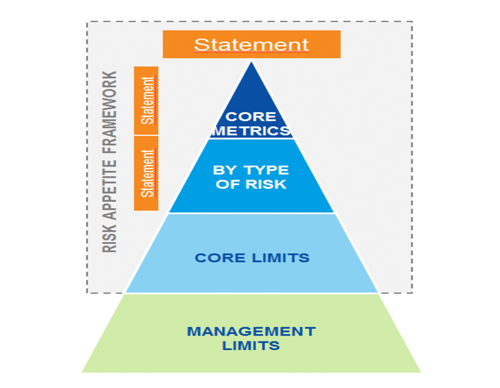
The corporate risk area works with the various geographical and/or business areas to define their risk appetite framework, which will be coordinated with and integrated into the Group's risk appetite to ensure that its profile fits as defined.
The Group Risk Appetite Framework expresses the levels and types of risk that the Bank is willing to assume to be able to implement its strategic plan with no relevant deviations, even in situations of stress. The Risk Appetite Framework is integrated into the management and the processes for defining the Risk Appetite Framework proposals and strategic and budgetary planning at Group level are coordinates.
As explained above, the core metrics of BBVA Risk Appetite Framework measure Groups performance in terms of solvency, liquidity and funding, profitability and income recurrence; most of the core metrics are accounting related or regulatory metrics which are published regularly to the market in the BBVA Group annual report and in the quarterly financial reports. During 2017, the Group risk profile evolved in line with the Risk Appetite metrics.
7.1.3 Decisions and processes
The transfer of risk appetite framework to ordinary management is supported by three basic aspects:
Standardized regulatory framework
The corporate risk area is responsible for the definition and proposal of the corporate policies, specific rules, procedures and schemes of delegation based on which risk decisions should be taken within the Group.
This process aims for the following objectives:
The approval of corporate policies for all types of risks corresponds to the corporate bodies of the Bank, while the corporate risk area endorses the remaining regulations.
Risk units of geographical and / or business areas comply with this set of regulations and, where necessary, adapt it to local requirements for the purpose of having a decision process that is appropriate at local level and aligned with the Group policies. If such adaptation is necessary, the local risk area must inform the corporate area of GRM, who must ensure the consistency of the regulatory body at the Group level and, therefore, if necessary, give prior approval to the modifications proposed by the local risk areas.
Risk planning
Risk planning ensures that the risk appetite framework is integrated into management through a cascade process for establishing limits and profitability adjusted to the risk profile, in which the function of the corporate area risk units and the geographical and/or business areas is to guarantee the alignment of this process with the Group's Risk Appetite Framework in terms of solvency, liquidity and funding, profitability and income recurrence.
There are tools in place that allow the Risk Appetite Framework defined at aggregate level to be assigned and monitored by business areas, legal entities, types of risk, concentrations and any other level considered necessary.
The risk planning process is aligned and taken into consideration within the rest of the Group's planning framework so as to ensure consistency.
Comprehensive management
All risks must be managed comprehensively during their life cycle, and be treated differently depending on the type.
The risk management cycle is composed of five elements:
7.1.4 Assessment, monitoring and reporting
Assessment, monitoring and reporting is a cross-cutting element that ensure the Model has a dynamic and proactive vision to enable compliance with the risk appetite framework approved by the corporate bodies, even in adverse scenarios. The materialization of this process has the following objectives:
This process is integrated in the activity of the risk units, both of the corporate area and in the business units, and it is carried out during the following phases:
7.1.5 Infrastructure
The infrastructure is an element that must ensure that the Group has the human and technological resources needed for effective management and supervision of risks in order to carry out the functions set out in the Group's risk Model and the achievement of their objectives.
With respect to human resources, the Group risk function has an adequate workforce, in terms of number, skills, knowledge and experience.
With regards to technology, the Group risk function ensures the integrity of management information systems and the provision of the infrastructure needed for supporting risk management, including tools appropriate to the needs arising from the different types of risks for their admission, management, assessment and monitoring.
The principles that govern the Group risk technology are:
Through the “Risk Analytics” function, the Group has a corporate framework in place for developing the measurement techniques and models. It covers all the types of risks and the different purposes and uses a standard language for all the activities and geographical/business areas and decentralized execution to make the most of the Group's global reach. The aim is to continually evolve the existing risk models and generate others that cover the new areas of the businesses that develop them, so as to reinforce the anticipation and proactiveness that characterize the Group's risk function.
Also the risk units of geographical and / or business areas have sufficient means from the point of view of resources, structures and tools to develop a risk management in line with the corporate model.
7.1.6 Risk culture
The Group promotes the development of a risk culture that ensure consistent application of the risk management and control model in the Group, and that guarantees that the risk function is understood and internalized at all levels of the organization.
The culture transfers the implications that are involved in the Group's activities and businesses to all the levels of the organization. The risk culture is organized through a number of levers, including the following:
7.2 Risk factors
As mentioned earlier, BBVA has processes in place for identifying risks and analyzing scenarios that enable the Group to manage risks in a dynamic and proactive way.
The risk identification processes are forward looking to ensure the identification of emerging risks and take into account the concerns of both the business areas, which are close to the reality of the different geographical areas, and the corporate areas and senior management.
Risks are captured and measured consistently using the methodologies deemed appropriate in each case. Their measurement includes the design and application of scenario analyses and stress testing and considers the controls to which the risks are subjected.
As part of this process, a forward projection of the risk appetite framework variables in stress scenarios is conducted in order to identify possible deviations from the established thresholds. If any such deviations are detected, appropriate measures are taken to keep the variables within the target risk profile.
To this extent, there are a number of emerging risks that could affect the Group’s business trends. These risks are described in the following main blocks:
7.3 Credit risk
Credit risk arises from the probability that one party to a financial instrument will fail to meet its contractual obligations for reasons of insolvency or inability to pay and cause a financial loss for the other party.
It is the most important risk for the Group and includes counterparty risk, issuer risk, settlement risk and country risk management.
The principles underpinning credit risk management in BBVA are as follows:
Credit risk management in the Group has an integrated structure for all its functions, allowing decisions to be taken objectively and independently throughout the life cycle of the risk.
Retail risks: in general, the decisions are formalized according to the scoring tools, within the general framework for action of each business area with regard to risks. The changes in weighting and variables of these tools must be validated by the corporate GRM area.
Wholesale risks: in general, the decisions are formalized by each business area within its general framework for action with regard to risks, which incorporates the delegation rule and the Group's corporate policies.
7.3.1 Credit risk exposure
In accordance with IFRS 7 “Financial Instruments: Disclosures”, the BBVA Group’s maximum credit risk exposure (see definition below) by headings in the balance sheets as of December 31, 2017, 2016 and 2015 is provided below. It does not consider the availability of collateral or other credit enhancements to guarantee compliance with payment obligations. The details are broken down by financial instruments and counterparties.
Maximum Credit Risk Exposure (Millions of euros)
| Notes | 2017 | 2016 | 2015 | |
|---|---|---|---|---|
| Financial assets held for trading | 29,430 | 31,995 | 37,424 | |
| Debt securities | 10.1 | 22,573 | 27,166 | 32,825 |
| Government | 20,716 | 24,165 | 29,454 | |
| Credit institutions | 816 | 1,652 | 1,765 | |
| Other sectors | 1,041 | 1,349 | 1,606 | |
| Equity instruments | 10.1 | 6,801 | 4,675 | 4,534 |
| Loans and advances to customers | 56 | 154 | 65 | |
| Other financial assets designated at fair value through profit or loss | 11 | 2,709 | 2,062 | 2,311 |
| Loans and advances to customers | 648 | - | 62 | |
| Debt securities | 174 | 142 | 173 | |
| Government | 93 | 84 | 132 | |
| Credit institutions | 63 | 47 | 29 | |
| Other sectors | 18 | 11 | 11 | |
| Equity instruments | 1,888 | 1,920 | 2,075 | |
| Available-for-sale financial assets | 70,761 | 79,553 | 113,710 | |
| Debt securities | 12.1 | 66,273 | 74,739 | 108,448 |
| Government | 53,378 | 55,047 | 81,579 | |
| Credit institutions | 3,902 | 5,011 | 8,069 | |
| Other sectors | 8,993 | 14,682 | 18,800 | |
| Equity instruments | 12.1 | 4,488 | 4,814 | 5,262 |
| Loans and receivables | 444,320 | 482,011 | 490,580 | |
| Loans and advances to central banks | 13.2 | 7,300 | 8,894 | 17,830 |
| Loans and advances to credit institutions | 13.2 | 26,297 | 31,416 | 29,368 |
| Loans and advances to customers | 13.3 | 400,369 | 430,474 | 432,856 |
| Government | 32,525 | 34,873 | 38,611 | |
| Agriculture | 3,876 | 4,312 | 4,315 | |
| Industry | 52,026 | 57,072 | 56,913 | |
| Real estate and construction | 29,671 | 37,002 | 38,964 | |
| Trade and finance | 47,951 | 47,045 | 43,576 | |
| Loans to individuals | 172,868 | 192,281 | 194,288 | |
| Other | 61,452 | 57,889 | 56,188 | |
| Debt securities | 13.4 | 10,354 | 11,226 | 10,526 |
| Government | 4,412 | 4,709 | 3,275 | |
| Credit institutions | 31 | 37 | 125 | |
| Other sectors | 5,911 | 6,481 | 7,126 | |
| Held-to-maturity investments | 13,765 | 17,710 | - | |
| Government | 12,620 | 16,049 | - | |
| Credit institutions | 1,056 | 1,515 | - | |
| Other sectors | 89 | 146 | - | Derivatives (trading and hedging) | 10.4 - 15 | 45,628 | 54,122 | 49,350 |
| TOTAL FINANCIAL ASSETS RISK | 606,613 | 667,454 | 693,375 | |
| Loan commitments given | 33 | 94,268 | 107,254 | 123,620 |
| Financial guarantees given | 33 | 16,545 | 18,267 | 19,176 |
| Other Commitments given | 33 | 45,738 | 42,592 | 42,813 |
| Total Maximum Credit Exposure | 763,165 | 835,567 | 878,984 |
The maximum credit exposure presented in the table above is determined by type of financial asset as explained below:
The first factor, fair value, reflects the difference between original commitments and fair values on the reporting date (mark-to-market). As indicated in Note 2.2.1, derivatives are accounted for as of each reporting date at fair value in accordance with IAS 39.
The second factor, potential risk (‘add-on’), is an estimate of the maximum increase to be expected on risk exposure over a derivative fair value (at a given statistical confidence level) as a result of future changes in the fair value over the remaining term of the derivatives.
The consideration of the potential risk ("add-on") relates the risk exposure to the exposure level at the time of a customer’s default. The exposure level will depend on the customer’s credit quality and the type of transaction with such customer. Given the fact that default is an uncertain event which might occur any time during the life of a contract, the BBVA Group has to consider not only the credit exposure of the derivatives on the reporting date, but also the potential changes in exposure during the life of the contract. This is especially important for derivatives, whose valuation changes substantially throughout their terms, depending on the fluctuation of market prices.
The breakdown by counterparty and product of loans and advances, net of impairment losses, classified in the different headings of the assets, as of December 31, 2017, 2016 and 2015 is shown below:
December 2017 (Millions of euros)
| Central banks | General governments | Credit institutions | Other financial corporations | Non-financial corporations | Households | Total | |
|---|---|---|---|---|---|---|---|
| On demand and short notice | - | 222 | - | 270 | 7,663 | 2,405 | 10,560 |
| Credit card debt | - | 6 | - | 3 | 1,862 | 13,964 | 15,835 |
| Trade receivables | 1,624 | - | 497 | 20,385 | 198 | 22,705 | |
| Finance leases | - | 205 | - | 36 | 8,040 | 361 | 8,642 |
| Reverse repurchase loans | 305 | 1,290 | 13,793 | 10,912 | - | - | 26,300 |
| Other term loans | 6,993 | 26,983 | 4,463 | 5,763 | 125,228 | 155,418 | 324,848 |
| Advances that are not loans | 2 | 1,964 | 8,005 | 1,044 | 1,459 | 522 | 12,995 |
| Loans and advances | 7,301 | 32,294 | 26,261 | 18,525 | 164,637 | 172,868 | 421,886 |
| of which: mortgage loans [Loans collateralized by immovable property] | 998 | - | 308 | 37,353 | 116,938 | 155,597 | |
| of which: other collateralized loans | 7,167 | 13,501 | 12,907 | 24,100 | 9,092 | 66,767 | |
| of which: credit for consumption | 40,705 | 40,705 | |||||
| of which: lending for house purchase | 114,709 | 114,709 | |||||
| of which: project finance loans | 16,412 | 16,412 |
December 2016 (Millions of euros)
| Central banks | General governments | Credit institutions | Other financial corporations | Non-financial corporations | Households | Total | |
|---|---|---|---|---|---|---|---|
| On demand and short notice | - | 373 | - | 246 | 8,125 | 2,507 | 11,251 |
| Credit card debt | - | 1 | - | 1 | 1,875 | 14,719 | 16,596 |
| Trade receivables | 2,091 | - | 998 | 20,246 | 418 | 23,753 | |
| Finance leases | - | 261 | - | 57 | 8,647 | 477 | 9,442 |
| Reverse repurchase loans | 81 | 544 | 15,597 | 6,746 | - | - | 22,968 |
| Other term loans | 8,814 | 29,140 | 7,694 | 6,878 | 136,105 | 167,892 | 356,524 |
| Advances that are not loans | - | 2,410 | 8,083 | 2,082 | 1,194 | 620 | 14,389 |
| Loans and advances | 8,894 | 34,820 | 31,373 | 17,009 | 176,192 | 186,633 | 454,921 |
| of which: mortgage loans [Loans collateralized by immovable property] | 4,722 | 112 | 690 | 44,406 | 132,398 | 182,328 | |
| of which: other collateralized loans | 3,700 | 15,191 | 8,164 | 21,863 | 6,061 | 54,979 | |
| of which: credit for consumption | 44,504 | 44,504 | |||||
| of which: lending for house purchase | 127,606 | 127,606 | |||||
| of which: project finance loans | 19,269 | 19,269 |
December 2015 (Millions of euros)
| Central banks | General governments | Credit institutions | Other financial corporations | Non-financial corporations | Households | Total | |
|---|---|---|---|---|---|---|---|
| On demand and short notice | - | 783 | - | 38 | 8,356 | 2,050 | 11,228 |
| Credit card debt | - | 1 | - | 2 | 1,892 | 15,057 | 16,952 |
| Trade receivables | 3,055 | - | 800 | 19,605 | 411 | 23,871 | |
| Finance leases | - | 301 | - | 420 | 7,534 | 1,103 | 9,357 |
| Reverse repurchase loans | 149 | 326 | 11,676 | 4,717 | 9 | - | 16,877 |
| Other term loans | 10,017 | 31,971 | 8,990 | 5,968 | 134,952 | 168,729 | 360,626 |
| Advances that are not loans | 7,664 | 2,108 | 8,713 | 2,261 | 919 | 863 | 22,528 |
| Loans and advances | 17,830 | 38,544 | 29,379 | 14,206 | 173,267 | 188,213 | 461,438 |
| of which: mortgage loans [Loans collateralized by immovable property] | 4,483 | 264 | 656 | 43,961 | 135,102 | 184,466 | |
| of which: other collateralized loans | 3,868 | 12,434 | 6,085 | 22,928 | 6,131 | 51,446 | |
| of which: credit for consumption | 40,906 | 40,906 | |||||
| of which: lending for house purchase | 126,591 | 126,591 | |||||
| of which: project finance loans | 21,141 | 21,141 |
7.3.2 Mitigation of credit risk, collateralized credit risk and other credit enhancements
In most cases, maximum credit risk exposure is reduced by collateral, credit enhancements and other actions which mitigate the Group’s exposure. The BBVA Group applies a credit risk hedging and mitigation policy deriving from a banking approach focused on relationship banking. The existence of guarantees could be a necessary but not sufficient instrument for accepting risks, as the assumption of risks by the Group requires prior evaluation of the debtor’s capacity for repayment, or that the debtor can generate sufficient resources to allow the amortization of the risk incurred under the agreed terms.
The policy of accepting risks is therefore organized into three different levels in the BBVA Group:
The procedures for the management and valuation of collateral are set out in the Corporate Policies (retail and wholesale), which establish the basic principles for credit risk management, including the management of collaterals assigned in transactions with customers.
The methods used to value the collateral are in line with the best market practices and imply the use of appraisal of real-estate collateral, the market price in market securities, the trading price of shares in mutual funds, etc. All the collaterals assigned must be properly drawn up and entered in the corresponding register. They must also have the approval of the Group’s legal units.
The following is a description of the main types of collateral for each financial instrument class:
Collateralized loans granted by the Group as of December 31, 2017, 2016 and 2015 excluding balances deemed impaired, is broken down in Note 13.2.
7.3.3 Credit quality of financial assets that are neither past due nor impaired
The BBVA Group has tools (“scoring” and “rating”) that enable it to rank the credit quality of its operations and customers based on an assessment and its correspondence with the probability of default (“PD”) scales. To analyze the performance of PD, the Group has a series of tracking tools and historical databases that collect the pertinent internally generated information, which can basically be grouped together into scoring and rating models.
Scoring
Scoring is a decision-making model that contributes to both the arrangement and management of retail loans: consumer loans, mortgages, credit cards for individuals, etc. Scoring is the tool used to decide to originate a loan, what amount should be originated and what strategies can help establish the price, because it is an algorithm that sorts transactions by their credit quality. This algorithm enables the BBVA Group to assign a score to each transaction requested by a customer, on the basis of a series of objective characteristics that have statistically been shown to discriminate between the quality and risk of this type of transactions. The advantage of scoring lies in its simplicity and homogeneity: all that is needed is a series of objective data for each customer, and this data is analyzed automatically using an algorithm.
There are three types of scoring, based on the information used and on its purpose:
Rating
Rating tools, as opposed to scoring tools, do not assess transactions but focus on the rating of customers instead: companies, corporations, SMEs, general governments, etc. A rating tool is an instrument that, based on a detailed financial study, helps determine a customer’s ability to meet his/her financial obligations. The final rating is usually a combination of various factors: on one hand, quantitative factors, and on the other hand, qualitative factors. It is a middle road between an individual analysis and a statistical analysis.
The main difference between ratings and scorings is that the latter are used to assess retail products, while ratings use a wholesale banking customer approach. Moreover, scorings only include objective variables, while ratings add qualitative information. And although both are based on statistical studies, adding a business view, rating tools give more weight to the business criterion compared to scoring tools.
For portfolios where the number of defaults is low (sovereign risk, corporates, financial entities, etc.) the internal information is supplemented by “benchmarking” of the external rating agencies (Moody’s, Standard & Poor’s and Fitch). To this end, each year the PDs compiled by the rating agencies at each level of risk rating are compared, and the measurements compiled by the various agencies are mapped against those of the BBVA master rating scale.
Once the probability of default of a transaction or customer has been calculated, a "business cycle adjustment" is carried out. This is a means of establishing a measure of risk that goes beyond the time of its calculation. The aim is to capture representative information of the behavior of portfolios over a complete economic cycle. This probability is linked to the Master Rating Scale prepared by the BBVA Group to enable uniform classification of the Group’s various asset risk portfolios.
The table below shows the abridged scale used to classify the BBVA Group’s outstanding risk as of December 31, 2017:
| External rating | Internal rating | Probability of default (basic points) | ||
|---|---|---|---|---|
| Standard&Poor's List | Reduced List (22 groups) | Average | Minimum from >= | Maximum |
| AAA | AAA | 1 | - | 2 |
| AA+ | AA+ | 2 | 2 | 3 |
| AA | AA | 3 | 3 | 4 |
| AA- | AA- | 4 | 4 | 5 |
| A+ | A+ | 5 | 5 | 6 |
| A | A | 8 | 6 | 9 |
| A- | A- | 10 | 9 | 11 |
| BBB+ | BBB+ | 14 | 11 | 17 |
| BBB | BBB | 20 | 17 | 24 |
| BBB- | BBB- | 31 | 24 | 39 |
| BB+ | BB+ | 51 | 39 | 67 |
| BB | BB | 88 | 67 | 116 |
| BB- | BB- | 150 | 116 | 194 |
| B+ | B+ | 255 | 194 | 335 |
| B | B | 441 | 335 | 581 |
| B- | B- | 785 | 581 | 1,061 |
| CCC+ | CCC+ | 1,191 | 1,061 | 1,336 |
| CCC | CCC | 1,500 | 1,336 | 1,684 |
| CCC- | CCC- | 1,890 | 1,684 | 2,121 |
| CC+ | CC+ | 2,381 | 2,121 | 2,673 |
| CC | CC | 3,000 | 2,673 | 3,367 |
| CC- | CC- | 3,780 | 3,367 | 4,243 |
These different levels and their probability of default were calculated by using as a reference the rating scales and default rates provided by the external agencies Standard & Poor’s and Moody’s. These calculations establish the levels of probability of default for the BBVA Group’s Master Rating Scale. Although this scale is common to the entire Group, the calibrations (mapping scores to PD sections/Master Rating Scale levels) are carried out at tool level for each country in which the Group has tools available.
The table below outlines the distribution of exposure, including derivatives, by internal ratings, to corporates, financial entities and institutions (excluding sovereign risk), of BBVA, S.A., Bancomer, Garanti Bank, Compass and subsidiaries in Spain as of December 31, 2017, 2016 and 2015:
| December 2017 | December 2016 | December 2015 | ||||
|---|---|---|---|---|---|---|
| Credit Risk Distribution by Internal Rating | Amount (Millions of Euros) | % | Amount (Millions of Euros) | % | Amount (Millions of Euros) | % |
| AAA/AA+/AA/AA- | 38,124 | 12.04% | 35,430 | 11.84% | 27,913 | 9.17% |
| A+/A/A- | 68,638 | 21.68% | 58,702 | 19.62% | 62,798 | 20.64% |
| BBB+ | 40,626 | 12.83% | 43,962 | 14.69% | 43,432 | 14.27% |
| BBB | 28,194 | 8.90% | 27,388 | 9.15% | 28,612 | 9.40% |
| BBB- | 51,845 | 16.37% | 41,713 | 13.94% | 40,821 | 13.41% |
| BB+ | 29,088 | 9.19% | 32,694 | 10.92% | 28,355 | 9.32% |
| BB | 17,009 | 5.37% | 19,653 | 6.57% | 23,008 | 7.56% |
| BB- | 15,656 | 4.94% | 13,664 | 4.57% | 12,548 | 4.12% |
| B+ | 11,180 | 3.53% | 10,366 | 3.46% | 8,597 | 2.83% |
| B | 9,101 | 2.87% | 4,857 | 1.62% | 5,731 | 1.88% |
| B- | 2,962 | 0.94% | 3,687 | 1.23% | 3,998 | 1.31% |
| CCC/CC | 4,223 | 1.33% | 7,149 | 2.39% | 18,488 | 6.08% |
| Total | 316.649 | 100.00% | 299.264 | 100.00% | 304.300 | 100.00% |
7.3.4 Past due but not impaired and impaired secured loans risks
The table below provides details by counterpart and by product of past due risks but not considered to be impaired, as of December 31, 2017, 2016 and 2015, listed by their first past-due date; as well as the breakdown of the debt securities and loans and advances individually and collectively estimated, and the specific allowances for individually estimated and for collectively estimated (see Note 2.2.1):
December 2017 (Millions of euros)
| Past due but not impaired | Impaired assets | Carrying amount of the impaired assets | Specific allowances for financial assets, individually and collectively estimated | Collective allowances for incurred but not reported losses | Accumulated write-offs | |||
|---|---|---|---|---|---|---|---|---|
| ≤ 30 days | > 30 days ≤ 60 days | > 60 days ≤ 90 days | ||||||
| Debt securities | - | - | - | 66 | 38 | (28) | (21) | - |
| Loans and advances | 3,432 | 759 | 503 | 19,401 | 10,726 | (8,675) | (4,109) | (29,938) |
| Central banks | - | - | - | - | - | - | - | - |
| General governments | 75 | 3 | 13 | 171 | 129 | (42) | (69) | (27) |
| Credit institutions | - | - | - | 11 | 5 | (6) | (30) | (5) |
| Other financial corporations | 2 | - | - | 12 | 6 | (7) | (19) | (5) |
| Non-financial corporations | 843 | 153 | 170 | 10,791 | 5,192 | (5,599) | (1,939) | (18,988) |
| Households | 2,512 | 603 | 319 | 8,417 | 5,395 | (3,022) | (2,052) | (10,913) |
| TOTAL | 3,432 | 759 | 503 | 19,467 | 10,764 | (8,703) | (4,130) | (29,938) |
| Loans and advances by product, by collateral and by subordination | ||||||||
| On demand (call) and short notice (current account) | 77 | 12 | 11 | 389 | 151 | (238) | ||
| Credit card debt | 397 | 66 | 118 | 629 | 190 | (439) | ||
| Trade receivables | 115 | 8 | 9 | 515 | 179 | (336) | ||
| Finance leases | 138 | 66 | 47 | 431 | 155 | (276) | ||
| Reverse repurchase loans | - | - | - | - | - | - | ||
| Other term loans | 2,705 | 606 | 317 | 17,417 | 10,047 | (7,370) | ||
| Advances that are not loans | 1 | - | 1 | 20 | 3 | (16) | ||
| of which: mortgage loans (Loans collateralized by immovable property) | 1.345 | 360 | 164 | 11.388 | 7.630 | (3.757) | ||
| of which: other collateralized loans | 592 | 137 | 43 | 803 | 493 | (310) | ||
| of which: credit for consumption | 1.260 | 248 | 207 | 1.551 | 457 | (1.093) | ||
| of which: lending for house purchase | 1.034 | 307 | 107 | 5.730 | 4.444 | (1.286) | ||
| of which: project finance loans | 13 | - | 25 | 1.165 | 895 | (271) | ||
December 2016 (Millions of euros)
| Past due but not impaired | Impaired assets | Carrying amount of the impaired assets | Specific allowances for financial assets, individually and collectively estimated | Collective allowances for incurred but not reported losses | Accumulated write-offs | |||
|---|---|---|---|---|---|---|---|---|
| ≤ 30 days | > 30 days ≤ 60 day | > 60 days ≤ 90 days | ||||||
| Debt securities | - | - | - | 272 | 128 | (144) | (46) | (1) |
| Loans and advances | 3,384 | 696 | 735 | 22,925 | 12,133 | (10,793) | (5,224) | (29,346) |
| Central banks | - | - | - | - | - | - | - | - |
| General governments | 66 | - | 2 | 295 | 256 | (39) | (13) | (13) |
| Credit institutions | 3 | - | 82 | 10 | 3 | (7) | (36) | (5) |
| Other financial corporations | 4 | 7 | 21 | 34 | 8 | (25) | (57) | (6) |
| Non-financial corporations | 968 | 209 | 204 | 13,786 | 6,383 | (7,402) | (2,789) | (18,020) |
| Households | 2,343 | 479 | 426 | 8,801 | 5,483 | (3,319) | (2,329) | (11,303) |
| TOTAL | 3,384 | 696 | 735 | 23,197 | 12,261 | (10,937) | (5,270) | (29,347) |
| Loans and advances by product, by collateral and by subordination | ||||||||
| On demand (call) and short notice (current account) | 79 | 15 | 29 | 562 | 249 | (313) | ||
| Credit card debt | 377 | 88 | 124 | 643 | 114 | (529) | ||
| Trade receivables | 51 | 15 | 13 | 424 | 87 | (337) | ||
| Finance leases | 188 | 107 | 59 | 516 | 252 | (264) | ||
| Reverse repurchase loans | - | - | 82 | 1 | - | (1) | ||
| Other term loans | 2,685 | 469 | 407 | 20,765 | 11,429 | (9,336) | ||
| Advances that are not loans | 5 | - | 21 | 14 | 2 | (12) | ||
| of which: mortgage loans (Loans collateralized by immovable property) | 1,202 | 265 | 254 | 16,526 | 9,008 | (5,850) | ||
| of which: other collateralized loans | 593 | 124 | 47 | 1,129 | 656 | (275) | ||
| of which: credit for consumption | 1,186 | 227 | 269 | 1,622 | 455 | (1,168) | ||
| of which: lending for house purchase | 883 | 194 | 105 | 6,094 | 4,546 | (1,548) | ||
| of which: project finance loans | 138 | - | - | 253 | 105 | (147) | ||
December 2015 (Millions of euros)
| Past due but not impaired | Impaired assets | Carrying amount of the impaired assets | Specific allowances for financial assets, individually and collectively estimated | Collective allowances for incurred but not reported losses | Accumulated write-offs | |||
|---|---|---|---|---|---|---|---|---|
| ≤ 30 days | > 30 days ≤ 60 days | > > 60 days ≤ 90 days | ||||||
| Debt securities | - | - | - | 81 | 46 | (35) | (113) | - |
| Loans and advance | 3,445 | 825 | 404 | 25,358 | 12,527 | (12,831) | (5,911) | (26,143) |
| Central banks | - | - | - | - | - | - | - | - |
| General governments | 154 | 278 | 2 | 194 | 157 | (37) | (30) | (19) |
| Credit institutions | - | - | - | 25 | 9 | (17) | (34) | (5) |
| Other financial corporations | 7 | 1 | 14 | 67 | 29 | (38) | (124) | (5) |
| Non-financial corporations | 838 | 148 | 48 | 16,254 | 7,029 | (9,225) | (3,096) | (15,372) |
| Households | 2,446 | 399 | 340 | 8,817 | 5,303 | (3,514) | (2,626) | (10,743) |
| TOTAL | 3,445 | 825 | 404 | 25,439 | 12,573 | (12,866) | (6,024) | (26,143) |
| Loans and advances by product, by collateral and by subordination | ||||||||
| On demand (call) and short notice (current account) | 134 | 13 | 7 | 634 | 204 | (430) | ||
| Credit card debt | 389 | 74 | 126 | 689 | 161 | (528) | ||
| Trade receivables | 98 | 26 | 22 | 628 | 179 | (449) | ||
| Finance leases | 136 | 29 | 21 | 529 | 222 | (307) | ||
| Reverse repurchase loans | 1 | - | - | 1 | 1 | (1) | ||
| Other term loans | 2,685 | 682 | 227 | 22,764 | 11,747 | (11,017) | ||
| Advances that are not loans | 2 | - | - | 113 | 13 | (99) | ||
| of which: mortgage loans (Loans collateralized by immovable property) | 1,342 | 266 | 106 | 16,526 | 9,767 | (6,877) | ||
| of which: other collateralized loans | 589 | 102 | 27 | 1,129 | 809 | (339) | ||
| of which: credit for consumption | 957 | 164 | 220 | 1,543 | 404 | (1,139) | ||
| of which: lending for house purchase | 616 | 174 | 110 | 5,918 | 4,303 | (1,615) | ||
| of which: project finance loans | 3 | - | 1 | 276 | 66 | (211) | ||
The breakdown of loans and advances of loans and receivables, impaired and accumulated impairment by sectors as of December 31, 2017, 2016 and 2015 is as follows:
December 2017 (Millions of euros)
| Non-performing | Accumulated impairment or Accumulated changes in fair value due to credit risk | Nonperforming loans and advances as a % of the total | |
|---|---|---|---|
| General governments | 171 | (111) | 0.5% |
| Credit institutions | 11 | (36) | - |
| Other financial corporations | 12 | (26) | 0.1% |
| Non-financial corporations | 10,791 | (7,538) | 6.3% |
| Agriculture, forestry and fishing | 166 | (123) | 4.3% |
| Mining and quarrying | 177 | (123) | 3.7% |
| Manufacturing | 1,239 | (955) | 3.6% |
| Electricity, gas, steam and air conditioning supply | 213 | (289) | 1.8% |
| Water supply | 29 | (11) | 4.5% |
| Construction | 2,993 | (1,708) | 20.1% |
| Wholesale and retail trade | 1,706 | (1,230) | 5.9% |
| Transport and storage | 441 | (353) | 4.2% |
| Accommodation and food service activities | 362 | (222) | 4.3% |
| Information and communication | 984 | (256) | 17.0% |
| Real estate activities | 1,171 | (1,100) | 7.9% |
| Professional, scientific and technical activities | 252 | (183) | 3.8% |
| Administrative and support service activities | 188 | (130) | 6.3% |
| Public administration and defense, compulsory social security | 4 | (6) | 1.9% |
| Education | 31 | (25) | 3.4% |
| Human health services and social work activities | 75 | (68) | 1.7% |
| Arts, entertainment and recreation | 69 | (38) | 4.6% |
| Other services | 690 | (716) | 4.3% |
| Households | 8,417 | (5,073) | 4.7% |
| LOANS AND ADVANCES | 19,401 | (12,784) | 4.5% |
December 2016 (Millions of euros)
| Non-performing | Accumulated impairment or Accumulated changes in fair value due to credit risk | Nonperforming loans and advances as a % of the total | |
|---|---|---|---|
| General governments | 295 | (52) | 0.8% |
| Credit institutions | 10 | (42) | - |
| Other financial corporations | 34 | (82) | 0.2% |
| Non-financial corporations | 13,786 | (10,192) | 7.4% |
| Agriculture, forestry and fishing | 221 | (188) | 5.1% |
| Mining and quarrying | 126 | (83) | 3.3% |
| Manufacturing | 1,569 | (1,201) | 4.5% |
| Electricity, gas, steam and air conditioning supply | 569 | (402) | 3.2% |
| Water supply | 29 | (10) | 3.5% |
| Construction | 5,358 | (3,162) | 26.3% |
| Wholesale and retail trade | 1,857 | (1,418) | 6.2% |
| Transport and storage | 442 | (501) | 4.5% |
| Accommodation and food service activities | 499 | (273) | 5.9% |
| Information and communication | 112 | (110) | 2.2% |
| Real estate activities | 1,441 | (1,074) | 8.7% |
| Professional, scientific and technical activities | 442 | (380) | 6.0% |
| Administrative and support service activities | 182 | (107) | 7.3% |
| Public administration and defense, compulsory social security | 18 | (25) | 3.0% |
| Education | 58 | (31) | 5.4% |
| Human health services and social work activities | 89 | (88) | 1.8% |
| Arts, entertainment and recreation | 84 | (51) | 5.1% |
| Other services | 691 | (1,088) | 4.2% |
| Households | 8,801 | (5,648) | 4.6% |
| LOANS AND ADVANCES | 22,925 | (16,016) | 5.0% |
December 2015 (Millions of euros)
| Non-performing | Accumulated impairment or Accumulated changes in fair value due to credit risk | Nonperforming loans and advances as a % of the total | |
|---|---|---|---|
| General governments | 194 | (67) | 0.5% |
| Credit institutions | 25 | (51) | 0.1% |
| Other financial corporations | 67 | (162) | 0.5% |
| Non-financial corporations | 16,254 | (12,321) | 8.8% |
| Agriculture. forestry and fishing | 231 | (180) | 5.4% |
| Mining and quarrying | 192 | (114) | 4.7% |
| Manufacturing | 1,947 | (1,729) | 5.8% |
| Electricity, gas, steam and air conditioning supply | 250 | (395) | 1.4% |
| Water supply | 44 | (23) | 5.2% |
| Construction | 6,585 | (4,469) | 30.1% |
| Wholesale and retail trade | 1,829 | (1,386) | 6.3% |
| Transport and storage | 616 | (607) | 6.4% |
| Accommodation and food service activities | 567 | (347) | 7.0% |
| Information and communication | 110 | (100) | 2.3% |
| Real estate activities | 1,547 | (1,194) | 9.1% |
| Professional, scientific and technical activities | 944 | (454) | 12.8% |
| Administrative and support service activities | 224 | (148) | 6.9% |
| Public administration and defense, compulsory social security | 18 | (25) | 2.8% |
| Education | 26 | (19) | 2.6% |
| Human health services and social work activities | 82 | (91) | 1.8% |
| Arts, entertainment and recreation | 100 | (63) | 6.6% |
| Other services | 942 | (977) | 6.1% |
| Households | 8,817 | (6,140) | 4.5% |
| LOANS AND ADVANCES | 25,358 | (18,742) | 5.5% |
The changes during the years 2017, 2016 and 2015 of impaired financial assets and contingent risks are as follow:
Changes in Impaired Financial Assets and Contingent Risks (Millions of euros)
| 2017 | 2016 | 2015 | |
|---|---|---|---|
| Balance at the beginning | 23,877 | 26,103 | 23,234 |
| Additions | 10,856 | 11,133 | 14,872 |
| Decreases (*) | (7,771) | (7,633) | (6,720) |
| Net additions | 3,085 | 3,500 | 8,152 |
| Amounts written-off | (5,758) | (5,592) | (4,989) |
| Exchange differences and other | (615) | (134) | (295) |
| Balance at the end | 20,590 | 23,877 | 26,103 |
The changes during the years 2017, 2016 and 2015 in financial assets derecognized from the accompanying consolidated balance sheet as their recovery is considered unlikely (hereinafter "write-offs"), is shown below:
Changes in Impaired Financial Assets Written-Off from the Balance Sheet (Millions of Euros)
| Notes | 2017 | 2016 | 2015 | |
|---|---|---|---|---|
| Balance at the beginning | 29,347 | 26,143 | 23,583 | |
| Acquisition of subsidiaries in the year | - | - | 1,362 | |
| Increase: | 5,986 | 5,699 | 6,172 | |
| Decrease: | (4,442) | (2,384) | (4,830) | |
| Re-financing or restructuring | (9) | (32) | (28) | |
| Cash recovery | 47 | (558) | (541) | (490) |
| Foreclosed assets | (149) | (210) | (159) | |
| Sales of written-off | (2,284) | (45) | (54) | |
| Debt forgiveness | (1,121) | (864) | (3,119) | |
| Time-barred debt and other causes | (321) | (692) | (980) | |
| Net exchange differences | (752) | (111) | (144) | |
| Balance at the end | 30,139 | 29,347 | 26,143 |
As indicated in Note 2.2.1, although they have been derecognized from the consolidated balance sheet, the BBVA Group continues to attempt to collect on these written-off financial assets, until the rights to receive them are fully extinguished, either because it is time-barred financial asset, the financial asset is condoned, or other reasons.
7.3.5 Impairment losses
Below are the changes in the years ended December 31, 2017, 2016 and 2015, in the provisions recognized on the accompanying consolidated balance sheets to cover estimated impairment losses in loans and advances and debt securities, according to the different headings under which they are classified in the accompanying consolidated balance sheet:
December 2017 (Millions of euros)
| Opening balance | Increases due to amounts set aside for estimated loan losses during the period | Decreases due to amounts reversed for estimated loan losses during the period | Decreases due to amounts taken against allowances | Transfers between allowances | Other adjustments | Closing balance | Recoveries recorded directly to the statement of profit or loss | |
|---|---|---|---|---|---|---|---|---|
| Equity instruments | ||||||||
| Specific allowances for financial assets, individually and collectively estimated | (10,937) | (7,484) | 2,878 | 4,503 | 1,810 | 526 | (8,703) | 558 |
| Debt securities | (144) | (26) | 6 | - | 123 | 13 | (28) | - |
| Central banks | - | - | - | - | - | - | - | - |
| General governments | - | - | - | - | - | - | - | - |
| Credit institutions | (15) | (5) | 4 | - | 16 | - | - | - |
| Other financial corporations | (26) | (4) | 2 | - | - | 13 | (16) | - |
| Non-financial corporations | (103) | (17) | - | - | 107 | - | (12) | - |
| Loans and advances | (10,793) | (7,458) | 2,872 | 4,503 | 1,687 | 513 | (8,675) | 558 |
| Central banks | - | - | - | - | - | - | - | - |
| General governments | (39) | (70) | 37 | 14 | 1 | 15 | (42) | 1 |
| Credit institutions | (7) | (2) | 2 | - | - | 1 | (6) | - |
| Other financial corporations | (25) | (287) | 3 | 38 | 227 | 38 | (7) | - |
| Non-financial corporations | (7,402) | (3,627) | 1,993 | 3,029 | (228) | 636 | (5,599) | 345 |
| Households | (3,319) | (3,472) | 837 | 1,422 | 1,687 | (177) | (3,022) | 212 |
| Collective allowances for incurred but not reported losses on financial assets | (5,270) | 1,783 | 2,159 | 1,537 | (1,328) | 557 | (4,130) | - |
| Debt securities | (46) | (8) | 30 | 1 | - | 3 | (21) | - |
| Loans and advances | (5,224) | (1,776) | 2,128 | 1,536 | (1,328) | 554 | (4,109) | - |
| Total | (16,206) | (9,267) | 5,037 | 6,038 | 482 | 1,083 | (12,833) | 558 |
December 2016 (Millions of euros)
| Opening balance | Increases due to amounts set aside for estimated loan losses during the period | Decreases due to amounts reversed for estimated loan losses during the period | Decreases due to amounts taken against allowances | Transfers between allowances | Other adjustments | Closing balance | Recoveries recorded directly to the statement of profit or loss | |
|---|---|---|---|---|---|---|---|---|
| Equity instruments | ||||||||
| Specific allowances for financial assets, individually and collectively estimated | (12,866) | (6,912) | 2,708 | 5,673 | (123) | 583 | (10,937) | 540 |
| Debt securities | (35) | (167) | 6 | 64 | (10) | (2) | (144) | - |
| Central banks | - | - | - | - | - | - | - | - |
| General governments | - | - | - | - | - | - | - | - |
| Credit institutions | (20) | - | - | 5 | - | - | (15) | - |
| Other financial corporations | (15) | (29) | 3 | 26 | (10) | (1) | (26) | - |
| Non-financial corporations | - | (138) | 3 | 33 | - | (1) | (103) | - |
| Loans and advances | (12,831) | (6,745) | 2,702 | 5,610 | (113) | 585 | (10,793) | 540 |
| Central banks | - | - | - | - | - | - | - | - |
| General governments | (37) | (2) | 20 | 6 | (27) | 2 | (39) | 1 |
| Credit institutions | (17) | (2) | 3 | - | 10 | (3) | (7) | - |
| Other financial corporations | (38) | (34) | 9 | 22 | 10 | 6 | (25) | - |
| Non-financial corporations | (9,225) | (3,705) | 2,158 | 3,257 | (278) | 391 | (7,402) | 335 |
| Households | (3,514) | (3,002) | 511 | 2,325 | 172 | 189 | (3,319) | 205 |
| Collective allowances for incurred but not reported losses on financial assets | (6,024) | (1,558) | 1,463 | 88 | 775 | (15) | (5,270) | 1 |
| Debt securities | (113) | (11) | 15 | 1 | 64 | - | (46) | - |
| Loans and advances | (5,911) | (1,546) | 1,449 | 87 | 711 | (15) | (5,224) | - |
| Total | (18,890) | (8,470) | 4,172 | 5,762 | 652 | 568 | (16,206) | 541 |
December 2015 (Millions of euros)
| Opening balance | Increases due to amounts set aside for estimated loan losses during the period | Decreases due to amounts reversed for estimated loan losses during the period | Decreases due to amounts taken against allowance | Transfers between allowances | Other adjustments | Closing balance | Recoveries recorded directly to the statement of profit or loss | |
|---|---|---|---|---|---|---|---|---|
| Equity instruments | ||||||||
| Specific allowances for financial assets, individually and collectively estimated | (10,519) | (6,172) | 1,435 | 5,162 | 388 | (3,160) | (12,866) | 490 |
| Debt securities | (33) | (6) | 8 | - | - | (3) | (35) | - |
| Central banks | - | - | - | - | - | - | - | - |
| General governments | - | - | - | - | - | - | - | - |
| Credit institutions | (17) | (2) | 1 | - | (1) | - | (20) | - |
| Other financial corporations | (16) | (4) | 7 | - | 1 | (3) | (15) | - |
| Non-financial corporations | - | - | - | - | - | - | - | - |
| Loans and advances | (10,487) | (6,166) | 1,427 | 5,162 | 388 | (3,156) | (12,831) | 490 |
| Central banks | - | - | - | - | - | - | - | - |
| General governments | (24) | (16) | 17 | 3 | (12) | (6) | (37) | - |
| Credit institutions | (18) | (11) | 5 | - | 9 | (2) | (17) | 1 |
| Other financial corporations | (21) | (276) | 2 | 23 | 231 | 3 | (38) | - |
| Non-financial corporations | (7,610) | (3,229) | 1,169 | 2,580 | (298) | (1,837) | (9,225) | 301 |
| Households | (2,814) | (2,635) | 234 | 2,555 | 459 | (1,313) | (3,514) | 187 |
| Collective allowances for incurred but not reported losses on financial assets | (3,829) | (578) | 576 | 110 | (486) | (1,817) | (6,024) | - |
| Debt securities | (42) | (9) | 6 | - | (67) | (1) | (113) | - |
| Loans and advances | (3,787) | (569) | 570 | 110 | (420) | (1,816) | (5,911) | - |
| Total | (14,348) | (6,750) | 2,011 | 5,272 | (98) | (4,977) | (18,890) | 490 |
7.3.6 Refinancing and restructuring operations
Group policies and principles with respect to refinancing and restructuring operations
Refinancing and restructuring operations (see definition in the Glossary) are carried out with customers who have requested such an operation in order to meet their current loan payments if they are expected, or may be expected, to experience financial difficulty in making the payments in the future.
The basic aim of a refinancing and restructuring operation is to provide the customer with a situation of financial viability over time by adapting repayment of the loan incurred with the Group to the customer’s new situation of fund generation. The use of refinancing and restructuring for other purposes, such as to delay loss recognition, is contrary to BBVA Group policies.
The BBVA Group’s refinancing and restructuring policies are based on the following general principles:
These general principles are adapted in each case according to the conditions and circumstances of each geographical area in which the Group operates, and to the different types of customers involved.
In the case of retail customers (private individuals), the main aim of the BBVA Group’s policy on refinancing and restructuring loan is to avoid default arising from a customer’s temporary liquidity problems by implementing structural solutions that do not increase the balance of customer’s loan. The solution required is adapted to each case and the loan repayment is made easier, in accordance with the following principles:
In the case of non-retail customers (mainly companies, enterprises and corporates), refinancing/restructuring is authorized according to an economic and financial viability plan based on:
In accordance with the Group’s policy, the conclusion of a loan refinancing and restructuring operation does not meet the loan is reclassified from "impaired" or "standard under special monitoring" to outstanding risk. The reclassification to the "standard under special monitoring" or normal risk categories must be based on the analysis mentioned earlier of the viability, upon completion of the probationary periods described below.
The Group maintains the policy of including risks related to refinanced and restructured loans as either:
The conditions established for assets classified as “standard under special monitoring” to be reclassified out of this category are as follows:
The BBVA Group’s refinancing and restructuring policy provides for the possibility of two modifications in a 24 month period for loans that are not in compliance with the payment schedule.
The internal models used to determine allowances for loan losses consider the restructuring and renegotiation of a loan, as well as re-defaults on such a loan, by assigning a lower internal rating to restructured and renegotiated loans than the average internal rating assigned to non- restructured/renegotiated loans. This downgrade results in an increase in the probability of default (PD) assigned to restructured/renegotiated loans (with the resulting PD being higher than the average PD of the non- renegotiated loans in the same portfolios).
For quantitative information on refinancing and restructuring operations see Appendix XII.
7.4 Market risk
7.4.1 Market risk trading portfolios
Market risk originates as a result of movements in the market variables that impact the valuation of traded financial products and assets. The main risks generated can be classified as follows:
The metrics developed to control and monitor market risk in BBVA Group are aligned with market practices and are implemented consistently across all the local market risk units.
Measurement procedures are established in terms of the possible impact of negative market conditions on the trading portfolio of the Group's Global Markets units, both under ordinary circumstances and in situations of heightened risk factors.
The standard metric used to measure market risk is Value at Risk (“VaR”), which indicates the maximum loss that may occur in the portfolios at a given confidence level (99%) and time horizon (one day). This statistic value is widely used in the market and has the advantage of summing up in a single metric the risks inherent to trading activity, taking into account how they are related and providing a prediction of the loss that the trading book could sustain as a result of fluctuations in equity prices, interest rates, foreign exchange rates and credit spreads. The market risk analysis considers risks, such as credit spread, basis risk, volatility and correlation risk.
Most of the headings on the Group's balance sheet subject to market risk are positions whose main metric for measuring their market risk is VaR. This table shows the accounting lines of the consolidated balance sheet as of December 31, 2017, 2016 and 2015 in which there is a market risk in trading activity subject to this measurement:
Headings of the balance sheet under market risk (Millions of euros)
| December 2017 | December 2016 | December 2015 | ||||
|---|---|---|---|---|---|---|
| Main market risk metrics - VaR | Main market risk metrics - Others(*) | Main market risk metrics - VaR | Main market risk metrics - Others(*) | Main market risk metrics - VaR | Main market risk metrics - Others(*) | |
| Assets subject to market risk | ||||||
| Financial assets held for trading | 59,008 | 441 | 64,623 | 1,480 | 64,370 | 4,712 |
| Available for sale financial assets | 5,661 | 24,083 | 7,119 | 28,771 | 8,234 | 50,088 |
| Of which: Equity instruments | - | 2,404 | - | 3,559 | - | 4,067 |
| Derivatives - Hedging accounting | 829 | 1,397 | 1,041 | 1,415 | 528 | 1,888 |
| Liabilities subject to market risk | ||||||
| Financial liabilities held for trading | 42,468 | 2,526 | 47,491 | 2,223 | 42,550 | 6,277 |
| Derivatives - Hedging accounting | 1,157 | 638 | 1,305 | 689 | 1,128 | 806 |
Although the prior table shows details the financial positions subject to market risk, it should be noted that the data are for information purposes only and do not reflect how the risk is managed in trading activity, where it is not classified into assets and liabilities.
With respect to the risk measurement models used in BBVA Group, the Bank of Spain has authorized the use of the internal model to determine bank capital requirements deriving from risk positions on the BBVA S.A. and BBVA Bancomer trading book, which jointly account for around 70% and 66% of the Group’s trading- book market risk as of December 31, 2017 and 2016. For the rest of the geographical areas (mainly South America, Garanti and BBVA Compass), bank capital for the risk positions in the trading book is calculated using the standard model.
The current management structure includes the monitoring of market-risk limits, consisting of a scheme of limits based on VaR, economic capital (based on VaR measurements) and VaR sub-limits, as well as stop- loss limits for each of the Group’s business units.
The model used estimates VaR in accordance with the "historical simulation" methodology, which involves estimating losses and gains that would have taken place in the current portfolio if the changes in market conditions that took place over a specific period of time in the past were repeated. Based on this information, it infers the maximum expected loss of the current portfolio within a given confidence level. This model has the advantage of reflecting precisely the historical distribution of the market variables and not assuming any specific distribution of probability. The historical period used in this model is two years. The historical simulation method is used in BBVA S.A., BBVA Bancomer, BBVA Chile, BBVA Colombia, Compass Bank and Garanti.
VaR figures are estimated following two methodologies:
In the case of South America (except BBVA Chile and BBVA Colombia), a parametric methodology is used to measure risk in terms of VaR.
At the same time, and following the guidelines established by the Spanish and European authorities, BBVA incorporates metrics in addition to VaR with the aim of meeting the Bank of Spain's regulatory requirements with respect to the calculation of bank capital for the trading book. Specifically, the new measures incorporated in the Group since December 2011 (stipulated by Basel 2.5) are:
Validity tests are performed regularly on the risk measurement models used by the Group. They estimate the maximum loss that could have been incurred in the positions with a certain level of probability (backtesting), as well as measurements of the impact of extreme market events on risk positions (stress testing). As an additional control measure, backtesting is conducted at trading desk level in order to enable more specific monitoring of the validity of the measurement models.
Market risk in 2017
The Group’s market risk remains at low levels compared with the risk aggregates managed by BBVA, particularly in terms of credit risk. This is due to the nature of the business. During year ended December 31, 2017 the average VaR was €27 million, below the figure of 2016, with a high on January 11, 2017 of €34 million. The evolution in the BBVA Group’s market risk during 2017, measured as VaR without smoothing (see Glossary) with a 99% confidence level and a 1-day horizon (shown in millions of Euros) is as follows:
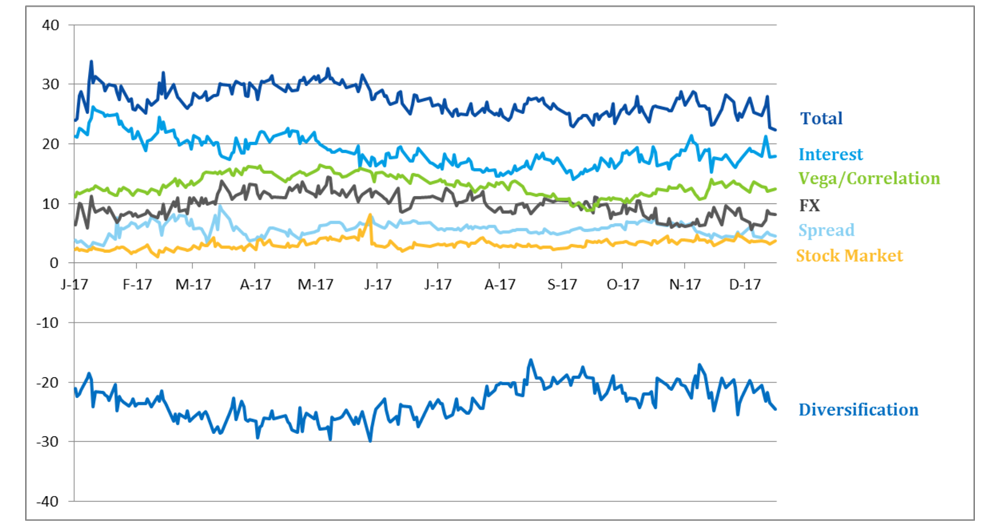
By type of market risk assumed by the Group's trading portfolio, the main risk factor for the Group continues to be that linked to interest rates, with a weight of 48% of the total at the end of year ended December 31, 2017 (this figure includes the spread risk). The relative weight has decreased compared with the close of 2016 (58%). Exchange-rate risk accounts 14%, increasing its proportion with respect to December 2016 (13%), while equity, volatility and correlation risk have increased, with a weight of 38% at the close of 2017 (vs. 29% at the close of 2016).
As of December 31, 2017, 2016 and 2015 the balance of VaR was €22 million, €26 million and €24 million, respectively. These figures can be broken down as follows:
VaR by Risk Factor (Millions of euros)
| Interest/Spread Risk | Currency Risk | Stock-market Risk | Vega/CorrelationRisk | Diversification Effect(*) | Total | |
|---|---|---|---|---|---|---|
| December 2017 | ||||||
| VaR average in the period | 25 | 10 | 3 | 13 | (23) | 27 |
| VaR max in the period | 27 | 11 | 2 | 12 | (19) | 34 |
| VaR min in the period | 23 | 7 | 4 | 14 | (26) | 22 |
| End of period VaR | 23 | 7 | 4 | 14 | (26) | 22 |
| December 2016 | ||||||
| VaR average in the period | 28 | 10 | 4 | 11 | (23) | 29 |
| VaR max in the period | 30 | 16 | 4 | 11 | (23) | 38 |
| VaR min in the period | 21 | 10 | 1 | 11 | (20) | 23 |
| End of period VaR | 29 | 7 | 2 | 12 | (24) | 26 |
| December 2015 | ||||||
| VaR average in the period | 24 | |||||
| VaR max in the period | 32 | 5 | 3 | 9 | (18) | 30 |
| VaR min in the period | 20 | 6 | 3 | 9 | (17) | 21 |
| End of period VaR | 21 | 9 | 3 | 11 | (20) | 24 |
Validation of the model
The internal market risk model is validated on a regular basis by backtesting in both BBVA S.A. and Bancomer. The aim of backtesting is to validate the quality and precision of the internal market risk model used by BBVA Group to estimate the maximum daily loss of a portfolio, at a 99% level of confidence and a 250-day time horizon, by comparing the Group's results and the risk measurements generated by the internal market risk model. These tests showed that the internal market risk model of both BBVA, S.A. and Bancomer is adequate and precise.
Two types of backtesting have been carried out during 2017, 2016 and 2015::
In addition, each of these two types of backtesting was carried out at the level of risk factor or business type, thus making a deeper comparison of the results with respect to risk measurements.
For the period between the end of the year ended December 31, 2016 and the end of the year ended December 31, 2016, it was carried out the backtesting of the internal VaR calculation model, comparing the daily results obtained with the estimated risk level estimated by the internal VaR calculation model. At the end of the semester the comparison showed the internal VaR calculation model was working correctly, within the "green" zone (0-4 exceptions), thus validating the internal VaR calculation model, as has occurred each year since the internal market risk model was approved for the Group.
Stress test analysis
A number of stress tests are carried out on BBVA Group's trading portfolios. First, global and local historical scenarios are used that replicate the behavior of an extreme past event, such as for example the collapse of Lehman Brothers or the "Tequilazo" crisis. These stress tests are complemented with simulated scenarios, where the aim is to generate scenarios that have a significant impact on the different portfolios, but without being anchored to any specific historical scenario. Finally, for some portfolios or positions, fixed stress tests are also carried out that have a significant impact on the market variables affecting these positions.
Historical scenarios
The historical benchmark stress scenario for the BBVA Group is Lehman Brothers, whose sudden collapse in September 2008 led to a significant impact on the behavior of financial markets at a global level. The following are the most relevant effects of this historical scenario:
Simulated scenarios
Unlike the historical scenarios, which are fixed and therefore not suited to the composition of the risk portfolio at all times, the scenario used for the exercises of economic stress is based on Resampling methodology. This methodology is based on the use of dynamic scenarios are recalculated periodically depending on the main risks held in the trading portfolios. On a data window wide enough to collect different periods of stress (data are taken from 1-1-2008 until today), a simulation is performed by resampling of historic observations, generating a loss distribution and profits to analyze most extreme of births in the selected historical window. The advantage of this resampling methodology is that the period of stress is not predetermined, but depends on the portfolio maintained at each time, and making a large number of simulations (10,000 simulations) allows a richer information for the analysis of expected shortfall than what is available in the scenarios included in the calculation of VaR.
The main features of this approach are: a) the generated simulations respect the correlation structure of the data, b) flexibility in the inclusion of new risk factors and c) to allow the introduction of a lot of variability in the simulations (desirable to consider extreme events).
The impact of the stress test under multivariable simulation of the risk factors of the portfolio (Expected shortfall 95% to 20 days) as of December 31, 2017 is as follows:
Millions of Euros
| Europe | Mexico | Peru | Venezuela | Argentina | Colombia | Chile | Turkey | |
|---|---|---|---|---|---|---|---|---|
| Expected Shortfall | (75) | (29) | (8) | - | (8) | (8) | (9) | (1) |
7.4.2 Structural risk
The Assets and Liabilities Committee (ALCO) is the main responsible body for the management of structural risks relating to liquidity/funding, interest rates, currency rates, equity and solvency. Every month, with the assistance of the CEO and representatives from the areas of Finance, Risks and Business Areas, this committee monitors the above risks and is presented with proposals for managing them for its approval. These management proposals are made proactively by the Finance area, taking into account the risk appetite framework and with the aim of guaranteeing recurrent earnings and financial stability and preserving the entity's solvency. All the balance-sheet management units have a local ALCO, assisted constantly by the members of the Corporate Center. There is also a corporate ALCO where the management strategies in the Group's subsidiaries are monitored and presented.
Structural interest-rate risk
The structural interest-rate risk (“SIRR”) is related to the potential impact that variations in market interest rates have on an entity's net interest income and equity. In order to properly measure SIRR, BBVA takes into account the main sources that generate this risk: repricing risk, yield curve risk, option risk and basis risk, which are analyzed from two complementary points of view: net interest income (short term) and economic value (long term).
ALCO monitors the interest-rate risk metrics and the Assets and Liabilities Management unit carries out the management proposals for the structural balance sheet. The management objective is to ensure the stability of net interest income and book value in the face of changes in market interest rates, while respecting the internal solvency and limits in the different balance-sheets and for BBVA Group as a whole; and complying with current and future regulatory requirements.
BBVA's structural interest-rate risk management control and monitoring is based on a set of metrics and tools that enable the entity's risk profile to be monitored correctly. A wide range of scenarios are measured on a regular basis, including sensitivities to parallel movements in the event of different shocks, changes in slope and curve, as well as delayed movements. Other probabilistic metrics based on statistical scenario- simulating methods are also assessed, such as earnings at risk (“EaR”) and economic capital (“EC”), which are defined as the maximum adverse deviations in net interest income and economic value, respectively, for a given confidence level and time horizon. Impact thresholds are established on these management metrics both in terms of deviations in net interest income and in terms of the impact on economic value. The process is carried out separately for each currency to which the Group is exposed, and the diversification effect between currencies and business units is considered after this.
In order to evaluate its effectiveness, the model is subjected to regular internal validation, which includes backtesting. In addition, the banking book’s interest-rate risk exposures are subjected to different stress tests in order to reveal balance sheet vulnerabilities under extreme scenarios. This testing includes an analysis of adverse macroeconomic scenarios designed specifically by BBVA Research, together with a wide range of potential scenarios that aim to identify interest-rate environments that are particularly damaging for the entity. This is done by generating extreme scenarios of a breakthrough in interest rate levels and historical correlations, giving rise to sudden changes in the slopes and even to inverted curves.
The model is necessarily underpinned by an elaborate set of hypotheses that aim to reproduce the behavior of the balance sheet as closely as possible to reality. Especially relevant among these assumptions are those related to the behavior of “accounts with no explicit maturity”, for which stability and remuneration assumptions are established, consistent with an adequate segmentation by type of product and customer, and prepayment estimates (implicit optionality). The hypotheses are reviewed and adapted, at least on an annual basis, to signs of changes in behavior, kept properly documented and reviewed on a regular basis in the internal validation processes.
The impacts on the metrics are assessed both from a point of view of economic value (gone concern) and from the perspective of net interest income, for which a dynamic model (going concern) consistent with the corporate assumptions of earnings forecasts is used.
The table below shows the profile of average sensitivities to net interest income and value of the main entities in BBVA Group in 2017 (certain information within this table is provisional. Its distribution should not be significantly affected):
Sensitivity to Interest-Rate Analysis - December 2017
| Impact on Net Interest Income (*) | Impact on Economic Value (**) | |||
|---|---|---|---|---|
| 100 Basis-Point Increase | 100 Basis-Point Decrease | 100 Basis-Point Increase | 100 Basis-Point Decrease | |
| Europe (***) | + (10% - 15%) | - (5% - 10%) | + (0% - 5%) | - (0% - 5%) |
| Mexico | + (0% - 5%) | - (0% - 5%) | - (0% - 5%) | + (0% - 5%) |
| USA | + (5% - 10%) | - (5% - 10%) | - (0% - 5%) | - (0% - 5%) |
| Turkey | - (0% - 5%) | + (0% - 5%) | - (0% - 5%) | + (0% - 5%) |
| South America | + (0% - 5%) | - (0% - 5%) | - (0% - 5%) | + (0% - 5%) |
| BBVA Group | + (0% - 5%) | - (0% - 5%) | + (0% - 5%) | - (0% - 5%) |
In 2017 in Europe monetary policy has remained expansionary, maintaining rates at 0%. In USA the rising rate cycle initiated by the Federal Reserve in 2015 has been intensified. In Mexico and Turkey, the upward cycle has continued because of weak currencies and inflation prospects. In South America, monetary policy has been expansive, with rate declines in most of the economies where the Group operates, with the exception of Argentina, where rates increased during 2017.
The BBVA Group maintains, overall in its Balance Sheet Management Units ("BSMUs"), a positive sensitivity in its net interest income to an increase in interest rates. The higher relative net interest income sensitivities are observed in mature markets, particularly Europe, where however, the negative sensitivity in its net interest income to a decrease in interest rates is limited by the downward path scope in interest rates. The Group maintains a moderate risk profile, according to its target risk, through effective management of its balance sheet structural risk.
Structural exchange-rate risk
In BBVA Group, structural exchange-rate risk arises from the consolidation of holdings in subsidiaries with functional currencies other than the euro. Its management is centralized in order to optimize the joint handling of permanent foreign currency exposures, taking into account the diversification.
The corporate Assets and Liabilities Management unit, through ALCO, designs and executes hedging strategies with the main purpose of controlling the potential negative effect of exchange-rate fluctuations on capital ratios and on the equivalent value in euros of the foreign-currency earnings of the Group's subsidiaries, considering transactions according to market expectations and their cost.
The risk monitoring metrics included in the framework of limits are integrated into management and supplemented with additional assessment indicators. At corporate level they are based on probabilistic metrics that measure the maximum deviation in the Group’s Capital, CET1 (“Common Equity Tier 1”) ratio, and net attributable profit. The probabilistic metrics make it possible to estimate the joint impact of exposure to different currencies taking into account the different variability in exchange rates and their correlations.
The suitability of these risk assessment metrics is reviewed on a regular basis through backtesting exercises. The final element of structural exchange-rate risk control is the analysis of scenarios and stress with the aim of identifying in advance possible threats to future compliance with the risk appetite levels set, so that any necessary preventive management actions can be taken. The scenarios are based both on historical situations simulated by the risk model and on the risk scenarios provided by BBVA Research.
2017 has been characterized by the depreciation against the euro of the main currencies of the geographies where the Group operates: US Dollar (-12%), Mexican peso (-8%) and Turkish lira (-18%).
The Group's structural exchange-rate risk exposure level has remained fairly stable since the end of 2016. The hedging policy intends to keep low levels of sensitivity to movements in the exchange rates of emerging currencies against the euro and focuses on Mexican peso and Turkish lira. The risk mitigation level in capital ratio due to the book value of BBVA Group's holdings in foreign emerging currencies stood at around 70% and, as of the end of 2017, CET1 ratio sensitivity to the appreciation of 1% in the euro exchange rate for each currency is: US Dollar +1,2 bps; Mexican peso -0,1 bps; Turkish Lira -0,1 bps; other currencies -0,3 bps. On the other hand, hedging of emerging-currency denominated earnings of 2017 has reached a 61%, concentrated in Mexican peso and Turkish lira.
Structural equity risk
BBVA Group's exposure to structural equity risk stems basically from investments in industrial and financial companies with medium- and long-term investment horizons. This exposure is mitigated through net short positions held in derivatives of their underlying assets, used to limit portfolio sensitivity to potential falls in prices.
Structural management of equity portfolios is the responsibility of the Group's units specializing in this area. Their activity is subject to the corporate risk management policies for equity positions in the equity portfolio. The aim is to ensure that they are handled consistently with BBVA's business model and appropriately to its risk tolerance level, thus enabling long-term business sustainability.
The Group's risk management systems also make it possible to anticipate possible negative impacts and take appropriate measures to prevent damage being caused to the entity. The risk control and limitation mechanisms are focused on the exposure, annual operating performance and economic capital estimated for each portfolio. Economic capital is estimated in accordance with a corporate model based on Monte Carlo simulations, taking into account the statistical performance of asset prices and the diversification existing among the different exposures.
Stress tests and analyses of sensitivity to different simulated scenarios are carried out periodically to analyze the risk profile in more depth. They are based on both past crisis situations and forecasts made by BBVA Research. This checks that the risks are limited and that the tolerance levels set by the Group are not at risk.
Backtesting is carried out on a regular basis on the risk measurement model used.
With regard to the equity markets, the world indexes have closed the year 2017 with significant increases helped by a positive macro environment. However, the European indexes, and especially the Spanish one, have lagged despite their positive performance. In the case of the IBEX (+7% in the year), the index have been partly penalized in the second half of the year by the political tensions in Catalonia.
Structural equity risk, measured in terms of economic capital, has decreased in the period mainly due to the sale of stakes. The aggregate sensitivity of the BBVA Group’s consolidated equity to a 1% fall in the price of shares of the companies making up the equity portfolio remained at around -€32 million as of December 31, 2017 and -€38 million as of December 31, 2016. This estimate takes into account the exposure in shares valued at market prices, or if not applicable, at fair value (excluding the positions in the Treasury Area portfolios) and the net delta-equivalent positions in derivatives on the same underlyings.
7.4.3 Financial Instruments offset
Financial assets and liabilities may be netted, i.e. they are presented for a net amount on the consolidated balance sheet only when the Group's entities satisfy with the provisions of IAS 32-Paragraph 42, so they have both the legal right to net recognized amounts, and the intention of settling the net amount or of realizing the asset and simultaneously paying the liability.
In addition, the Group has presented as gross amounts assets and liabilities on the consolidated balance sheet for which there are master netting arrangements in place, but for which there is no intention of settling net. The most common types of events that trigger the netting of reciprocal obligations are bankruptcy of the entity, surpassing certain level of indebtedness threshold, failure to pay, restructuring and dissolution of the entity.
In the current market context, derivatives are contracted under different framework contracts being the most widespread developed by the International Swaps and Derivatives Association (“ISDA”) and, for the Spanish market, the Framework Agreement on Financial Transactions (“CMOF”). Almost all portfolio derivative transactions have been concluded under these framework contracts, including in them the netting clauses mentioned in the preceding paragraph as "Master Netting Agreement", greatly reducing the credit exposure on these instruments. Additionally, in contracts signed with professional counterparties, the collateral agreement annexes called Credit Support Annex (“CSA”) are included, thereby minimizing exposure to a potential default of the counterparty.
Moreover, in transactions involving assets purchased or sold under a purchase agreement there is a high volume transacted through clearing houses that articulate mechanisms to reduce counterparty risk, as well as through the signature of various master agreements for bilateral transactions, the most widely used being the Global Master Repurchase Agreement (GMRA), published by International Capital Market Association (“ICMA”), to which the clauses related to the collateral exchange are usually added within the text of the master agreement itself.
A summary of the effect of the compensation (via netting and collateral) for derivatives and securities operations is presented below as of December 31, 2017, 2016 and 2015:
December 2017 (Millions of euros)
| Gross Amounts Not Offset in the Condensed Consolidated Balance Sheets (D) | |||||||
|---|---|---|---|---|---|---|---|
| Notes | Gross Amounts Recognized (A) | Gross Amounts Offset in the Condensed Consolidated Balance Sheets (B) | Net Amount Presented in the Condensed Consolidated Balance Sheets (C=A-B) | Financial Instruments | Cash Collateral Received/ Pledged | Net Amount (E=C-D) | |
| Trading and hedging derivatives | 10, 15 | 49,333 | 11,584 | 37,749 | 27,106 | 7,442 | 3,202 |
| Reverse repurchase, securities borrowing and similar agreements | 26,426 | 56 | 26,369 | 26,612 | 141 | (384) | |
| Total Assets | 75,759 | 11,641 | 64,118 | 53,717 | 7,583 | 2,818 | |
| Trading and hedging derivatives | 10, 15 | 50,693 | 11,644 | 39,049 | 27,106 | 8,328 | 3,615 |
| Repurchase, securities lending and similar agreementss | 40,134 | 56 | 40,078 | 40,158 | 21 | (101) | |
| Total liabilities | 90,827 | 11,701 | 79,126 | 67,264 | 8,349 | 3,514 | |
December 2016 (Millions of euros)
| Gross Amounts Not Offset in the Condensed Consolidated Balance Sheets (D) | |||||||
|---|---|---|---|---|---|---|---|
| Notes | Gross Amounts Recognized (A) | Gross Amounts Offset in the Condensed Consolidated Balance Sheets (B) | Net Amount Presented in the Condensed Consolidated Balance Sheets (C=A-B) | Financial Instruments | Cash Collateral Received/ Pledged | INet Amount (E=C-D) | |
| Trading and hedging derivatives | 10, 15 | 59,374 | 13,587 | 45,788 | 32,146 | 6,571 | 7,070 |
| Reverse repurchase, securities borrowing and similar agreements | 25,833 | 2,912 | 22,921 | 23,080 | 174 | (333) | |
| Total Assets | 85,208 | 16,499 | 68,709 | 55,226 | 6,745 | 6,738 | |
| Trading and hedging derivatives | 10, 15 | 59,545 | 14,080 | 45,465 | 32,146 | 7,272 | 6,047 |
| Repurchase, securities lending and similar agreements | 49,474 | 2,912 | 46,562 | 47,915 | 176 | (1,529) | |
| Total liabilities | 109,019 | 16,991 | 92,027 | 80,061 | 7,448 | 4,518 | |
December 2015 (Millions of euros)
| Gross Amounts Not Offset in the Condensed Consolidated Balance Sheets (D) | |||||||
|---|---|---|---|---|---|---|---|
| Notes | Gross Amounts Recognized (A) | Gross Amounts Offset in the Condensed Consolidated Balance Sheets (B) | Net Amount Presented in the Condensed Consolidated Balance Sheets (C=A-B) | Financial Instruments | Cash Collateral Received/ Pledged | Net Amount (E=C-D) | |
| Trading and hedging derivatives | 10, 15 | 52,244 | 7,805 | 44,439 | 30,350 | 5,493 | 8,597 |
| Reverse repurchase, securities borrowing and similar agreements | 21,531 | 4,596 | 16,935 | 17,313 | 24 | (402) | |
| Total Assets | 73,775 | 12,401 | 61,374 | 47,663 | 5,517 | 8,195 | |
| Trading and hedging derivatives | 10, 15 | 53,298 | 8,423 | 44,876 | 30,350 | 9,830 | 4,696 |
| Repurchase, securities lending and similar agreements | 72,998 | 4,596 | 68,402 | 68,783 | 114 | (495) | |
| Total liabilities | 126,296 | 13,019 | 113,278 | 99,133 | 9,944 | 4,201 | |
7.5 Liquidity risk
7.5.1 Liquidity risk management
Management of liquidity and structural finance within the BBVA Group is based on the principle of the financial autonomy of the entities that make it up. This approach helps prevent and limit liquidity risk by reducing the Group’s vulnerability in periods of high risk. This decentralized management avoids possible contagion due to a crisis that could affect only one or several BBVA Group entities, which must cover their liquidity needs independently in the markets where they operate. Liquidity Management Units (LMUs) have been set up for this reason in the geographical areas where the main foreign subsidiaries operate, and also for the parent BBVA S.A., within the Euro currency scope, which includes BBVA Portugal.
Assets and Liabilities Management unit manages BBVA Group's liquidity and funding. It plans and executes the funding of the long-term structural gap of each LMUs and proposes to ALCO the actions to adopt in this regard in accordance with the policies and limits established by the Standing Committee.
As first core element, the Bank's target in terms of liquidity and funding risk is characterized through the Liquidity Coverage Ratio (LCR) and the Loan-to-Stable-Customer-Deposits (LtSCD) ratio. LCR is a regulatory measurement aimed at ensuring entities’ resistance in a scenario of liquidity stress within a time horizon of 30 days. BBVA, within its risk appetite framework and its limits and alerts schemes, has established a level of requirement for compliance with the LCR ratio both for the Group as a whole and for each of the LMUs individually. The internal levels required are geared to comply sufficiently and efficiently in advance with the implementation of the regulatory requirement of 2018, at a level above 100%.
LCR ratio in Europe came into force on 1st October 2015. With an initial 60% minimum requirement, progressively increased (phased-in) up to 100% in 2018. Throughout the year 2017, LCR level at BBVA Group has been comfortably above 100%. As of December 2017, the ratio level is 128%.
Although this regulatory requirement is mandatory at a Group level and Eurozone banks, all subsidiaries are well above this minimum. In any case, it should be noted that liquidity excesses in subsidiaries are not deemed transferable when calculating the consolidated ratio. Taking into account the impact of these High Quality Liquid Assets excluded, LCR ratio would be 149%, which is +21% above.
LCR main LMU
| December 2017 | |
|---|---|
| Group | 128% |
| Eurozone (*) | 151% |
| Bancomer | 148% |
| Compass (**) | 144% |
| Garanti | 134% |
The LtSCD measures the relation between the net credit investment and stable funds. The aim is to preserve a stable funding structure in the medium term for each of the LMUs making up BBVA Group, taking into account that maintaining an adequate volume of stable customer funds is key to achieving a sound liquidity profile.
Customer funds captured and managed by business units are defined as stable customer funds. These funds usually show little sensitivity to market changes and are largely non-volatile in terms of aggregate amounts per operation, thanks to customer linkage to the unit. Stable funds in each LMU are calculated by analyzing the behavior of the balance sheets of the different customer segments identified as likely to provide stability to the funding structure, and by prioritizing an established relationship and applying bigger haircuts to the funding lines of less stable customers. The main base of stable funds is composed of deposits by individual customers and small businesses.
For the purpose of establishing the (maximum) target levels for LtSCD in each LMU and providing an optimal funding structure reference in terms of risk appetite, GRM-Structural Risks identifies and assesses the economic and financial variables that condition the funding structures in the various geographical areas. The behavior of the indicators reflects that the funding structure remained robust in 2017, 2016 and 2015, in the sense that all the LMUs maintain levels of self-funding with stable customer funds higher than the required levels.
LtSCD by LMU
| December 2017 | December 2016 | December 2015 | |
|---|---|---|---|
| Group (average) | 110% | 113% | 116% |
| Eurozone | 108% | 113% | 116% |
| Bancomer | 109% | 113% | 110% |
| Compass | 109% | 108% | 112% |
| Garanti | 122% | 124% | 128% |
| Other LMUs | 108% | 107% | 111% |
The second core element in liquidity and funding risk management is to achieve proper diversification of the funding structure, avoiding excessive reliance on short-term funding and establishing a maximum level of short-term borrowing comprising both wholesale funding as well as funds from non-retail customers. Regarding long-term funding, the maturity profile does not show significant concentrations, which enables adaptation of the anticipated issuance schedule to the best financial conditions of the markets. Finally, concentration risk is monitored at the LMU level, with a view to ensuring the right diversification both per counterparty and per instrument type.
The third element promotes the short-term resilience of the liquidity risk profile, making sure that each LMU has sufficient collateral to address the risk of wholesale markets closing. Basic Capacity is the short-term liquidity risk management and control metric that is defined as the relationship between the available explicit assets and the maturities of wholesale liabilities and volatile funds, at different terms, with special relevance being given to 30-day maturities.
Each entity maintains an individual liquidity buffer, both Banco Bilbao Vizcaya Argentaria SA and its subsidiaries, including BBVA Compass, BBVA Bancomer, Garanti Bank and the Latin American subsidiaries. The table below shows the liquidity available by instrument as of December 31, 2017 and 2016 for the most significant entities:
December 2017 (Millions of euros)
| BBVA Eurozone (1) | BBVA Bancomer | BBVA Compass | Garanti Bank | Other | |
|---|---|---|---|---|---|
| Cash and balances with central banks | 15,634 | 8,649 | 2,150 | 6,692 | 6,083 |
| Assets for credit operations with central banks | 47,429 | 5,731 | 24,039 | 5,661 | 6,333 |
| Central governments issues | 26,784 | 3,899 | 2,598 | 5,661 | 6,274 |
| Of Which: Spanish government securities | 20,836 | - | - | - | - |
| Other issues | 20,645 | 1,831 | 7,023 | - | 58 |
| Loans | - | - | 14,417 | - | - |
| Other non-eligible liquid assets | 7,986 | 575 | 621 | 1,607 | 345 |
| ACCUMULATED AVAILABLE BALANCE | 71,050 | 14,955 | 26,810 | 13,959 | 12,761 |
| AVERAGE BALANCE | 67,823 | 13,896 | 27,625 | 13,862 | 13,211 |
December 2016 (Millions of euros)
| BBVA Eurozone(1) | BBVA Bancomer | BBVA Compass | Garanti Bank | Other | |
|---|---|---|---|---|---|
| Cash and balances with central banks | 16,038 | 8,221 | 1,495 | 4,758 | 6,504 |
| Assets for credit operations with central banks | 50,706 | 4,175 | 26,865 | 4,935 | 4,060 |
| Central governments issues | 30,702 | 1,964 | 1,084 | 4,935 | 3,985 |
| Of Which: Spanish government securities | 23,353 | - | - | - | - |
| Other issues | 20,005 | 2,212 | 8,991 | - | 75 |
| Loans | - | - | 16,790 | - | - |
| Other non-eligible liquid assets | 6,884 | 938 | 662 | 1,478 | 883 |
| ACCUMULATED AVAILABLE BALANCE | 73,629 | 13,335 | 29,022 | 11,171 | 11,447 |
| AVERAGE BALANCE | 68,322 | 13,104 | 27,610 | 12,871 | 11,523 |
Stress analyses are also a basic element of the liquidity and funding risk monitoring system, as they help anticipate deviations from the liquidity targets and limits set out in the risk appetite as well as establish tolerance ranges at different management levels. They also play a key role in the design of the Liquidity Contingency Plan and in defining the specific measures for action for realigning the risk profile.
For each of the scenarios, a check is carried out whether BBVA has sufficient liquid assets to meet the liquidity commitments/outflows in the various periods analyzed. The analysis considers four scenarios, one core and three crisis-related: systemic crisis; unexpected internal crisis with a considerable rating downgrade and/or affecting the ability to issue in wholesale markets and the perception of business risk by the banking intermediaries and the BBVA's customers; and a mixed scenario, as a combination of the two aforementioned scenarios. Each scenario considers the following factors: liquidity existing on the market, customer behavior and sources of funding, impact of rating downgrades, market values of liquid assets and collateral, and the interaction between liquidity requirements and the performance of the BBVA's asset quality.
The results of these stress analyses carried out regularly reveal that BBVA has a sufficient buffer of liquid assets to deal with the estimated liquidity outflows in a scenario such as a combination of a systemic crisis and an unexpected internal crisis, during a period in general longer than 3 months for LMUs, including a major downgrade in the BBVA's rating (by up to three notches).
Beside the results of stress exercises and risk metrics, Early Warning Indicators play an important role in the corporate model and also in the Liquidity Contingency Plan. These are mainly financing structure indicators, related to asset encumbrance, counterparty concentration, outflows of customer deposits, unexpected use of credit lines, and market indicators, which help to anticipate potential risks and capture market expectations.
Below is a matrix of residual maturities by contractual periods based on supervisory prudential reporting as of December 31, 2017 and 2016:
December 2017. Contractual Maturities (Millions of euros)
| Demand | Up to 1 Month | 1 to 3 Months | 3 to 6 Months | 6 to 9 Months | 9 to 12 Months | 1 to 2 Years | 2 to 3 Years | 3 to 5 Years | Over 5 Years | Total | |
|---|---|---|---|---|---|---|---|---|---|---|---|
| ASSETS | |||||||||||
| Cash, cash balances at central banks and other demand deposits | 8,179 | 31,029 | - | - | - | - | - | - | - | - | 39,208 |
| Deposits in credit entities | 252 | 4,391 | 181 | 169 | 120 | 122 | 116 | 112 | 157 | 1,868 | 7,488 |
| Deposits in other financial institutions | 1 | 939 | 758 | 796 | 628 | 447 | 1,029 | 681 | 806 | 1,975 | 8,060 |
| Reverse repo, securities borrowing and margin lending | 18,979 | 2,689 | 1,921 | 541 | 426 | 815 | 30 | 727 | 226 | - | 26,354 |
| Loans and Advances | 267 | 21,203 | 26,323 | 23,606 | 15,380 | 17,516 | 43,973 | 35,383 | 50,809 | 123,568 | 358,028 |
| Securities' portfolio settlement | 1 | 1,579 | 4,159 | 4,423 | 2,380 | 13,391 | 5,789 | 11,289 | 12,070 | 44,666 | 99,747 |
December 2017. Contractual Maturities (Millions of euros)
| Demand | Up to 1 Month | 1 to 3 Months | 3 to 6 Months | 6 to 9 Months | 9 to 12 Months | 1 to 2 Years | 2 to 3 Years | 3 to 5 Years | Over 5 Years | Total | |
|---|---|---|---|---|---|---|---|---|---|---|---|
| LIABILITIES | |||||||||||
| Wholesale funding | - | 3,648 | 4,209 | 4,238 | 1,227 | 2,456 | 5,772 | 6,432 | 18,391 | 30,162 | 76,535 |
| Deposits in financial institutions | 6,831 | 5,863 | 1,082 | 2,335 | 392 | 1,714 | 930 | 765 | 171 | 1,429 | 21,512 |
| Deposits in other financial institutions and international agencies | 10,700 | 4,827 | 3,290 | 1,959 | 554 | 1,328 | 963 | 286 | 355 | 1,045 | 25,307 |
| Customer deposits | 233,068 | 45,171 | 18,616 | 11,428 | 8,711 | 10,368 | 7,607 | 2,612 | 1,833 | 2,034 | 341,448 |
| Security pledge funding | - | 35,502 | 2,284 | 1,405 | 396 | 973 | 64 | 23,009 | 338 | 1,697 | 65,668 |
| Derivatives, net | - | (18) | (110) | (116) | (135) | (117) | (336) | (91) | (106) | (419) | (1,448) |
December 2016. Contractual Maturities (Millions of euros)
| Demand | Up to 1 Month | 1 to 3 Months | 3 to 6 Months | 6 to 9 Months | 9 to 12 Months | 1 to 2 Years | 2 to 3 Years | 3 to 5 Years | Over 5 Years | Total | |
|---|---|---|---|---|---|---|---|---|---|---|---|
| ASSETS | |||||||||||
| Cash, cash balances at central banks and other demand deposits | 23,191 | 13,825 | - | - | - | - | - | - | - | - | 37,016 |
| Deposits in credit entities | 991 | 4,068 | 254 | 155 | 48 | 72 | 117 | 87 | 122 | 4,087 | 10,002 |
| Deposits in other financial institutions | 1 | 1,192 | 967 | 675 | 714 | 532 | 1,330 | 918 | 942 | 336 | 7,608 |
| Reverse repo, securities borrowing and margin lending | - | 20,232 | 544 | 523 | - | 428 | 500 | 286 | 124 | 189 | 22,826 |
| Loans and Advances | 591 | 20,272 | 25,990 | 22,318 | 16,212 | 15,613 | 44,956 | 35,093 | 55,561 | 133,589 | 370,195 |
| Securities' portfolio settlement | - | 708 | 3,566 | 3,688 | 2,301 | 4,312 | 19,320 | 10,010 | 16,662 | 51,472 | 112,039 |
December 2016. Contractual Maturities (Millions of euros)
| Demand | Up to 1 Month | 1 to 3 Months | 3 to 6 Months | 6 to 9 Months | 9 to 12 Months | 1 to 2 Years | 2 to 3 Years | 3 to 5 Years | Over 5 Years | Total | |
|---|---|---|---|---|---|---|---|---|---|---|---|
| Wholesale funding | 419 | 7,380 | 2,943 | 5,547 | 3,463 | 5,967 | 7,825 | 5,963 | 14,016 | 31,875 | 85,397 |
| Deposits in financial institutions | 6,762 | 5,365 | 1,181 | 2,104 | 800 | 2,176 | 746 | 1,156 | 859 | 3,714 | 24,862 |
| Deposits in other financial institutions and international agencies | 15,375 | 6,542 | 8,624 | 3,382 | 2,566 | 1,897 | 1,340 | 686 | 875 | 2,825 | 44,114 |
| Customer deposits | 206,140 | 49,053 | 25,522 | 15,736 | 11,863 | 11,343 | 8,619 | 5,060 | 781 | 936 | 335,052 |
| Security pledge funding | - | 38,153 | 3,561 | 1,403 | 1,004 | 912 | 1,281 | 640 | 23,959 | 1,712 | 72,626 |
| Derivatives, net | - | (2,123) | (95) | (190) | (111) | (326) | (132) | (82) | (105) | (47) | (3,210) |
The matrix shows the retail nature of the funding structure, with a loan portfolio being mostly funded by customer deposits. On the outflows side of the matrix, the “demand” maturity bucket mainly contains the retail customers sight accounts whose behavior shows a high level of stability. According to internal methodology they are estimated to mature on average around three years.
In the Euro Liquidity Management Unit (LMU), solid liquidity and funding situation, where activity has continued to generate liquidity through the decrease of Credit Gap and the good performance of the customer liabilities. In addition, during 2017 the Euro LMU made issues in the public market for €7,100 million, which has allowed it to obtain funding at favorable price conditions.
In Mexico, sound liquidity position, the dependence on wholesale financing remains low and closely associated with the securities portfolios. In 2017, BBVA Bancomer made local issuances at 3 and 5 years for 7000 million of Mexican pesos.
In the United States, the containment of the cost of liabilities has led to a slightly increase in the credit gap. At the end of December, 2017 BBVA Compass successfully issued 5 year senior debt for USD 750 million.
Comfortable liquidity situation in Turkey supported by the favorable market conditions, with slight Credit Gap increase due to lending growth under the government's Credit Guarantee Fund program. During 2017, Garanti realized USD 2,000 million foreign currency and 1,700 million of Turkish liras long term issuances. Additionally syndicate loans have been rolled over in the second and fourth quarter, with a new 2 years tenor.
The liquidity position of the rest of subsidiaries has continued to be sound, maintaining a solid liquidity position in all the jurisdictions in which the Group operates. Access to capital markets of these subsidiaries has also been maintained with recurring issuances in the local market.
In this context, BBVA has maintained its objective of strengthening the funding structure of the different Group entities based on growing their self-funding from stable customer funds, while guaranteeing a sufficient buffer of fully available liquid assets, diversifying the various sources of funding available, and optimizing the generation of collateral available for dealing with stress situations in the markets.
7.5.2 Asset encumbrance
As of December 31, 2017 and 2016, the encumbered (those provided as collateral for certain liabilities) and unencumbered assets are broken down as follows:
December 2017 (Millions of euros)
| Encumbered assets | Non-Encumbered assets | |||
|---|---|---|---|---|
| Book value of Encumbered assets | Market value of Encumbered assets | Book value of non-encumbered assets | Market value of non-encumbered assets | |
| Equity instruments | 2,297 | 2,297 | 9,616 | 9,616 |
| Debt Securities | 28,700 | 29,798 | 84,391 | 84,391 |
| Loans and Advances and other assets | 79,604 | 485,451 | ||
December 2016 (Millions of euros)
| Encumbered assets | Non-Encumbered assets | |||
|---|---|---|---|---|
| Book value of Encumbered assets | Market value of Encumbered assets | Book value of non-encumbered assets | Market value of non-encumbered assets | |
| Equity instruments | 2,214 | 2,214 | 9,022 | 9,022 |
| Debt Securities | 40,114 | 39,972 | 90,679 | 90,679 |
| Loans and Advances and other assets | 94,718 | 495,109 | ||
The committed value of "Loans and Advances and other assets" corresponds mainly to loans linked to the issue of covered bonds, territorial bonds or long-term securitized bonds (see Note 22.3) as well as those used as a guarantee to access certain funding transactions with central banks. Debt securities and equity instruments respond to underlying that are delivered in repos with different types of counterparties, mainly clearing houses or credit institutions, and to a lesser extent central banks. Collateral provided to guarantee derivative operations is also included as committed assets.
As of December 31, 2017 and 2016, collateral pledge mainly due to repurchase agreements and securities lending, and those which could be committed in order to obtain funding are provided below:
December 2017. Collateral received (Millions of euros)
| Fair value of encumbered collateral received or own debt securities issued | Fair value of collateral received or own debt securities issued available for encumbrance | Nominal amount of collateral received or own debt securities issued not available for encumbrance | |
|---|---|---|---|
| Collateral received | 23,881 | 9,630 | 201 |
| Equity instruments | 103 | 5 | - |
| Debt securities | 23,715 | 9,619 | 121 |
| Loans and Advances and other assets | 63 | 6 | 80 |
| Own debt securities issued other than own covered bonds or ABSs | 3 | 161 | - |
December 2016. Collateral received (Millions of euros)
| Fair value of encumbered collateral received or own debt securities issued | Fair value of collateral received or own debt securities issued available for encumbrance | Nominal amount of collateral received or own debt securities issued not available for encumbrance | |
|---|---|---|---|
| Collateral received | 19,921 | 10,039 | 173 |
| Equity instruments | 58 | 59 | - |
| Debt securities | 19,863 | 8,230 | 28 |
| Loans and Advances and other assets | - | 1,750 | 144 |
| Own debt securities issued other than own covered bonds or ABSs | 5 | - | - |
The guarantees received in the form of reverse repos or security lending transactions are committed by their use in repos, as is the case with debt securities.
As of December 31, 2017 and 2016, financial liabilities issued related to encumbered assets in financial transactions as well as their book value were as follows:
December 2017. Sources of encumbrance (Millions of euros)
| Matching liabilities, contingent liabilities or securities lent | Assets, collateral received and own debt securities issued other than covered bonds and ABSs encumbered | |
|---|---|---|
| Book value of financial liabilities | 118,704 | 133,312 |
| Derivatives | 11,843 | 11,103 |
| Loans and Advances | 87,484 | 98,478 |
| Outstanding subordinated debt | 19,377 | 23,732 |
| Other sources | 305 | 1,028 |
December 2016. Sources of encumbrance (Millions of euros)
| Matching liabilities, contingent liabilities or securities lent | Assets, collateral received and own debt securities issued other than covered bonds and ABSs encumbered | |
|---|---|---|
| Book value of financial liabilities | 134,387 | 153,632 |
| Derivatives | 9,304 | 9,794 |
| Loans and Advances | 96,137 | 108,268 |
| Outstanding subordinated debt | 28,946 | 35,569 |
| Other sources | - | 2,594 |
7.6 Operational Risk
Operational risk is defined as one that could potentially cause losses due to human errors, inadequate or faulty internal processes, system failures or external events. This definition includes legal risk but excludes strategic and/or business risk and reputational risk.
Operational risk is inherent to all banking activities, products, systems and processes. Its origins are diverse (processes, internal and external fraud, technology, human resources, commercial practices, disasters, suppliers). Operational risk management is a part of the BBVA Group global risk management structure.
Operational risk management framework
Operational risk management in the Group is based on the value-adding drivers generated by the advanced measurement approach (AMA), as follows:
Operational Risk Management Principles
Operational risk management in BBVA Group should:
These principles reflect BBVA Group's vision of operational risk, on the basis that the resulting events have an ultimate cause that should always be identified, and that the impact of the events is reduced significantly by controlling that cause.
Irrespective of the adoption of all the possible measures and controls for preventing or reducing both the frequency and severity of operational risk events, BBVA ensures at all times that sufficient capital is available to cover any expected or unexpected losses that may occur.
7.7. Risk concentration
Policies for preventing excessive risk concentration
In order to prevent the build-up of excessive concentrations of credit risk at the individual, country and sector levels, BBVA Group maintains maximum permitted risk concentration indices updated at individual and portfolio sector levels tied to the various observable variables within the field of credit risk management.
Together with the limits for individual concentration, the Group uses the Herfindahl index to measure the concentration of the Group's portfolio and the banking group's subsidiaries. At the BBVA Group level, the index reached implies a "very low" degree of concentration.
The limit on the Group’s exposure or financial commitment to a specific customer therefore depends on the customer’s credit rating, the nature of the risks involved, and the Group’s presence in a given market, based on the following guidelines:
Risk concentrations by geography
The breakdown of the main figures in the most significant foreign currencies in the accompanying consolidated balance sheets is set forth in Appendix XII.
Sovereign risk concentration
Sovereign risk management
The risk associated with the transactions involving sovereign risk is identified, measured, controlled and tracked by a centralized unit integrated in the BBVA Group’s Risk Area. Its basic functions involve the preparation of reports in the countries where sovereign risk exists (called “financial programs”), tracking such risks, assigning ratings to these countries and, in general, supporting the Group in terms of reporting requirements for any transactions involving sovereign risk. The risk policies established in the financial programs are approved by the relevant risk committees.
The country risk unit tracks the evolution of the risks associated with the various countries to which the Group are exposed (including sovereign risk) on an ongoing basis in order to adapt its risk and mitigation policies to any macroeconomic and political changes that may occur. Moreover, it regularly updates its internal ratings and forecasts for these countries. The methodology is based on the assessment of quantitative and qualitative parameters which are in line with those used by certain multilateral organizations such as the International Monetary Fund (IMF) and the World Bank, rating agencies and export credit organizations.
For additional information on sovereign risk in Europe see Appendix XII.
Valuation and impairment methods
The valuation methods used to assess the instruments that are subject to sovereign risks are the same ones used for other instruments included in the relevant portfolios and are detailed in Note 8.
Specifically, the fair value of sovereign debt securities of European countries has been considered equivalent to their listed price in active markets (Level 1 as defined in Note 8).
Risk related to the developer and Real-Estate sector in Spain
One of the main Group activities of the Group in Spain is focused on developer and mortgage loans. The policies and strategies established by the Group to deal with risks related to the developer and real-estate sector are explained below:
Policies and strategies established by the Group to deal with risks related to the developer and real-estate sector
BBVA has teams specializing in the management of the Real-Estate Sector risk, given its economic importance and specific technical component. This specialization is not only in the Risk-Acceptance teams, but throughout the handling, commercial, problem risks and legal, etc. It also includes the research department of the BBVA Group (BBVA Research), which helps determine the medium/long-term vision needed to manage this portfolio. Specialization has been increased and the management teams in the areas of recovery and the Real Estate Unit itself have been reinforced.
The policies established to address the risks related to the developer and real-estate sector, aim to accomplish, among others, the following objectives: to avoid concentration in terms of customers, products and regions; to estimate the risk profile for the portfolio; and to anticipate possible worsening of the portfolio.
Specific policies for analysis and admission of new developer risk transactions
In the analysis of new operations, the assessment of the commercial operation in terms of the economic and financial viability of the project has been one of the constant points that have helped ensure the success and transformation of construction land operations for customers’ developments.
With regard the participation of the Risk Acceptance teams, they have a direct link and participate in the committees of areas such as Recoveries and the Real Estate Unit. This guarantees coordination and exchange of information in all the processes.
The following strategies have been implemented with customers in the developer sector: avoidance of large corporate transactions, which had already reduced their share in the years of greatest market growth; non active participation in the second-home market; commitment to public housing financing; and participation in land operations with a high level of urban development security, giving priority to land open to urban development.
Risk monitoring policies
The base information for analyzing the real estate portfolios is updated monthly. The tools used include the so-called “watch-list”, which is updated monthly with the progress of each client under watch, and the different strategic plans for management of special groups. There are plans that involve an intensification of the review of the portfolio for financing land, while, in the case of ongoing promotions, they are classified based on the rate of progress of the projects.
These actions have enabled BBVA to identify possible impairment situations, by always keeping an eye on BBVA’s position with each customer (whether or not as first creditor). In this regard, key aspects include management of the risk policy to be followed with each customer, contract review, deadline extension, improved collateral, rate review (repricing) and asset purchase.
Proper management of the relationship with each customer requires knowledge of various aspects such as the identification of the source of payment difficulties, an analysis of the company’s future viability, the updating of the information on the debtor and the guarantors (their current situation and business course, economic-financial information, debt analysis and generation of funds), and the updating of the appraisal of the assets offered as collateral.
BBVA has a classification of debtors in accordance with legislation in force in each country, usually categorizing each one’s level of difficulty for each risk.
Based on the information above, a decision is made whether to use the refinancing tool, whose objective is to adjust the structure of the maturity of the debt to the generation of funds and the customer’s payment capacity.
As for the policies relating to risk refinancing with the developer and real-estate sector, they are the same as the general policies used for all of the Group’s risks (see Note 7.3.6). In the developer and real estate sector, they are based on clear solvency and viability criteria for projects, with demanding terms for additional guarantees and legal compliance, given a refinancing tool that standardizes criteria and variables when considering any refinancing operation.
In the case of refinancing, the tools used for enhancing the Bank’s position are: the search for new intervening parties with proven solvency and initial payment to reduce the principal debt or outstanding interest; the improvement of the debt bond in order to facilitate the procedure in the event of default; the provision of new or additional collateral; and making refinancing viable with new conditions (period, rate and repayments), adapted to a credible and sufficiently verified business plan.
Policies applied in the management of real estate assets in Spain
The policy applied for managing these assets depends on the type of real-estate asset, as detailed below.
For quantitative information about the risk related to the developer and Real-Estate sector in Spain see Appendix XII.
8. Fair value
8.1 Fair value of financial instrument
The fair value of financial instrument is defined as the price that would be received to sell an asset or paid to transfer a liability in an orderly transaction between market participants at the measurement date. It is therefore a market-based measurement and not specific to each entity.
All financial instruments, both assets and liabilities are initially recognized at fair value, which at that point is equivalent to the transaction price, unless there is evidence to the contrary in the market. Subsequently, depending on the type of financial instrument, it may continue to be recognized at amortized cost or fair value through adjustments in the consolidated income statement or equity.
When possible, the fair value is determined as the market price of a financial instrument. However, for many of the financial assets and liabilities of the Group, especially in the case of derivatives, there is no market price available, so its fair value is estimated on the basis of the price established in recent transactions involving similar instruments or, in the absence thereof, by using mathematical measurement models that are sufficiently tried and trusted by the international financial community. The estimates of the fair value derived from the use of such models take into consideration the specific features of the asset or liability to be measured and, in particular, the various types of risk associated with the asset or liability. However, the limitations inherent in the measurement models and possible inaccuracies in the assumptions and parameters required by these models may mean that the estimated fair value of an asset or liability does not exactly match the price for which the asset or liability could be exchanged or settled on the date of its measurement.
As part of the process established in the Group for determining the fair value in order to ensure that financial assets and liabilities are properly valued, BBVA has established, at a geographic level, a structure of New Product Committees responsible for validating and approving new products or types of financial assets and liabilities before being contracted. Local management responsible for valuation, which are independent from the business (see Note 7) are members of these committees.
These areas are required to ensure, prior to the approval stage, the existence of not only technical and human resources, but also adequate informational sources to measure the fair value of these financial assets and liabilities, in accordance with the rules established by the Global Valuation Area and using models that have been validated and approved by the Risk Analytics & Innovation Department that reports to Global Risk Management.
Additionally, for financial assets and liabilities that show significant uncertainty in inputs or model parameters used for valuation, criteria is established to measure said uncertainty and activity limits are set based on these. Finally, these measurements are compared, as much as possible, against other sources such as the measurements obtained by the business teams or those obtained by other market participants.
The process for determining the fair value requires the classification of the financial assets and liabilities according to the measurement processes used as set forth below:
Below is a comparison of the carrying amount of the Group’s financial instruments in the accompanying consolidated balance sheets and their respective fair values.
Fair Value and Carrying Amount (Millions of euros)
| 2017 | 2016 | 2015 | |||||
|---|---|---|---|---|---|---|---|
| Notes | Carrying Amount | Fair Value | Carrying Amount | Fair Value | Carrying Amount | Fair Value | |
| ASSETS | |||||||
| Cash, cash balances at central banks and other demand deposits | 9 | 42,680 | 42,680 | 40,039 | 40,039 | 29,282 | 29,282 |
| Financial assets held for trading | 10 | 64,695 | 64,695 | 74,950 | 74,950 | 78,326 | 78,326 |
| Financial assets designated at fair value through profit or loss | 11 | 2,709 | 2,709 | 2,062 | 2,062 | 2,311 | 2,311 |
| Available-for-sale financial assets | 12 | 69,476 | 69,476 | 79,221 | 79,221 | 113,426 | 113,426 |
| Loans and receivables | 13 | 431,521 | 438,991 | 465,977 | 468,844 | 471,828 | 480,539 |
| Held-to-maturity investments | 14 | 13,754 | 13,865 | 17,696 | 17,619 | - | - |
| Derivatives – Hedge accounting | 15 | 2,485 | 2,485 | 2,833 | 2,833 | 3,538 | 3,538 |
| LIABILITIES | |||||||
| Financial liabilities held for trading | 10 | 46,182 | 46,182 | 54,675 | 54,675 | 55,202 | 55,202 |
| Financial liabilities designated at fair value through profit or loss | 11 | 2,222 | 2,222 | 2,338 | 2,338 | 2,649 | 2,649 |
| Financial liabilities at amortized cost | 22 | 543,713 | 562,230 | 589,210 | 594,190 | 606,113 | 613,247 |
| Derivatives – Hedge accounting | 15 | 2,880 | 2,880 | 2,347 | 2,347 | 2,726 | 2,726 |
Not all financial assets and liabilities are recorded at fair value, so below we provide the information on financial instruments recorded at fair value and subsequently the information of those recorded at cost (including their fair value), although this value is not used when accounting for these instruments.
8.1.1 Fair value of financial instrument recognized at fair value, according to valuation criteria
The following table shows the financial instruments carried at fair value in the accompanying consolidated balance sheets, broken down by the measurement technique used to determine their fair value:
Fair Value of financial Instruments by Levels
| 2017 | 2016 | 2015 | ||||||||
|---|---|---|---|---|---|---|---|---|---|---|
| Notes | Level 1 | Level 2 | Level 3 | Level 1 | Level 2 | Level 3 | Level 1 | Level 2 | Level 3 | |
| ASSETS | ||||||||||
| Financial assets held for trading | 10 | 29,057 | 35,349 | 289 | 32,544 | 42,221 | 184 | 37,922 | 40,240 | 164 |
| Loans and advances to customers | - | 56 | - | - | 154 | - | - | 65 | - | |
| Debt securities | 21,107 | 1,444 | 22 | 26,720 | 418 | 28 | 32,381 | 409 | 34 | |
| Equity instruments | 6,688 | 33 | 80 | 4,570 | 9 | 96 | 4,336 | 106 | 93 | |
| Derivatives | 1,262 | 33,815 | 187 | 1,254 | 41,640 | 60 | 1,205 | 39,661 | 36 | |
| Financial assets designated at fair value through profit or loss | 11 | 2,061 | 648 | - | 2,062 | - | 2,246 | 2 | 62 | |
| Loans and advances to customers | - | 648 | - | - | - | - | - | - | ||
| Loans and advances to credit institutions | - | - | - | - | - | - | - | - | 62 | |
| Debt securities | 174 | - | - | 142 | - | - | 173 | - | - | |
| Equity instruments | 1,888 | - | - | 1,920 | - | - | 2,074 | 2 | - | |
| Available-for-sale financial assets | 57,381 | 11,082 | 544 | 62,125 | 15,894 | 637 | 97,113 | 15,477 | 236 | |
| Debt securities | 54,850 | 10,948 | 454 | 58,372 | 15,779 | 429 | 92,963 | 15,260 | 86 | |
| Equity instruments | 2,531 | 134 | 90 | 3,753 | 115 | 208 | 4,150 | 217 | 150 | |
| Hedging derivatives | 15 | - | 2,483 | 2 | 41 | 2,792 | - | 59 | 3,478 | - |
| LIABILITIES | ||||||||||
| Financial liabilities held for trading | 10 | 11,191 | 34,866 | 125 | 12,502 | 42,120 | 53 | 14,074 | 41,079 | 50 |
| Derivatives | 1,183 | 34,866 | 119 | 952 | 42,120 | 47 | 1,037 | 41,079 | 34 | |
| Short positions | 10,008 | - | 6 | 11,550 | - | 6 | 13,038 | - | 16 | |
| Financial liabilities designated at fair value through profit or loss | 11 | - | 2,222 | - | - | 2,338 | - | - | 2,649 | - |
| Derivatives – Hedge accounting | 15 | 274 | 2,606 | - | 94 | 2,189 | 64 | - | 2,594 | 132 |
The heading “Available-for-sale financial assets” in the accompanying consolidated balance sheets as of December 31, 2017, 2016 and 2015, additionally includes €469 million, €565 and €600 million for equity instruments, respectively, for financial assets accounted for at cost, as indicated in the section of this Note entitled “Financial instruments at cost”.
Financial instruments carried at fair value corresponding to the companies that belong to Banco Provincial Group in Venezuela whose balance is denominated in “bolivares fuertes” are classified under Level 3 in the above tables (see Note 2.2.20).
The following table sets forth the main valuation techniques, hypothesis and inputs used in the estimation of fair value of the financial instruments classified under Levels 2 and 3, based on the type of financial asset and liability and the corresponding balances as of December 31, 2017:
Fair Value of financial Instruments by Levels. December 2017 (Millions of euros)
| Level 2 | Level 3 | Valuation technique(s) | Observable inputs | Unobservable inputs | |
|---|---|---|---|---|---|
| ASSETS | |||||
| Financial assets held for trading | 35,349 | 289 | |||
| Loans and advances | 56 | - | Present-value method (Discounted future cash flows) |
- Issuer's credit risk
- Current market interest rates |
|
| Debt securities | 1,444 | 22 | Present-value method (Discounted future cash flows) Observed prices in non active markets |
- Issuer's credit risk
- Current market interest rates - Non active makets prices |
- Prepayment rates
- Issuer's credit risk - Recovery rates |
| Equity instrument | 33 | 80 | Comparable pricing (Observable price in a similar market) Present-value method |
- Brokers quotes
- Market operations - NAVs published |
- NAV provided by the administrator of the fund |
| Derivatives | 33,815 | 187 | |||
| Interest rate |
Interest rate products (Interest rate swaps, Call money Swaps y FRA): Discounted cash flows
Caps/Floors: Black, Hull-White y SABR Bond options: Black Swaptions: Black, Hull-White y LGM Other Interest rate options: Black, Hull-White y LGM Constant Maturity Swaps: SABR |
- Exchange rates
- Market quoted future prices - Market interest rates - Underlying assets prices: shares, funds, commodities - Market observable volatilities - Issuer credit spread levels - Quoted dividends - Market listed correlations |
- Beta
- Implicit correlations between tenors - Interest rates volatility |
||
| Equity |
Future and Equity Forward: Discounted future cash flows
Equity Options: Local Volatility, Momentum adjustment |
- Volatility of volatility
- Implicit assets correlations - Long term implicit correlations - Implicit dividends and long term repos |
|||
| Foreign exchange and gold |
Future and Equity Forward: Discounted future cash flows
Foreign exchange Options: Local Volatility, moments adjustment |
- Volatility of volatility
- Implicit assets correlations - Long term implicit correlations |
|||
| Credit | Credit Derivatives: Default model and Gaussian copula |
- Correlation default
- Credit spread - Recovery rates - Interest rate yield - Default volatility |
|||
| Commodities | Commodities: Momentum adjustment and Discounted cash flows | ||||
| Other | |||||
| Financial assets designated at fair value through profit or loss | 648 | - | |||
| Loans and advances | 648 | - | Present-value method (Discounted future cash flows) |
- Issuer's credit risk
- Current market interest rates |
- Prepayment rates
- Issuer credit risk - Recovery rates |
| Debt securities | - | - | Present-value method (Discounted future cash flows) |
- Issuer's credit risk
- Current market interest rates |
- Prepayment rates
- Issuer credit risk - Recovery rates |
| Equity instrument | - | - | Comparable pricing (Observable price in a similar market) Present-value method |
- Brokers quotes
- Market operations - NAVs published |
- NAV provided by the administrator of the fund |
| Available-for-sale financial assets | 11,082 | 544 | |||
| Debt securities | 10,948 | 454 |
Present-value method
(Discounted future cash flows) Oberved prices in non active markets |
- Issuer's credit risk
- Current market interest rates - Non active market prices |
- Prepayment rates
- Issuer credit risk - Recovery rates |
| Equity instruments | 134 | 90 | Comparable pricing (Observable price in a similar market) Present-value method |
- Brokers quotes
- Market operations - NAVs published |
- NAV provided by the administrator of the fund |
| Hedging derivatives | 2,483 | 2 | |||
| Interest rate |
Interest rate products (Interest rate swaps, Call money Swaps y FRA): Discounted cash flows
Caps/Floors: Black, Hull-White y SABR Bond options: Black Swaptions: Black, Hull-White y LGM Other Interest rate options: Black, Hull-White y LGM Constant Maturity Swaps: SABR |
- Exchange rates
- Market quoted future prices - Market interest rates - Underlying assets prices: shares, funds, commodities - Market observable volatilities - Issuer credit spread levels - Quoted dividends - Market listed correlations |
|||
| Equity |
Future and Equity Forward: Discounted future cash flows
Equity Options: Local Volatility, Momentum adjustment |
||||
| Foreign exchange and gold |
Future and Equity Forward: Discounted future cash flows
Foreign exchange Options: Local Volatility, moments adjustment |
||||
| Credit | Credit Derivatives: Default model and Gaussian copula | ||||
| Commodities | Commodities: Momentum adjustment and Discounted cash flows |
Fair Value of financial Instruments by Levels. December 2017 (Millions of euros)
| Level 2 | Level 3 | Valuation technique(s) | Observable inputs | Unobservable inputs | |
|---|---|---|---|---|---|
| LIABILITIES | |||||
| Financial liabilities held for trading | 34,866 | 125 | |||
| Derivatives | 34,866 | 119 | |||
| Interest rate |
Interest rate products (Interest rate swaps, Call money Swaps y FRA): Discounted cash flows
Caps/Floors: Black, Hull-White ySABR Bond options: BlackSwaptions: Black, Hull-White y LGM Other Interest rate options: Black, Hull-White y LGM Constant Maturity Swaps: SABR |
-Exchange rates
-Market quoted future prices -Market interest rates -Underlying assets prices: shares, funds, commodities -Market observable volatilities -Issuer credit spread levels -Quoted dividends -Market listed correlations |
- Beta
- Correlation between tenors - interest rates volatility |
||
| Equity |
Future and Equity Forward: Discounted future cash flows
Equity Options: Local Volatility, Momentum adjustment |
<
- Volatility of volatility
- Assets correlation |
|||
| Foreign exchange and gold | Future and Equity Forward: Discounted future cash flowsForeign exchange Options: Local Volatility, moments adjustment |
- Volatility of volatility
- Assets correlation |
|||
| Credit | Credit Derivatives: Default model and Gaussian copula |
- Correlation default
- Credit spread - Recovery rates - Interest rate yield - Default volatility |
|||
| Commodities | Commodities: Momentum adjustment and Discounted cash flows | ||||
| Short positions | - | - | Present-value method (Discounted future cash flows) |
- Correlation default
- Credit spread - Recovery rates - Interest rate yield |
|
| Financial liabilities designated at fair value through profit or loss | 2,222 | - | Present-value method
(Discounted future cash flows) |
- Prepayment rates
- Issuer's credit risk - Current market interest rates |
|
| Derivatives – Hedge accounting | 2,606 | - | |||
| Interest rate |
Interest rate products (Interest rate swaps, Call money Swaps y FRA): Discounted cash flows
Caps/Floors: Black, Hull-White ySABR Bond options: Black Swaptions: Black, Hull-White y LGM Other Interest rate options: Black, Hull-White y LGM Constant Maturity Swaps: SABR |
-Exchange rates
-Market quoted future prices -Market interest rates -Underlying assets prices: shares, funds, commodities -Market observable volatilities -Issuer credit spread levels -Quoted dividends -Market listed correlations |
- Beta
- Implicit correlations between tenors - interest rates volatility |
||
| Equity |
Future and Equity Forward: Discounted future cash flows
Equity Options: Local Volatility, Momentum adjustment |
- Volatility of volatility
- Implicit assets correlations - Long term implicit correlations - Implicit dividends and long term repos |
|||
| Foreign exchange and gold | Future and Equity Forward: Discounted future cash flows Foreign exchange Options: Local Volatility, moments adjustment |
- Volatility of volatility
- Implicit assets correlations - Long term implicit correlations |
|||
| Credit | Credit Derivatives: Default model and Gaussian copula |
- Correlatio default
- Credit spread - Recovery rates - Interest rate yield - Default volatility |
|||
| Commodities | Commodities: Momentum adjustment and Discounted cash flows |
Quantitative information of unobservable inputs used to calculate Level 3 valuations is presented below as of December 31, 2017:
| Financial instrument | Valuation technique(s) | Significant unobservable inputs | Min | Average | Max | Units | |
|---|---|---|---|---|---|---|---|
| Debt Securities | Net Present Value | Credit Spread | - | 78.27 | 399.93 | b.p. | |
| Recovery Rate | 7.70% | 32.70% | 34.58% | % | |||
| Comparable pricing | 0.00% | 82.15% | 207.70% | % | |||
| Equity instruments | Net Asset Value | ||||||
| Comparable pricing | |||||||
| Credit Option | Gaussian Copula | Correlation Default | 35.19% | 43.92% | 57.82% | % | |
| Corporate Bond Option | Black 76 | Price Volatility | - | - | - | vegas | |
| Equity OTC Option | Heston | Forward Volatility Skew | 56.63 | 56.63 | 56.63 | vegas | |
| Local Volatility | Dividends | ||||||
| Volatility | 1.89 | 22.96 | 77.03 | vegas | |||
| FX OTC Options | Black Scholes/Local vol | Volatility | 0.78 | 7.67 | 15.47 | vegas | |
| Interest Rate Option | Libor Market Model | Beta | 0.25 | 9.00 | 18.00 | % | |
| Correlation Rate/Credit | (100) | - | 100 | % | |||
| Credit Default Volatility | - | - | - | vegas | |||
The main techniques used for the assessment of the majority of the financial instruments classified in Level 3, and its main unobservable inputs, are described below:
Adjustments to the valuation for risk of default
The credit valuation adjustments (“CVA”) and debit valuation adjustments (“DVA”) are a part of derivative instrument valuations, both financial assets and liabilities, to reflect the impact in the fair value of the credit risk of the counterparty and BBVA, respectively.
These adjustments are calculated by estimating Exposure At Default, Probability of Default and Loss Given Default, for all derivative products on any instrument at the legal entity level (all counterparties under a same ISDA / CMOF) in which BBVA has exposure.
As a general rule, the calculation of CVA is done through simulations of market and credit variables to calculate the expected positive exposure, given the Exposure at Default and multiplying the result by the Loss Given Default of the counterparty. Consequently, the DVA is calculated as the result of the expected negative exposure given the Exposure at Default and multiplying the result by the Loss Given Default of the counterparty. Both calculations are performed throughout the entire period of potential exposure.
The information needed to calculate the exposure at default and the loss given default come from the credit markets (Credit Default Swaps or iTraxx Indexes), where rating is available. For those cases where the rating is not available, BBVA implements a mapping process based on the sector, rating and geography to assign probabilities of both probability of default and loss given default, calibrated directly to market or with an adjustment market factor for the probability of default and the historical expected loss.
The amounts recognized in the consolidated balance sheet as of December 31, 2017 related to the valuation adjustments to the credit assessment of the derivative asset as “Credit Valuation Adjustments” (“CVA”) and the derivative liabilities as “Debit Valuation Adjustment” (DVA) were €-153 million and €138 million respectively. The impact recorded under “Gains or (-) losses on financial assets and liabilities held for trading, net” in the consolidated income statement as for the years ended 2017 and 2016 corresponding to the mentioned adjustments was a net impact of -€23 million and €46 million respectively. Additionally, as of December 31, 2017, €-10 million related to the “Funding Valuation Adjustments” (“FVA”) were recognized in the consolidated balance sheet.
Financial assets and liabilities classified as Level 3
The changes in the balance of Level 3 financial assets and liabilities included in the accompanying consolidated balance sheets during 2017, 2016 and 2015, are as follows:
Financial Assets Level 3: Changes in the Period (Millions of euros)
| 2017 | 2016 | 2015 | ||||
|---|---|---|---|---|---|---|
| Assets | Liabilities | Assets | Liabilities | Assets | Liabilities | |
| Balance at the beginning | 822 | 116 | 463 | 182 | 601 | 98 |
| Group incorporations | - | - | - | - | 148 | - |
| Changes in fair value recognized in profit and loss (*) | (24) | (21) | 33 | (86) | 124 | (100) |
| Changes in fair value not recognized in profit and loss | (45) | - | (81) | (3) | 27 | (123) |
| Acquisitions, disposals and liquidations (**) | 32 | 320 | 438 | (25) | (510) | 89 |
| Net transfers to Level 3 | 106 | (39) | 16 | - | 145 | - |
| Exchange differences and others | (55) | (250) | (47) | 49 | (71) | 219 |
| Balance at the end | 835 | 125 | 822 | 116 | 463 | 182 |
As of December 31, 2017, the profit/loss on sales of financial instruments classified as Level 3 recognized in the accompanying consolidated income statement was not material.
Transfers between levels
The Global Valuation Area, in collaboration with the Technology and Methodology Area, has established the rules for a proper financials instruments held for trading classification according to the fair value hierarchy defined by international accounting standards.
On a monthly basis, any new assets added to the portfolio are classified, according to this criterion, by the accounting subsidiary. Then, there is a quarterly review of the portfolio in order to analyze the need for a change in classification of any of these assets.
The financial instruments transferred between the different levels of measurement for the year ended December 31, 2017 are recorded at the following amounts in the accompanying consolidated balance sheets as of December 31, 2017:
Transfer Between Levels. December 2017 (Millions of euros)
| From: | Level 1 | Level 2 | Level 3 | ||||
|---|---|---|---|---|---|---|---|
| To: | Level 2 | Level 3 | Level 1 | Level 3 | Level 1 | Level 2 | |
| ASSETS | |||||||
| Financial assets held for trading | 14 | 1 | 38 | 7 | - | - | |
| Available-for-sale financial assets | 101 | 50 | 130 | 25 | - | - | |
| 115 | 50 | 169 | 31 | - | - | ||
| LIABILITIES- | - | - | - | - | - | - | |
| Total | - | - | - | - | - | - | |
The amount of financial instruments that were transferred between levels of valuation for the year ended December 31, 2017 is not material relative to the total portfolios, and corresponds to the above changes in the classification between levels these financial instruments modified some of their features, specifically:
Sensitivity Analysis
Sensitivity analysis is performed on financial instruments with significant unobservable inputs (financial instruments included in level 3), in order to obtain a reasonable range of possible alternative valuations. This analysis is carried out on a monthly basis, based on the criteria defined by the Global Valuation Area taking into account the nature of the methods used for the assessment and the reliability and availability of inputs and proxies used. In order to establish, with a sufficient degree of certainty, the valuating risk that is incurred in such assets without applying diversification criteria between them.
As of December 31, 2017, the effect on profit for the period and total equity of changing the main unobservable inputs used for the measurement of Level 3 financial instruments for other reasonably possible unobservable inputs, taking the highest (most favorable input) or lowest (least favorable input) value of the range deemed probable, would be as follows:
Financial Assets Level 3: Sensitivity Analysis (Millions of euros)
| Potential Impact on Consolidated Income Statement | Potential Impact on Total Equity | |||
|---|---|---|---|---|
| Most Favorable Hypothesis | Least Favorable Hypothesis | Most Favorable Hypothesis | Least Favorable Hypothesis | |
| ASSETS | 7 | (18) | - | - |
| Financial assets held for trading | - | (3) | - | - |
| Debt securities | 4 | (12) | - | - |
| Equity instruments | 3 | (3) | - | - |
| Derivatives | - | - | 12 | (20) |
| Available-for-sale financial assets | - | - | 8 | (8) |
| Debt securities | - | - | 4 | (12) |
| Equity instruments | - | - | - | - |
| LIABILITIES | - | - | - | - |
| Financial liabilities held for trading | 1 | - | - | - |
| Total | 7 | (18) | 12 | (20) |
8.1.2 Fair value of financial instruments carried at cost
The valuation technique used to calculate the fair value of financial assets and liabilities carried at cost are presented below:
The following table presents the fair value of key financial instruments carried at amortized cost in the accompanying consolidated balance sheets as of December 31, 2017, 2016 and 2015, broken down according to the method of valuation used for the estimation:
Fair Value of financial Instruments at amortized cost by Levels (Millions of euros)
| 2017 | 2016 | 2015 | ||||||||
|---|---|---|---|---|---|---|---|---|---|---|
| Notes | Level 1 | Level 2 | Level 3 | Level 1 | Level 2 | Level 3 | Level 1 | Level 2 | Level 3 | |
| ASSETS | ||||||||||
| Cash, cash balances at central banks and other demand deposits | 9 | 41,969 | - | 711 | 39,373 | - | 666 | 28,961 | - | 322 |
| Loans and receivables | - | 9,475 | 429,517 | - | 10,991 | 457,853 | - | 7,681 | 472,858 | |
| Held-to-maturity investments | 13,708 | 138 | 19 | 17,567 | 11 | 41 | - | - | - | |
| LIABILITIES | ||||||||||
| Financial liabilities at amortized cost | - | - | 562,230 | - | - | 594,190 | - | - | 613,247 | |
The main valuation techniques and inputs used to estimate the fair value of financial instruments accounted for at cost and classified in levels 2 and 3 is shown below. These are broken down by type of financial instrument and the balances correspond to those as of December 31, 2017:
Fair Value of financial Instruments by Levels. December 2017 (Millions of euros)
| Level 2 | Level 3 | Valuation technique(s) | Main inputs used | |
|---|---|---|---|---|
| ASSETS | ||||
| Loans and receivables | 9,475 | 429,517 |
Present-value method (Discounted future cash flows) |
|
| Central Banks | - | 7,300 | - Credit spread - Prepayment rates - Interest rate yield |
|
| Loans and advances to credit institutions | - | 26,654 | - Credit spread - Prepayment rates - Interest rate yield |
|
| Loans and advances to customers | 134 | 394,562 | - Credit spread - Prepayment rates - Interest rate yield |
|
| Debt securities | 9,341 | 999 | - Credit spread - Interest rate yield |
|
| Held-to-maturity investments | 138 | 19 | ||
| Debt securities | 138 | 19 | Present-value method (Discounted future cash flows) |
- Credit spread - Interest rate yield |
| LIABILITIES | ||||
| Financial liabilities at amortized cost | - | 562,230 | ||
| Central Banks | - | 37,057 | Present-value method (Discounted future cash flows) |
- Issuer´s credit risk - Prepayment rates - Interest rate yield |
| Loans and advances to credit institutions | - | 54,496 | ||
| Loans and advances to customers | - | 381,947 | ||
| Debt securities | - | 59,272 | ||
| Other financial liabilities | - | 29,459 |
Financial instruments at cost
As of December 31, 2017, 2016 and 2015 there were equity instruments and certain discretionary profit- sharing arrangements in some entities which were recognized at cost in the Group’s consolidated balance sheets because their fair value could not be reliably determined, as they were not traded in organized markets and reliable unobservable inputs are not available. On the above dates, the balances of these financial instruments recognized in the portfolio of available-for-sale financial assets amounted to €469 million, €565 million and €600, respectively.
The table below outlines such financial instruments carried at cost that were sold during the year ended December 31, 2017, 2016 and 2015:
Sales of financial instruments carrie at cost (Millions of euros)
| 2017 | 2016 | 2015 | |
|---|---|---|---|
| Amount of Sale (A) | 21 | 201 | 33 |
| Carrying Amount at Sale Date (B) | 15 | 58 | 22 |
| Gains (Losses) (A-B) | 6 | 142 | 11 |
8.2 Assets measured at fair value on a non-recurring basis
As indicated in Note 2.2.4, non-current assets held for sale are measured at the lower of their fair value less costs to sell and its carrying amount. As of December 31, 2017 nearly the entire book value of the non-current assets held for sale from foreclosures or recoveries approximate their fair value (see Note 20 and 21). The global valuation of the portfolio of assets has been carried out using a statistical methodology based on real estate and local macroeconomic variables.
Valuation standards
The overall rating of the portfolio of assets has been carried out using a statistical methodology based on real estate and local macroeconomic variables.
The details of each property which has been based each of the assessments are specified in the data sheet valuation of each asset.
Valuation Methodology
Overall valuation of real estate assets portfolio
The overall valuation of the portfolio of real estate assets was performed from the latest appraisal values available. This value was adjusted based on the following:
Individual valuation of real estate assets sample
The basic methods used in the valuation were as follows:
To calculate the value, once the market conditions have been analyzed, the following factors are taken into consideration:
Valuation Criteria
Real estate properties have been appraised individually considering a hypothetical stand-alone sale and not as part of a real estate portfolio type of sale.
The portfolio of Non-current assets and disposal groups classified as held for sale by type of asset and inventories as of December 31, 2017, 2016 and 2015 is provided below by hierarchy of fair value measurements:
Fair Value at Non-current assets and disposal groups classified as held for sale and inventories by levels (Millions of euros)
| Notes | 2017 | 2016 | 2015 | |||||||
|---|---|---|---|---|---|---|---|---|---|---|
| Level 2 | Level 3 | Total | Level 2 | Level 3 | Total | Level 2 | Level 3 | Total | ||
| Non-current assets and disposal groups classified as held for sale | ||||||||||
| Housing | 3,085 | 226 | 3,310 | 2,059 | 301 | 2,360 | 2,192 | 98 | 2,291 | |
| Offices, warehouses and other | 661 | 98 | 759 | 326 | 105 | 431 | 353 | 53 | 406 | |
| Land | 855 | 130 | 984 | - | 150 | 150 | 12 | 236 | 248 | |
| TOTAL | 21 | 4,600 | 454 | 5,054 | 2,385 | 556 | 2,941 | 2,557 | 388 | 2,945 |
| Inventories | ||||||||||
| Housing | 21 | - | 21 | 903 | - | 903 | 1,452 | - | 1,452 | |
| Offices, warehouses and other | 27 | - | 27 | 620 | - | 620 | 647 | - | 647 | |
| Land | - | 18 | - | - | 1,591 | 1,591 | - | 2,056 | 2,056 | |
| TOTAL | 20 | 48 | 18 | 65 | 1,523 | 1,591 | 3,114 | 2,099 | 2,056 | 4,155 |
Since the amount classified in Level 3 is not significant compared to the total consolidated assets and that the inputs used in the valuation (DRM or DFC), are very diverse based on the type and geographic location (being the typical ones used in the valuation of real estate assets of this type), they have not been disclosed.
9. Cash and cash balances at central banks and other demands deposits and Financial liabilities measured at amortized cost
The breakdown of the balance under the headings “Cash and cash balances at central banks and other demands deposits” and "Financial liabilities at amortized cost – Deposits from central banks" in the accompanying consolidated balance sheets is as follows:
Cash, cash balances at central banks and other demand deposits (Millions of euros).
| 2017 | 2016 | 2015 | |
|---|---|---|---|
| Cash on hand | 6,220 | 7,413 | 7,192 |
| Cash balances at central banks | 31,718 | 28,671 | 18,445 |
| Other demand deposits | 4,742 | 3,955 | 3,646 |
| Total | 42,680 | 40,039 | 29,282 |
Financial liabilities measured at amortized cost. Deposits from Central Banks (Millions of Euros).
10. Financial assets and liabilities held for trading
10.1 Breakdown of the balance
The breakdown of the balance under these headings in the accompanying consolidated balance sheets is as follows:
Financial Assets and Liabilities Held-for-Trading (Millions of euros)
| Notes | 2017 | 2016 | 2015 | |
|---|---|---|---|---|
| ASSETS- | ||||
| Derivatives | 35,265 | 42,955 | 40,902 | |
| Debt securities | 7.3.1 | 22,573 | 27,166 | 32,825 |
| Loans and advances | 7.3.1 | 56 | 154 | 65 |
| Equity instruments | 7.3.1 | 6,801 | 4,675 | 4,534 |
| Total | 64,695 | 74,950 | 78,326 | |
| LIABILITIES- | ||||
| Derivatives | 36,169 | 43,118 | 42,149 | |
| Short positions | 10,013 | 11,556 | 13,053 | |
| Total | 46,182 | 54,675 | 55,202 |
10.2 Debt securities
The breakdown by type of issuer of the balance under this heading in the accompanying consolidated balance sheets is as follows:
Financial Assets Held-for-Trading. Debt securities by issuer (Millions of euros)
| Notes | 2017 | 2016 | 2015 | |
|---|---|---|---|---|
| Issued by Central Banks | 1,371 | 544 | 214 | |
| Issued by public administrations | 19,344 | 23,621 | 29,240 | |
| Issued by financial institutions | 816 | 1,652 | 1,766 | |
| Other debt securities | 1,041 | 1,349 | 1,606 | |
| Total | 22,573 | 27,166 | 32,825 |
10.3 Equity instruments
The breakdown of the balance under this heading in the accompanying consolidated balance sheets is as follows:
Financial Assets Held-for-Trading: Equity instruments by Issuer (Millions of euros))
| 2017 | 2016 | 2015 | |
|---|---|---|---|
| Shares of Spanish companies | |||
| Credit institutions | 617 | 781 | 804 |
| Other sectors | 603 | 956 | 1,234 |
| Subtotal | 1,220 | 1,737 | 2,038 |
| Shares of foreign companies | |||
| Credit institutions | 345 | 220 | 255 |
| Other sectors | 5,236 | 2,718 | 2,241 |
| Subtotal | 5,581 | 2,938 | 2,497 |
| Total | 6,801 | 4,675 | 4,534 |
10.4 Derivatives
The derivatives portfolio arises from the Group’s need to manage the risks it is exposed to in the normal course of business and also to market products amongst the Group’s customers. As of December 31, 2017, 2016 and 2015, trading derivatives were mainly contracted in over-the-counter (OTC) markets, with counterparties, consisting primarily of foreign credit institutions, and are related to foreign-exchange, interest-rate and equity risk.
Below is a breakdown of the net positions by transaction type of the fair value and notional amounts of derivatives recognized in the accompanying consolidated balance sheets, divided into organized and OTC markets:
Derivatives by type of risk / by product or by type of market - December 2017 (Millions of Euros)
| Assets | Liabilities | Notional amount - Total | |
|---|---|---|---|
| Interest rate | 22,606 | 22,546 | 2,152,490 |
| OTC options | 2,429 | 2,581 | 212,554 |
| OTC other | 20,177 | 19,965 | 1,916,920 |
| Organized market options | - | - | 600 |
| Organized market other | - | - | 22,416 |
| Equity | 1,778 | 2,336 | 95,573 |
| OTC options | 495 | 1,118 | 34,140 |
| OTC other | 83 | 90 | 8,158 |
| Organized market options | 1,200 | 1,129 | 48,644 |
| Organized market other | - | - | 4,631 |
| Foreign exchange and gold | 10,371 | 10,729 | 380,404 |
| OTC options | 245 | 258 | 24,447 |
| OTC other | 10,092 | 10,430 | 348,857 |
| Organized market options | - | 3 | 104 |
| Organized market other | 34 | 37 | 6,997 |
| Credit | 489 | 517 | 30,181 |
| Credit default swap | 480 | 507 | 27,942 |
| Credit spread option | - | - | 200 |
| Total return swap | 9 | 9 | 2,039 |
| Other | - | - | - |
| Commodities | 3 | 3 | 36 |
| Other | 18 | 38 | 561 |
| DERIVATIVES | 35,265 | 36,169 | 2,659,246 |
| of which: OTC - credit institutions | 21,016 | 22,804 | 898,209 |
| of which: OTC - other financial corporations | 8,695 | 9,207 | 1,548,919 |
| of which: OTC - other | 4,316 | 2,986 | 128,722 |
Derivatives by type of risk / by product or by type of market - December 2016 (Millions of Euros)
| Assets | Liabilitiess | Notional amount - Total | |
|---|---|---|---|
| Interest rate | 25,770 | 25,322 | 1,556,150 |
| OTC options | 3,331 | 3,428 | 217,958 |
| OTC other | 22,339 | 21,792 | 1,296,183 |
| Organized market options | 1 | - | 1,311 |
| Organized market other | 100 | 102 | 40,698 |
| Equity | 2,032 | 2,252 | 90,655 |
| OTC options | 718 | 1,224 | 44,837 |
| OTC other | 109 | 91 | 5,312 |
| Organized market options | 1,205 | 937 | 36,795 |
| Organized market other | - | - | 3,712 |
| Foreign exchange and gold | 14,872 | 15,179 | 425,506 |
| OTC options | 417 | 539 | 27,583 |
| OTC other | 14,436 | 14,624 | 392,240 |
| Organized market options | 3 | - | 175 |
| Organized market other | 16 | 16 | 5,508 |
| Credit | 261 | 338 | 19,399 |
| Credit default swap | 246 | 230 | 15,788 |
| Credit spread option | - | - | 150 |
| Total return swap | 2 | 108 | 1,895 |
| Other | 14 | - | 1,565 |
| Commodities | 6 | 6 | 169 |
| Other | 13 | 22 | 1,065 |
| DERIVATIVES | 42,955 | 43,118 | 2,092,945 |
| of which: OTC - credit institutions | 26,438 | 28,005 | 806,096 |
| of which: OTC - other financial corporations | 8,786 | 9,362 | 1,023,174 |
| of which: OTC - other | 6,404 | 4,694 | 175,473 |
Derivatives by type of risk / by product or by type of market - December 2015 (Millions of Euros)
| Assets | Liabilitiess | Notional amount - Total | |
|---|---|---|---|
| Interest rate | 22,425 | 23,152 | 1,289,986 |
| OTC options | 3,291 | 3,367 | 208,175 |
| OTC other | 19,134 | 19,785 | 1,069,909 |
| Organized market options | - | - | - |
| Organized market other | - | - | 11,902 |
| Equity | 3,223 | 3,142 | 108,108 |
| OTC options | 1,673 | 2,119 | 65,951 |
| OTC other | 112 | 106 | 4,535 |
| Organized market options | 1,437 | 918 | 34,475 |
| Organized market other | 1 | - | 3,147 |
| Foreign exchange and gold | 14,706 | 15,367 | 439,546 |
| OTC options | 387 | 458 | 41,706 |
| OTC other | 14,305 | 14,894 | 395,327 |
| Organized market options | 1 | - | 109 |
| Organized market other | 13 | 16 | 2,404 |
| Credit | 500 | 441 | 33,939 |
| Credit default swap | 436 | 412 | 30,283 |
| Credit spread option | - | - | 300 |
| Total return swap | - | 28 | 1,831 |
| Other | 64 | - | 1,526 |
| Commodities | 31 | 37 | 118 |
| Other | 16 | 10 | 675 |
| DERIVATIVES | 40,902 | 42,149 | 1,872,373 |
| of which: OTC - credit institutions | 23,385 | 28,343 | 974,604 |
| of which: OTC - other financial corporations | 9,938 | 8,690 | 688,880 |
| of which: OTC - other | 6,122 | 4,177 | 156,828 |
11. Financial assets and liabilities designated at fair value through profit or loss
The breakdown of the balance under these headings in the accompanying consolidated balance sheets is as follows:
Financial assets and liabilities designated at fair value through profit or loss (Millions of euros)
| Notes | 2017 | 2016 | 2015 | |
|---|---|---|---|---|
| ASSETS- | ||||
| Equity instruments | 1,888 | 1,920 | 2,075 | |
| Unit-linked products | 1,621 | 1,749 | 1,960 | |
| Other securities | 266 | 171 | 115 | |
| Debt securities | 174 | 142 | 173 | |
| Loans and advances to customers | 648 | - | 62 | |
| Total | 7.3.1 | 2,709 | 2,062 | 2,311 |
| LIABILITIES- | ||||
| Other financial liabilities | 2,222 | 2,338 | 2,649 | |
| Unit-linked products | 2,222 | 2,338 | 2,649 | |
| Total | 2,222 | 2,338 | 2,649 |
As of December 31, 2017, 2016 and 2015, the most significant balances within financial assets and liabilities designated at fair value through profit or loss related to assets and liabilities linked to insurance products where the policyholder bears the risk ("Unit-Link"). This type of product is sold only in Spain, through BBVA Seguros SA, insurance and reinsurance and in Mexico through Seguros Bancomer S.A. de CV.
Since the liabilities linked to insurance products in which the policyholder assumes the risk are valued the same way as the assets associated to these insurance products, there is no credit risk component borne by the Group in relation to these liabilities.
12. Available-for-sale financial assets
12.1 Available-for-sale financial assets - Balance details
The breakdown of the balance by the main financial instruments in the accompanying consolidated balance sheets is as follows:
Available-for-Sale Financial Assets (Millons of euros)
12.2 Debt securities
The breakdown of the balance under the heading “Debt securities” of the accompanying financial statements, broken down by the nature of the financial instruments, is as follows
Available-for-sale financial assets: Debt Securities. December 2017 (Millions of euros)
| Amortized Cost (*) | Unrealized Gains | Unrealized Losses | Book Value | |
|---|---|---|---|---|
| Domestic Debt Securities | ||||
| Spanish Government and other general governments agencies debt securities | 22,765 | 791 | (17) | 23,539 |
| Other debt securities | 1,951 | 114 | - | 2,066 |
| Issued by Central Banks | - | - | - | - |
| Issued by credit institutions | 891 | 72 | - | 962 |
| Issued by other issuers | 1,061 | 43 | - | 1,103 |
| Subtotal | 24,716 | 906 | (17) | 25,605 |
| Foreign Debt Securities | ||||
| Mexico | 9,755 | 45 | (142) | 9,658 |
| Mexican Government and other general governments agencies debt securities | 8,101 | 34 | (120) | 8,015 |
| Other debt securities | 1,654 | 11 | (22) | 1,643 |
| Issued by Central Banks | - | - | - | - |
| Issued by credit institutions | 212 | 1 | (3) | 209 |
| Issued by other issuers | 1,442 | 10 | (19) | 1,434 |
| The United States | 12,479 | 36 | (198) | 12,317 |
| Government securities | 8,625 | 8 | (133) | 8,500 |
| US Treasury and other US Government agencies | 3,052 | - | (34) | 3,018 |
| States and political subdivisions | 5,573 | 8 | (99) | 5,482 |
| Other debt securities | 3,854 | 28 | (65) | 3,817 |
| Issued by Central Banks | - | - | - | - |
| Issued by credit institutions | 56 | 1 | - | 57 |
| Issued by other issuers | 3,798 | 26 | (65) | 3,759 |
| Turkey | 5,052 | 48 | (115) | 4,985 |
| Turkey Government and other general governments agencies debt securities | 5,033 | 48 | (114) | 4,967 |
| Other debt securities | 19 | 1 | (1) | 19 |
| Issued by Central Banks | - | - | - | - |
| Issued by credit institutions | 19 | - | (1) | 19 |
| Issued by other issuers | - | - | - | - |
| Other countries | 13,271 | 533 | (117) | 13,687 |
| Other foreign governments and other general governments agencies debt securities | 6,774 | 325 | (77) | 7,022 |
| Other debt securities | 6,497 | 208 | (40) | 6,664 |
| Issued by Central Banks | 1,330 | 2 | (1) | 1,331 |
| Issued by credit institutions | 2,535 | 139 | (19) | 2,654 |
| Issued by other issuers | 2,632 | 66 | (19) | 2,679 |
| Subtotal | 40,557 | 661 | (572) | 40,647 |
| Total | 65,273 | 1,567 | (589) | 66,251 |
Available-for-sale financial assets: Debt Securities. December 2016 (Millions of euros)
| Amortized Cost (*) | Unrealized Gains | Unrealized Losses | Book Value | |
|---|---|---|---|---|
| Domestic Debt Securities | ||||
| Spanish Government and other general governments agencies debt securities | 22,427 | 711 | (18) | 23,119 |
| Other debt securities | 2,305 | 117 | (1) | 2,421 |
| Issued by Central Banks | - | - | - | - |
| Issued by credit institutions | 986 | 82 | - | 1,067 |
| Issued by other issuers | 1,319 | 36 | (1) | 1,354 |
| Subtotal | 24,731 | 828 | (19) | 25,540 |
| Foreign Debt Securities | ||||
| Mexico | 11,525 | 19 | (343) | 11,200 |
| Mexican Government and other general governments agencies debt securities | 9,728 | 11 | (301) | 9,438 |
| Other debt securities | 1,797 | 8 | (42) | 1,763 |
| Issued by Central Banks | - | - | - | - |
| Issued by credit institutions | 86 | 2 | (1) | 87 |
| Issued by other issuers | 1,710 | 6 | (41) | 1,675 |
| The United States | 14,256 | 48 | (261) | 14,043 |
| Government securities | 8,460 | 9 | (131) | 8,337 |
| US Treasury and other US Government agencies | 1,702 | 1 | (19) | 1,683 |
| States and political subdivisions | 6,758 | 8 | (112) | 6,654 |
| Other debt securities | 5,797 | 39 | (130) | 5,706 |
| Issued by Central Banks | - | - | - | - |
| Issued by credit institutions | 95 | 2 | - | 97 |
| Issued by other issuers | 5,702 | 37 | (130) | 5,609 |
| Turkey | 5,550 | 73 | (180) | 5,443 |
| Turkey Government and other general governments agencies debt securities | 5,055 | 70 | (164) | 4,961 |
| Other debt securities | 495 | 2 | (16) | 482 |
| Issued by Central Banks | - | - | - | - |
| Issued by credit institutions | 448 | 2 | (15) | 436 |
| Issued by other issuers | 47 | - | (1) | 46 |
| Other countries | 17,923 | 634 | (203) | 18,354 |
| Other foreign governments and other general governments agencies debt securities | 7,882 | 373 | (98) | 8,156 |
| Other debt securities | 10,041 | 261 | (105) | 10,197 |
| Issued by Central Banks | 1,657 | 4 | (2) | 1,659 |
| Issued by credit institutions | 3,269 | 96 | (54) | 3,311 |
| Issued by other issuers | 5,115 | 161 | (49) | 5,227 |
| Subtotal | 49,253 | 773 | (987) | 49,040 |
| Total | 73,985 | 1,601 | (1,006) | 74,580 |
Available-for-sale financial assets: Debt Securities. December 2015 (Millions of euros))
| Amortized Cost (*) | Unrealized Gains | Unrealized Losses | Book Value | |
|---|---|---|---|---|
| Domestic Debt Securities | ||||
| Spanish Government and other general governments agencies debt securities | 38,763 | 2,078 | (41) | 40,799 |
| Other debt securities | 4,737 | 144 | (11) | 4,869 |
| Issued by Central Banks | - | - | - | - |
| Issued by credit institutions | 2,702 | 94 | - | 2,795 |
| Issued by other issuers | 2,035 | 50 | (11) | 2,074 |
| Subtotal | 43,500 | 2,221 | (53) | 45,668 |
| Foreign Debt Securities | ||||
| Mexico | 12,627 | 73 | (235) | 12,465 |
| Mexican Government and other general governments agencies debt securities | 10,284 | 70 | (160) | 10,193 |
| Other debt securities | 2,343 | 4 | (75) | 2,272 |
| Issued by Central Banks | - | - | - | - |
| Issued by credit institutions | 260 | 1 | (7) | 254 |
| Issued by other issuers | 2,084 | 3 | (68) | 2,019 |
| The United States | 13,890 | 63 | (236) | 13,717 |
| Government securities | 6,817 | 13 | (41) | 6,789 |
| US Treasury and other US Government agencies | 2,188 | 4 | (15) | 2,177 |
| States and political subdivisions | 4,629 | 9 | (26) | 4,612 |
| Other debt securities | 7,073 | 50 | (195) | 6,927 |
| Issued by Central Banks | - | - | - | - |
| Issued by credit institutions | 71 | 5 | (1) | 75 |
| Issued by other issuers | 7,002 | 45 | (194) | 6,852 |
| Turkey | 13,414 | 116 | (265) | 13,265 |
| Turkey Government and other general governments agencies debt securities | 11,801 | 111 | (231) | 11,682 |
| Other debt securities | 1,613 | 4 | (34) | 1,584 |
| Issued by Central Banks | - | - | - | - |
| Issued by credit institutions | 1,452 | 3 | (30) | 1,425 |
| Issued by other issuers | 162 | 1 | (4) | 159 |
| Other countries | 22,803 | 881 | (490) | 23,194 |
| Other foreign governments and other general government agencies debt securities | 9,778 | 653 | (76) | 10,356 |
| Other debt securities | 13,025 | 227 | (414) | 12,838 |
| Issued by Central Banks | 2,277 | - | (4) | 2,273 |
| Issued by credit institutions | 3,468 | 108 | (88) | 3,488 |
| Issued by other issuers | 7,280 | 119 | (322) | 7,077 |
| Subtotal | 62,734 | 1,132 | (1,226) | 62,641 |
| Total | 106,234 | 3,354 | (1,278) | 108,310 |
The credit ratings of the issuers of debt securities in the available-for-sale portfolio as of December 31, 2017, 2016 and 2015, are as follows:
Debt Securities by Rating
| December 2017 | December 2016 | December 2015 | ||||
|---|---|---|---|---|---|---|
| Fair Value (Millions of Euros) | % | Fair Value (Millions of Euros) | % | Fair Value (Millions of Euros) | % | |
| AAA | 687 | 1.0% | 4,922 | 6.6% | 1,842 | 1.7% |
| AA+ | 10,738 | 16.2% | 11,172 | 15.0% | 10,372 | 9.6% |
| AA | 507 | 0.8% | 594 | 0.8% | 990 | 0.9% |
| AA- | 291 | 0.4% | 575 | 0.8% | 938 | 0.9% |
| A+ | 664 | 1.0% | 1,230 | 1.6% | 1,686 | 1.6% |
| A | 683 | 1.0% | 7,442 | 10.0% | 994 | 0.9% |
| A- | 1,330 | 2.0% | 1,719 | 2.3% | 4,826 | 4.5% |
| BBB+ | 35,175 | 53.1% | 29,569 | 39.6% | 51,885 | 47.9% |
| BBB | 7,958 | 12.0% | 3,233 | 4.3% | 23,728 | 21.9% |
| BBB- | 5,583 | 8.4% | 6,809 | 9.1% | 5,621 | 5.2% |
| BB+ or below | 1,564 | 2.4% | 2,055 | 2.8% | 2,639 | 2.4% |
| Without rating | 1,071 | 1.6% | 5,261 | 7.1% | 2,789 | 2.6% |
| Total | 66,251 | 100.0% | 74,580 | 100.0% | 108,310 | 100.0% |
12.3 Equity instruments
The breakdown of the balance under the heading "Equity instruments" of the accompanying financial statements as of December 2017, 2016 and 2015, is as follows:
Available-for-sale financial assets: Equity Instruments. December 2017 (Millions of euros)
| Amortized Cost | Unrealized Gains | Unrealized Losses | Fair Value | |
|---|---|---|---|---|
| Equity instruments listed | ||||
| Listed Spanish company shares | 2,189 | - | (1) | 2,188 |
| Credit institutions | - | - | - | - |
| Other entities | 2,189 | - | (1) | 2,188 |
| Listed foreign company shares | 215 | 33 | (7) | 241 |
| United States | 11 | - | - | 11 |
| México | 8 | 25 | - | 33 |
| Turkey | 4 | 1 | - | 5 |
| Other countries | 192 | 7 | (7) | 192 |
| Subtotal | 2,404 | 33 | (8) | 2,429 |
| Unlisted equity instruments | ||||
| Unlisted Spanish company shares | 33 | 29 | - | 62 |
| Credit institutions | 4 | - | - | 4 |
| Other entities | 29 | 29 | - | 58 |
| Unlisted foreign companies shares | 665 | 77 | (8) | 734 |
| United States | 498 | 40 | (6) | 532 |
| México | 1 | - | - | 1 |
| Turkey | 15 | 6 | (2) | 19 |
| Other countries | 151 | 31 | - | 182 |
| Subtotal | 698 | 106 | (8) | 796 |
| Total | 3,102 | 139 | (16) | 3,224 |
Available-for-sale financial assets: Equity Instruments. December 2016 (Millions of euros)
| Amortized Cost | Unrealized Gains | Unrealized Losses | Fair Value | |
|---|---|---|---|---|
| Equity instruments listed | ||||
| Listed Spanish company shares | 3,690 | 17 | (944) | 2,763 |
| Credit institutions | - | - | - | - |
| Other entities | 3,690 | 17 | (944) | 2,763 |
| Listed foreign company shares | 793 | 289 | (15) | 1,066 |
| United States | 16 | 22 | - | 38 |
| México | 8 | 33 | - | 41 |
| Turkey | 5 | 1 | - | 6 |
| Other countries | 763 | 234 | (15) | 981 |
| Subtotal | 4,483 | 306 | (960) | 3,829 |
| Unlisted equity instruments | ||||
| Unlisted Spanish company shares | 57 | 2 | (1) | 59 |
| Credit institutions | 4 | - | - | 4 |
| Other entities | 53 | 2 | (1) | 55 |
| Unlisted foreign companies shares | 708 | 46 | (2) | 752 |
| United States | 537 | 13 | - | 550 |
| México | 1 | - | - | 1 |
| Turkey | 18 | 7 | (2) | 24 |
| Other countries | 152 | 26 | - | 178 |
| Subtotal | 766 | 48 | (3) | 811 |
| Total | 5,248 | 355 | (962) | 4,641 |
Available-for-sale financial assets: Equity Instruments. December 2015 (Millions of euros)
| Amortize Cost | Unrealized Gains | Unrealized Losses | Fair Value | |
|---|---|---|---|---|
| Equity instruments listed | ||||
| Listed Spanish company shares | 3,402 | 17 | (558) | 2,862 |
| Credit institutions | - | - | - | - |
| Other entities | 3,402 | 17 | (558) | 2,862 |
| Listed foreign company shares | 1,027 | 392 | (44) | 1,375 |
| United States | 41 | 21 | - | 62 |
| Mexico | 9 | 42 | (10) | 40 |
| Turkey | 6 | 4 | (5) | 6 |
| Other countries | 972 | 325 | (29) | 1,267 |
| Subtotal | 4,430 | 409 | (602) | 4,236 |
| Unlisted equity instruments | ||||
| Unlisted Spanish company shares | 74 | 5 | (1) | 78 |
| Credit institutions | 4 | 1 | - | 6 |
| Other entities | 69 | 3 | (1) | 72 |
| Unlisted foreign companies shares | 701 | 108 | (7) | 802 |
| United States | 549 | 5 | - | 554 |
| Mexico | 1 | - | - | 1 |
| Turkey | 21 | 13 | (6) | 27 |
| Other countries | 130 | 91 | (1) | 220 |
| Subtotal | 775 | 113 | (8) | 880 |
| Total | 5,204 | 522 | (610) | 5,116 |
12.4 Gains/losses
The changes in the gains/losses, net of taxes, recognized under the equity heading “Accumulated other comprehensive income – Items that may be reclassified to profit or loss- Available-for-sale financial assets” in the accompanying consolidated balance sheets are as follows:
Accumulated other comprehensive income-Items that may be reclassified to profit or loss - Available-for-Sale Financial Assets (Millions of euros)
| 2017 | 2016 | 2015 | |
|---|---|---|---|
| Balance at the beginning | 947 | 1,674 | 3,816 |
| Valuation gains and losses | 321 | 400 | (1,222) |
| Amounts transferred to income | 356 | (1,181) | (1,844) |
| Other reclassifications | (10) | 116 | - |
| Income tax | 27 | (62) | 924 |
| Balance at the end | 1,641 | 947 | 1,674 |
| Of which: | |||
| Debt securities | 1,557 | 1,629 | 1,769 |
| Equity instruments | 84 | (682) | (95) |
Debt securities
In 2017, the debt securities recoveries recognized in the heading “Impairment or reversal of impairment on financial assets not measured at fair value through profit or loss- Available- for-sale financial assets” in the accompanying consolidated income statement amounted to €4 million. In the 2016 and 2015 the impairment recognized were €157 and €1 million, respectively (see Note 47).
For the rest of debt securities, 94.7% of the unrealized losses recognized under the heading "Accumulated other comprehensive income - Items that may be reclassified to profit or loss– Available-for-sale financial assets” and originating in debt securities were generated over more than twelve months. However, no impairment was recognized, as following an analysis of these unrealized losses we concluded that they were temporary due to the following reasons: the interest payment dates of all the fixed-income securities have been satisfied; and because there is no evidence that the issuer will not continue to meet its payment obligations, nor that future payments of both principal and interest will not be sufficient to recover the cost of the debt securities.
Equity instruments
As of December 31, 2017, the Group’s most significant investment in equity instruments classified as available for sale was the participation in Telefónica, S.A. (Telefónica), which accounted for approximately 70% of the portfolio of equity instruments classified as available for sale financial assets. The Group periodically monitors the valuation of this investment, taking into account the volatility of the share price and the estimated amount recoverable through its sale in the market.
BBVA considers that the use of volatility is an appropriate reference for categorizing investments with similar risk profiles when determining if there is a significant prolonged decline in value. The comparison of the volatility of Telefónica’s shares with other market benchmarks shows a clearly lower level of volatility in these shares.
As of December 29, 2017 (last session of the year), the share price of Telefónica closed at €8.125 per share, so the unrealized losses recognized under the heading “Accumulated other comprehensive income - Items that may be reclassified to profit or loss– Available-for-sale financial assets” resulting from equity instruments, it would amount to €1,123 million.
As of December 31, 2017, the Group carried out the analysis described in Note 2.2.1, recording the aforementioned unrealized losses under the heading “Impairment or reversal of impairment on financial assets not measured at fair value through profit or loss - Available-for-sale financial assets" in the income statement for the year 2017.
As mentioned above, these losses were recorded in "Accumulated other comprehensive income”, therefore, as of December 31, 2017, the total equity of the Group is not affected (see Note 32.1).
13. Loans and receivables
13.1 Loans and advances - Balance details
The breakdown of the balance under this heading in the accompanying consolidated balance sheets, according to the nature of the financial instrument, is as follows:
Loans and Receivables (Millions of euros)
| 2017 | 2016 | 2015 | |
|---|---|---|---|
| Debt securities | 10,339 | 11,209 | 10,516 |
| Loans and advances to central banks | 7,300 | 8,894 | 17,830 |
| Loans and advances to credit institutions | 26,261 | 31,373 | 29,317 |
| Loans and advances to customers | 387,621 | 414,500 | 414,165 |
| Total | 431,521 | 465,977 | 471,828 |
13.2 Loans and advances to central banks and credit institutions
The breakdown of the balance under this heading in the accompanying consolidated balance sheets, according to their nature, is as follows:
Loans and Advances to Central Banks and Credit Institutions (Millions of euros)
| Notes | 2017 | 2016 | 2015 | |
|---|---|---|---|---|
| Loans and advances to central banks | 7.3.1 | 7,300 | 8,894 | 17,830 |
| Loans and advances to credit institutions | 7.3.1 | 26,261 | 31,373 | 29,317 |
| Reverse repurchase agreements | 35 | 13,861 | 15,561 | 11,749 |
| Other loans | 12,400 | 15,812 | 17,568 | |
| Total | 33,561 | 40,267 | 47,148 | |
| Of which: | ||||
| Impairment losses | 7.3.4 / 7.3.1 | (36) | (43) | (51) |
13.3 Loans and advances to customers
The breakdown of the balance under this heading in the accompanying consolidated balance sheets, according to their nature, is as follows:
Loans and Advances to Customers (Millions of euros)
| Notes | 2017 | 2016 | 2015 | |
|---|---|---|---|---|
| On demand and short notice | 10,560 | 11,251 | 11,228 | |
| Credit card debt | 15,835 | 16,596 | 16,952 | |
| Trade receivables | 22,705 | 23,753 | 23,871 | |
| Finance leases | 8,642 | 9,442 | 9,357 | |
| Reverse repurchase loans | 35 | 11,554 | 7,291 | 5,052 |
| Other term loans | 313,336 | 339,862 | 341,554 | |
| Advances other than not loans | 4,989 | 6,306 | 6,151 | |
| Total | 7.3.1 | 387,621 | 414,500 | 414,165 |
| Of which: | ||||
| Impaired assets | 7.3.4 | 19,390 | 22,915 | 25,333 |
| Impairment losses | 7.3.4 / 7.3.1 | (12,748) | (15,974) | (18,691) |
As of December 31, 2017, 2016 and 2015, 38%, 34% and 32%, respectively, of "Loans and advances to customers" with maturity greater than one year have fixed-interest rates and 62%, 66% and 68%, respectively, have variable interest rates.
The heading “Loans and receivables – Loans and advances to customers” in the accompanying consolidated balance sheets also includes certain secured loans that, as mentioned in Appendix X and pursuant to the Mortgage Market Act, are linked to long-term mortgage-covered bonds. This heading also includes some loans that have been securitized. The balances recognized in the accompanying consolidated balance sheets corresponding to these securitized loans are as follows:
Securitized Loans (Millions of euros)
| 2017 | 2016 | 2015 | |
|---|---|---|---|
| Securitized mortgage assets | 28,950 | 29,512 | 28,955 |
| Other securitized assets | 4,143 | 3,731 | 3,666 |
| Total | 33,093 | 33,243 | 32,621 |
13.4 Debt securities
The breakdown of the balance under this heading in the accompanying consolidated balance sheets, according to the issuer of the debt security, is as follows:
Debt securities (Millions of euros)
| Notes | 2017 | 2016 | 2015 | |
|---|---|---|---|---|
| Government | 4,412 | 4,709 | 3,275 | |
| Credit institutions | 31 | 37 | 125 | |
| Other sectors | 5,911 | 6,481 | 7,126 | |
| Total gross | 7.3.1 | 10,354 | 11,226 | 10,526 |
| Impairment losses | (15) | (17) | (10) | |
| Total net | 10,339 | 11,209 | 10,516 |
In 2016, some debt securities were reclassified from "Available-for-sale financial assets" to “Loans and receivables-Debt securities” since the intention of the Group regarding how to manage such securities is to hold them until maturity. The following table shows the fair value and carrying amounts of these reclassified financial assets:
Debt Securities reclassified to "Loans and receivables" from "Available-for-sale financial assets" (Millions of euros)
| As of Reclassification date | As of December 31, 2017 | As of December 31, 2016 | ||||
|---|---|---|---|---|---|---|
| Carrying Amount | Fair Value | Carrying Amount | Fair Value | Carrying Amount | Fair Value | |
| BBVA, S.A. | 862 | 862 | 715 | 735 | 844 | 863 |
| Total | 862 | 862 | 715 | 735 | 844 | 863 |
As of December 31, 2017 and 2016, the amount recognized in the income statement from the valuation at amortized cost of the reclassified financial assets, as well as the impact recognized on the income statement and under the heading “Total Equity - Accumulated other comprehensive income”, if the reclassification was not performed is included in the following table.
Effect on Income Statement and Other Comprehensive Income (Millions of euros)
| As of December 31, 2017 | As of December 31, 2016 | |||||
|---|---|---|---|---|---|---|
| Recognized in | Effect of not Reclassifying in | Recognized in | Effect of not Reclassifying in | |||
| Income Statement | Income Statement | Equity "Valuation Adjustments" | Income Statement | Income Statement | Equity "Valuation Adjustments" | |
| BBVA, S.A. | 26 | 26 | 4 | 22 | 22 | (5) |
| Total | 26 | 26 | 4 | 22 | 22 | (5) |
14. Held-to-maturity investments
The breakdown of the balance under this heading in the accompanying consolidated balance sheets, according to the according to the issuer of the financial instrument, is as follows:
Held-to-maturity investments. Debt Securities (*) (Millions of euros)
| 2017 | 2016 | |
|---|---|---|
| Domestic Debt Securities | ||
| Spanish Government and other general governments agencies debt securities | 5,754 | 8,063 |
| Other debt securities | 230 | 562 |
| Issued by Central Banks | - | - |
| Issued by credit institutions | 203 | 494 |
| Issued by other issuers | 27 | 68 |
| Subtotal | 5,984 | 8,625 |
| Foreign Debt Securities | ||
| Mexico | - | - |
| The United States | - | - |
| Turkey | 5,400 | 6,184 |
| Turkey Government and other general governments agencies debt securities | 4,515 | 5,263 |
| Other debt securities | 885 | 921 |
| Issued by Central Banks | - | - |
| Issued by credit institutions | 845 | 876 |
| Issued by other issuers | 40 | 45 |
| Other countries | 2,370 | 2,887 |
| Other foreign governments and other general governments agencies debt securities | 2,349 | 2,719 |
| Other debt securities | 21 | 168 |
| Issued by Central Banks | - | - |
| Issued by credit institutions | - | 146 |
| Issued by other issuers | 21 | 22 |
| Subtotal | 7,770 | 9,071 |
| Total | 13,754 | 17,696 |
As of December 31, 2017 and 2016, the credit ratings of the issuers of debt securities classified as held-to- maturity investments were as follows:
Held to maturity investments. Debt Securities by Rating
| December 2017 | December 2016 | |||
|---|---|---|---|---|
| Book value (Millions of Euros) | % | Book value (Millions of Euros) | % | |
| AAA | - | - | - | - |
| AA+ | - | - | - | - |
| AA | 41 | 0.3% | 43 | 0.2% |
| AA- | - | - | 134 | 0.8% |
| A+ | 55 | 0.4% | - | - |
| A | - | - | - | - |
| A- | - | - | - | - |
| BBB+ | 5.667 | 41.2% | 10,472 | 59.2% |
| BBB | 2,412 | 17.5% | 591 | 3.3% |
| BBB- | 2,818 | 20.5% | 5,187 | 29.3% |
| BB+ or below | 1.696 | 12.3% | - | - |
| Without rating | 1,064 | 7.7% | 1,270 | 7.2% |
| Total | 13,754 | 100.0% | 17,696 | 100.0% |
In 2016, some debt securities were reclassified from “Available-for-sale financial assets” to “Held-to-maturity investments” amounting to €17,650 million. This reclassification has been carried out once past the two-year penalty established in IAS-39 standard (penalization which meant not being able to keep maturity portfolio due to the significant sales that occurred in the year 2013) and since the intention of the Group regarding how to manage such securities, is to hold them until maturity. The following table shows the fair value and carrying amounts of these reclassified financial assets:
Debt Securities reclassified to "Held to Maturity Investments" (Millions of euros)
| As of Reclassification date | As of December 31, 2017 (*) | As of December 31, 2016 (*) | ||||
|---|---|---|---|---|---|---|
| Carrying Amount | Fair Value | Carrying Amount | Fair Value | Carrying Amount | Fair Value | |
| BBVA, S.A. | 11,162 | 11,162 | 6,521 | 6,551 | 9,589 | 9,635 |
| TURKIYE GARANTI BANKASI, A.S | 6,488 | 6,488 | 5,381 | 5,392 | 6,230 | 6,083 |
| Total | 17,650 | 17,650 | 11,902 | 11,943 | 15,819 | 15,718 |
The fair value carrying amount of these financials asset on the date of the reclassification becomes its new amortized cost. The previous gain on that asset that has been recognized in “Accumulated other comprehensive income – Items that may be reclassified to profit or loss - Available for sale financial assets” is amortized to profit or loss over the remaining life of the held-to-maturity investment using the effective interest method. Any difference between the new amortized cost and maturity amount is also amortized over the remaining life of the financial asset using the effective interest method, similar to the amortization of a premium and a discount. This reclassification was triggered by a change in the Group ́s strategy regarding the management of these securities.
The following table for the years ended December 31, 2017 and 2016, includes the amount recognized in the income statement from the valuation at amortized cost of the reclassified financial assets. The Table also provides the impact recognized on the income statement and under the heading “Total Equity - Accumulated other comprehensive income”, if the reclassification had not been performed.
Effect on Income Statement and Other Comprehensive Income (Millions of euros)
| As of December 31, 2017 | As of December 31, 2016 | |||||
|---|---|---|---|---|---|---|
| Recognized in | Effect of not Reclassifying | Recognized in | Effect of not Reclassifying | |||
| Income Statement | Income Statement | Equity "Accumulated other comprehensive income" | Income Statement | Income Statement | Equity "Accumulated other comprehensive income" | |
| BBVA, S.A. | 172 | 172 | (18) | 230 | 230 | (86) |
| TURKIYE GARANTI BANKASI, A.S | 545 | 545 | (16) | 326 | 326 | (225) |
| Total | 717 | 717 | (34) | 557 | 557 | (311) |
15. Hedging derivatives and fair value changes of the hedged items in portfolio hedges of interest rate risk
The balance of these headings in the accompanying consolidated balance sheets is as follows:
Derivatives – Hedge accounting and fair value changes of the hedged items in portfolio hedge of interest rate risk (Millions of euros)
| 2017 | 2016 | 2015 | |
|---|---|---|---|
| ASSETS- | |||
| Hedging Derivatives | 2,485 | 2,833 | 3,538 |
| Fair value changes of the hedged items in portfolio hedges of interest rate risk | (25) | 17 | 45 |
| LIABILITIES- | |||
| Hedging Derivatives | 2,880 | 2,347 | 2,726 |
| Fair value changes of the hedged items in portfolio hedges of interest rate risk | (7) | - | 358 |
As of December 31, 2017, 2016 and 2015, the main positions hedged by the Group and the derivatives designated to hedge those positions were:
Note 7 analyze the Group’s main risks that are hedged using these derivatives.
The details of the net positions by hedged risk of the fair value of the hedging derivatives recognized in the accompanying consolidated balance sheets are as follows:
Hedging Derivatives Breakdown by type of risk and type of hedge (Millions of euros)
| 2017 | 2016 | 2015 | ||||
|---|---|---|---|---|---|---|
| Assets | Liabilities | Assets | Liabilities | Assets | Liabilities | |
| Interest rate | 1,141 | 850 | 1,154 | 974 | 1,660 | 875 |
| OTC options | 100 | 111 | 125 | 118 | 187 | 128 |
| OTC other | 1,041 | 739 | 1,029 | 856 | 1,473 | 747 |
| Organized market options | - | - | - | - | - | - |
| Organized market other | - | - | - | - | - | - |
| Equity | - | - | - | 50 | 12 | 74 |
| OTC options | - | - | - | 50 | - | 72 |
| OTC other | - | - | - | - | 12 | 2 |
| Organized market options | - | - | - | - | - | - |
| Organized market other | - | - | - | - | - | - |
| Foreign exchange and gold | 625 | 511 | 817 | 553 | 675 | 389 |
| OTC options | - | - | - | - | - | - |
| OTC other | 625 | 511 | 817 | 553 | 675 | 388 |
| Organized market options | - | - | - | - | - | - |
| Organized market other | - | - | - | - | - | - |
| Credit | - | - | - | - | - | - |
| Commodities | - | - | - | - | - | - |
| Other | - | - | - | - | - | - |
| FAIR VALUE HEDGES | 1,766 | 1,362 | 1,970 | 1,577 | 2,347 | 1,337 |
| Interest rate | 244 | 533 | 194 | 358 | 204 | 319 |
| OTC options | - | - | - | - | - | - |
| OTC other | 242 | 533 | 186 | 358 | 204 | 318 |
| Organized market options | - | - | - | - | - | - |
| Organized market other | 2 | - | 8 | - | - | 1 |
| Equity | - | - | - | - | - | - |
| Foreign exchange and gold | 119 | 714 | 248 | 118 | 242 | 34 |
| OTC options | - | - | 89 | 70 | 42 | 12 |
| OTC other | 119 | 714 | 160 | 48 | 200 | 22 |
| Organized market options | - | - | - | - | - | - |
| Organized market other | - | - | - | - | - | - |
| Credit | - | - | - | - | - | - |
| Commodities | - | - | - | - | - | - |
| Other | - | - | - | - | - | - |
| CASH FLOW HEDGES | 363 | 1,247 | 442 | 476 | 446 | 353 |
| HEDGE OF NET INVESTMENTS IN A FOREIGN OPERATION | 301 | 15 | 362 | 79 | 47 | 304 |
| PORTFOLIO FAIR VALUE HEDGES OF INTEREST RATE RISK | 46 | 256 | 55 | 214 | 697 | 732 |
| PORTFOLIO CASH FLOW HEDGES OF INTEREST RATE RISK | 9 | - | 4 | - | - | - |
| DERIVATIVES-HEDGE ACCOUNTING | 2,485 | 2,880 | 2,833 | 2,347 | 3,538 | 2,726 |
| of which: OTC - credit institutions | 1,829 | 2,527 | 2,381 | 2,103 | 3,413 | 2,366 |
| of which: OTC - other financial corporations | 651 | 234 | 435 | 165 | 95 | 256 |
| of which: OTC - other | 2 | 120 | 9 | 79 | 29 | 103 |
The cash flows forecasts for the coming years for cash flow hedging recognized on the accompanying consolidated balance sheet as of December 31, 2017 are:
Cash Flows of Hedging Instruments (Millions of euros)
| 3 Months or Less | From 3 Months to 1 Year | From 1 to 5 Years | More than 5 Years | Total | |
|---|---|---|---|---|---|
| Receivable cash inflows | 144 | 407 | 2,237 | 2,287 | 5,076 |
| Payable cash outflows | 144 | 491 | 2,703 | 2,348 | 5,686 |
The above cash flows will have an impact on the Group’s consolidated income statements until 2057.
In 2017, 2016 and 2015, there was no reclassification in the accompanying consolidated income statements of any amount corresponding to cash flow hedges that was previously recognized in equity (see note 41).
The amount for derivatives designated as accounting hedges that did not pass the effectiveness test in December 31, 2017, 2016 and 2015 were not material.
16. Investments in joint ventures and associates
16.1 Joint ventures and associates
The breakdown of the balance of “Investments in joint ventures and associates” (see Note 2.1) in the accompanying consolidated balance sheets is as follows:
Joint Ventures and Associates Entities. Breakdown by entities (Millions of euros)
| 2017 | 2016 | 2015 | |
|---|---|---|---|
| Joint ventures | |||
| Fideic F 403853 5 Bbva Bancom Ser.Zibata | 27 | 33 | 44 |
| Fideicomiso 1729 Invex Enajenacion de Cartera | 53 | 57 | 66 |
| PSA Finance Argentina Compañia Financier | 14 | 21 | 23 |
| Altura Markets, S.V., S.A. | 64 | 19 | 20 |
| RCI Colombia | 19 | 17 | - |
| Other joint ventures | 79 | 82 | 91 |
| Subtotal | 256 | 229 | 243 |
| Associates Entities | |||
| Metrovacesa Suelo y Promoción, S.A. | 697 | 208 | - |
| Testa Residencial SOCIMI, S.A.U. | 444 | 91 | - |
| Metrovacesa Promoción y Arrendamientos, S.A. | - | 67 | - |
| Atom Bank, PLC | 66 | 43 | - |
| Brunara | - | - | 54 |
| Metrovacesa | - | - | 351 |
| Servired | 9 | 11 | 92 |
| Other associates | 116 | 116 | 139 |
| Subtotal | 1,332 | 536 | 636 |
| Total | 1,588 | 765 | 879 |
Details of the joint ventures and associates as of December 31, 2017 are shown in Appendix II.
The following is a summary of the changes in the in December 31, 2017, 2016 and 2015 under this heading in the accompanying consolidated balance sheets:
Joint Ventures and Associates Entities. Changes in the Year (Millions of euros)
| Notes | 2017 | 2016 | 2015 | |
|---|---|---|---|---|
| Balance at the beginning | 765 | 879 | 4,509 | |
| Acquisitions and capital increases | 868 | 456 | 464 | |
| Disposals and capital reductions | (8) | (91) | (32) | |
| Transfers and changes of consolidation method | - | (351) | (3,850) | |
| Share of profit and loss | 39 | 3 | 25 | 174 |
| Exchange differences | (29) | (34) | (250) | |
| Dividends, valuation adjustments and others | (12) | (118) | (136) | |
| Balance at the end | 1,588 | 765 | 879 |
The variation during the year 2017 is mainly explained by the increase of BBVA Group stakes in Testa Residencial, S.A. and Metrovacesa Suelo y Promoción, S.A Promociones through its contribution to the capital increases carried out by both entities by contributing assets from the Bank’s real estate assets (see Note 21).
During the year 2016, two capital increases in Metrovacesa, S.A were made through a debt swap and a contribution of real estate assets, which provided the Group 357 million euros, after this there was a partial Split of Metrovacesa, S.A in favor of a beneficiary company from a new constitution denominated Metrovacesa Suelo y Promocion, S.A. In the fourth quarter of the year 2016, there was a total split of Metrovacesa, S.A through its extinction and division of its patrimony in three parts, two of which merged with Merlin Properties, SOCIMI, S.A and Testa Residencial, SOCIMI, S.A. As result of the previous mentioned splits, the Group received equity interests in the corresponding beneficiary companies, 6.41% of its capital was received, having been transferred to the heading "Available-for-sale” of the consolidated financial assets as of December 31, 2016.
The variation in 2015 was mainly explained by the change of the method of consolidation of Garanti (see Note 3) and by the capital increase in Metrovacesa, S.A, for compensation credits amounting to 159 million euros.
Appendix III provides notifications on acquisitions and disposals of holdings in subsidiaries, joint ventures and associates, in compliance with Article 155 of the Corporations Act and Article 53 of the Securities Market Act 24/1988.
16.2 Other information about associates and joint ventures
If these entities had been consolidated rather than accounted for using the equity method, the change in each of the lines of balance sheet and the consolidated income statement would not be significant.
As of December 31, 2017, 2016 and 2015 there was no financial support agreement or other contractual commitment to associates and joint ventures entities from the holding or the subsidiaries that are not recognized in the financial statements (see Note 53.2).
As of December 31, 2017, 2016 and 2015 there was no contingent liability in connection with the investments in joint ventures and associates (see Note 53.2).
16.3 Impairment
As described in IAS 36, when there is indicator of impairment, the book value of the associates and joint venture entities should be compared with their recoverable amount, being the latter calculated as the higher between the value in use and the fair value minus the cost of sale. As of December 31, 2017, 2016 and 2015, there were no significant impairments recognized.
17. Tangible assets
The breakdown and movement of the balance and changes of this heading in the accompanying consolidated balance sheets, according to the nature of the related items, is as follows:
Tangible Assets. Breakdown by Type of Assets and Changes in the year 2017 (Millions of euros)
| For Own Use | Total tangible asset of Own Use | Investment Properties | Assets Leased out under an Operating Lease | Total | ||||
|---|---|---|---|---|---|---|---|---|
| Notes | Land and Buildings | Work in Progress | Furniture, Fixtures and Vehicle | |||||
| Cost | ||||||||
| Balance at the beginning | 6,176 | 240 | 7,059 | 13,473 | 1,163 | 958 | 15,594 | |
| Additions | 49 | 128 | 397 | 574 | 1 | 201 | 776 | |
| Retirements | (42) | (29) | (264) | (335) | (90) | (93) | (518) | |
| Acquisition of subsidiaries in the year | - | - | - | - | - | - | - | |
| Disposal of entities in the year | - | - | - | - | - | (552) | (552) | |
| Transfers | (273) | (57) | (186) | (516) | (698) | - | (1,214) | |
| Exchange difference and other | (420) | (48) | (378) | (844) | (148) | (22) | (1,014) | |
| Balance at the end | 5,490 | 234 | 6,628 | 12,352 | 228 | 492 | 13,072 | |
| Accrued depreciation | ||||||||
| Balance at the beginning | 1,116 | - | 4,461 | 5,577 | 63 | 216 | 5,856 | |
| Additions | 45 | 127 | - | 553 | 680 | 13 | - | 693 |
| Retirements | (26) | - | (235) | (261) | (7) | (21) | (289) | |
| Acquisition of subsidiaries in the year | - | - | - | - | - | - | - | |
| Disposal of entities in the year | - | - | - | - | - | (134) | (134) | |
| Transfers | (53) | - | (146) | (199) | (31) | - | (230) | |
| Exchange difference and other | (88) | - | (253) | (341) | (25) | 16 | (350) | |
| Balance at the end | 1,076 | - | 4,380 | 5,456 | 13 | 77 | 5,546 | |
| Impairment | ||||||||
| Balance at the beginning | 379 | - | - | 379 | 409 | 10 | 798 | |
| Additions | 48 | 5 | - | - | 5 | 37 | - | 42 |
| Retirements | (2) | - | - | (2) | (10) | - | (12) | |
| Acquisition of subsidiaries in the year | - | - | - | - | - | - | - | |
| Disposal of entities in the year | - | - | - | - | - | (10) | (10) | |
| Transfers | (58) | - | - | (58) | (276) | - | (334) | |
| Exchange difference and other | (9) | - | - | (9) | (140) | - | (149) | |
| Balance at the end | 315 | - | - | 315 | 20 | - | 335 | |
| Net tangible assets | ||||||||
| Balance at the beginning | 4,681 | 240 | 2,598 | 7,519 | 691 | 732 | 8,941 | |
| Balance at the end | 4,099 | 234 | 2,248 | 6,581 | 195 | 415 | 7,191 | |
Tangible Assets. Breakdown by Type of Assets and Changes in the year 2016 (Millions of euros)
| For Own Use | Total tangible asset of Own Use | Investment Properties | Assets Leased out under an Operating Lease | Total | ||||
|---|---|---|---|---|---|---|---|---|
| Notes | Land and Buildings | Work in Progress | Furniture, Fixtures and Vehicle | |||||
| Cost | ||||||||
| Balance at the beginning | 5,858 | 545 | 7,628 | 14,029 | 2,391 | 668 | 17,088 | |
| Additions | 30 | 320 | 563 | 913 | 62 | 337 | 1,312 | |
| Retirements | (85) | (29) | (468) | (582) | (117) | (97) | (796) | |
| Acquisition of subsidiaries in the year | - | - | - | - | - | - | - | |
| Disposal of entities in the year | (7) | - | (1) | (8) | (3) | - | (11) | |
| Transfers | 676 | (544) | (386) | (254) | (986) | 84 | (1,156) | |
| Exchange difference and other | (296) | (52) | (277) | (625) | (184) | (34) | (843) | |
| Balance at the end | 6,176 | 240 | 7,059 | 13,473 | 1,163 | 958 | 15,594 | |
| Accrued depreciation | ||||||||
| Balance at the beginning | 1,103 | - | 4,551 | 5,654 | 116 | 202 | 5,972 | |
| Additions | 45 | 106 | - | 561 | 667 | 23 | - | 690 |
| Retirements | (72) | - | (461) | (533) | (10) | (17) | (560) | |
| Acquisition of subsidiaries in the year | - | - | - | - | - | - | - | |
| Disposal of entities in the year | - | - | - | - | - | - | - | |
| Transfers | (1) | - | (37) | (38) | (55) | 55 | (38) | |
| Exchange difference and other | (20) | - | (153) | (173) | (11) | (24) | (208) | |
| Balance at the end | 1,116 | - | 4,461 | 5,577 | 63 | 216 | 5,856 | |
| Impairment | ||||||||
| Balance at the beginning | 354 | - | - | 354 | 808 | 10 | 1,172 | |
| Additions | 48 | 48 | - | 5 | 53 | 90 | - | 143 |
| Retirements | (2) | - | - | (2) | (9) | - | (11) | |
| Acquisition of subsidiaries in the year | - | - | - | - | - | - | - | |
| Disposal of entities in the year | - | - | - | - | - | - | - | |
| Transfers | (1) | - | - | (1) | (380) | - | (381) | |
| Exchange difference and other | (20) | - | (5) | (25) | (100) | - | (125) | |
| Balance at the end | 379 | - | - | 379 | 409 | 10 | 798 | |
| Net tangible assets | ||||||||
| Balance at the beginning | 4,401 | 545 | 3,077 | 8,021 | 1,467 | 456 | 9,944 | |
| Balance at the end | 4,681 | 240 | 2,598 | 7,519 | 691 | 732 | 8,941 | |
Tangible Assets. Breakdown by Type of Assets and Changes in the year 2015 (Millions of euros)
| For Own Use | Total tangible asset of Own Use | Investment Properties | Assets Leased out under an Operating Lease | Total | ||||
|---|---|---|---|---|---|---|---|---|
| Notes | Land and Buildings | Work in Progress | Furniture, Fixtures and Vehicles | |||||
| Cost | ||||||||
| Balance at the beginning | 4,168 | 1,085 | 5,904 | 11,157 | 2,180 | 674 | 14,012 | |
| Additions | 105 | 715 | 1,097 | 1,917 | 14 | 240 | 2,171 | |
| Retirements | (18) | (39) | (146) | (203) | (167) | (74) | (444) | |
| Acquisition of subsidiaries in the year | 1,378 | 78 | 1,426 | 2,882 | 738 | - | 3,620 | |
| Disposal of entities in the year | - | - | - | - | - | - | - | |
| Transfers | 718 | (1,211) | 40 | (453) | (235) | (153) | (841) | |
| Exchange difference and other | (494) | (83) | (693) | (1,271) | (139) | (19) | (1,429) | |
| Balance at the end | 5,858 | 545 | 7,628 | 14,029 | 2,391 | 668 | 17,088 | |
| Accrued depreciation | ||||||||
| Balance at the beginning | 1,255 | - | 3,753 | 5,008 | 102 | 226 | 5,335 | |
| Additions | 45 | 103 | - | 512 | 615 | 25 | - | 640 |
| Retirements | (16) | - | (129) | (145) | (10) | - | (155) | |
| Acquisition of subsidiaries in the year | 140 | - | 940 | 1,080 | 23 | - | 1,103 | |
| Disposal of entities in the year | - | - | - | - | - | - | - | |
| Transfers | (19) | - | (16) | (35) | (9) | (15) | (59) | |
| Exchange difference and other | (360) | - | (509) | (869) | (15) | (9) | (893) | |
| Saldo final | 1,103 | - | 4,551 | 5,654 | 116 | 202 | 5,972 | |
| Impairment | ||||||||
| Balance at the beginning | 148 | - | 16 | 164 | 687 | 6 | 857 | |
| Additions | 48 | 7 | - | 19 | 26 | 30 | 4 | 60 |
| Retirements | - | - | (1) | (1) | (64) | - | (65) | |
| Acquisition of subsidiaries in the year | 187 | - | - | 187 | 295 | - | 482 | |
| Disposal of entities in the year | - | - | - | - | - | - | - | |
| Transfers | 9 | - | (15) | (6) | (62) | - | (68) | |
| Exchange difference and other | 3 | - | (19) | (16) | (78) | - | (94) | |
| Balance at the end | 354 | - | - | 354 | 808 | 10 | 1,172 | |
| Net tangible assets | ||||||||
| Balance at the beginning | 2,764 | 1,085 | 2,135 | 5,985 | 1,392 | 443 | 7,819 | |
| Balance at the end | 4,401 | 545 | 3,077 | 8,021 | 1,467 | 456 | 9,944 | |
As of December 31, 2017, 2016 and 2015, the cost of fully amortized tangible assets that remained in use were €2,660, €2,313 and 2,663 million respectively while its recoverable residual value was not significant.
As of December 31, 2017, 2016 and 2015 the amount of tangible assets under financial lease schemes on which the purchase option is expected to be exercised was not material. The main activity of the Group is carried out through a network of bank branches located geographically as shown in the following table:
Branches by Geographical Location (Number of branches)
| 2017 | 2016 | 2015 | |
|---|---|---|---|
| Spain | 3,019 | 3,303 | 3,811 |
| México | 1,840 | 1,836 | 1,818 |
| South America | 1,631 | 1,667 | 1,684 |
| The United States | 651 | 676 | 669 |
| Turkey | 1,095 | 1,131 | 1,109 |
| Rest of Eurasia | 35 | 47 | 54 |
| Total | 8,271 | 8,660 | 9,145 |
The following table shows the detail of the net carrying amount of the tangible assets corresponding to Spanish and foreign subsidiaries as of December 31, 2017, 2016 and 2015:
Tangible Assets by Spanish and Foreign Subsidiaries. Net Assets Values (Millions of euros)
| 2017 | 2016 | 2015 | |
|---|---|---|---|
| BBVA and Spanish subsidiaries | 2,574 | 3,692 | 4,584 |
| Foreign subsidiaries | 4,617 | 5,249 | 5,360 |
| Total | 7,191 | 8,941 | 9,944 |
18. Intangible assets
18.1 Goodwill
The breakdown of the balance under this heading in the accompanying consolidated balance sheets, according to the cash-generating units (CGUs), is as follows:
Goodwill. Breakdown by CGU and Changes of the year (Millions of euros)
| The United States | Turkey | México | Colombia | Chile | Other | Total | |
|---|---|---|---|---|---|---|---|
| Balance as of December 31, 2014 | 4,767 | - | 638 | 208 | 65 | 20 | 5,697 |
| Additions | 12 | 788 | - | - | - | - | 800 |
| Exchange difference | 549 | (62) | (35) | (31) | (3) | (1) | 418 |
| Impairment | - | - | - | - | - | - | - |
| Other | - | - | - | - | - | - | - |
| Balance as of December 31, 2015 | 5,328 | 727 | 602 | 176 | 62 | 20 | 6,915 |
| Additions | - | - | - | - | - | 8 | 8 |
| Exchange difference | 175 | (101) | (79) | 14 | 6 | - | 15 |
| Impairment | - | - | - | - | - | - | - |
| Other | - | (1) | - | - | - | - | (1) |
| Balance as of December 31, 2016 | 5,503 | 624 | 523 | 191 | 68 | 28 | 6,937 |
| Additions | - | - | 24 | - | - | - | 24 |
| Exchange difference | (666) | (115) | (44) | (22) | (3) | (1) | (851) |
| Impairment | - | - | - | - | - | (4) | (4) |
| Other | - | - | (10) | - | (33) | - | (43) |
| Balance as of December 31, 2017 | 4,837 | 509 | 493 | 168 | 32 | 23 | 6,062 |
The change in 2015 is mainly as a result of the full consolidation of Garanti since the date of effective control (see Note 3) assigned to the CGU of Turkey and exchange differences due to the appreciation of the US Dollar against the euro and the depreciation of the other currencies.
In 2017 and 2016, there were no significant business combinations.
Impairment Test
As described in Note 2.2.8, the cash-generating units (CGUs) to which goodwill has been allocated are periodically tested for impairment by including the allocated goodwill in their carrying amount. This analysis is performed at least annually and whenever there is any indication of impairment.
Both the CGU’s fair values and the fair values assigned to its assets and liabilities had been based on the estimates and assumptions that the Group’s Management has deemed most likely given the circumstances. However, some changes to the valuation assumptions used could result in differences in the impairment test result.
Three key assumptions are used when calculating the impairment test. These hypothesis are the ones to which the amount of the recoverable value is most sensitive:
The focus used by the Group's management to determine the values of the hypotheses is based both on its projections and past experience. These values are uniform and use external sources of information. At the same time, the valuations of the most significant goodwill have in general been reviewed by independent experts (not the Group's external auditors) who apply different valuation methods according to each type of asset and liability. The valuation methods used are: The method for calculating the discounted value of future cash flows, the market transaction method and the cost method.
As of December 31, 2017, 2016 and 2015, no indicators of impairment have been identified in any of the main CGUs.
The Group’s most significant goodwill corresponds to the CGU in the United States, the main significant hypotheses used in the impairment test of this mentioned CGU are:
Impairment test hypotheses CGU Goodwill in the United States
| 2017 | 2016 | 2015 | |
|---|---|---|---|
| Discount rate | 10.0% | 10.0% | 9.8% |
| Sustainable growth rate | 4.0% | 4.0% | 4.0% |
Given the potential growth of the sector, in accordance with paragraph 33 of IAS 36, as of December 31, 2017, 2016 and 2015 the Group used a steady growth rate of 4.0% based on the real GDP growth rate of the United States and expected inflation. This 4.0% rate is less than the historical average of the past 30 years of the nominal GDP rate of the United States and lower than the real GDP growth forecasted by the IMF.
The assumptions with a greater relative weight and whose volatility could affect more in determining the present value of the cash flows starting on the fifth year are the discount rate and the sustainable growth rate. Below is shown the increased (or decreased) amount of the recoverable amount as a result of a reasonable variation (in basic points) of each of the key assumptions:
Sensitivity analysis for main hypotheses - USA (Millions of euros)
| Impact of an increase of 50 basis points (*) | Impact of a decrease of 50 basis points (*) | |
|---|---|---|
| Discount rate | (1,159) | 1,371 |
| Sustainable growth rate | 661 | (559) |
Another assumption used, and with a high impact on the impairment test, is the budgets of the CGU and specifically the effect that changes in interest rates have on cash flows. The rise in interest rates in 2017 and 2016, net interest income would be positively affected and, therefore, the recoverable amount of the CGU would increase.
Goodwill in business combinations in 2017 and 2016
There were no significant business combinations.
Goodwill in business combinations 2015
Catalunya Banc
As stated in Note 3, in the year ended December 31, 2015 the Group acquired 98.4% of the share capital of the Catalunya Banc.
Shown below are details of the carrying amount of the consolidated assets and liabilities of Catalunya Banc prior to its acquisition and the corresponding fair values, gross of tax, which have been estimated in accordance with the IFRS-3 acquisition method.
Valuation and calculation of negative goodwill for the acquisition of stake in Catalunya Banc (Millions of euros)
| Carrying Amount | Fair Value | |
|---|---|---|
| Acquisition cost (A) | - | 1,165 |
| Cash on hand | 616 | 616 |
| Financial assets held for trading | 341 | 341 |
| Available-for-sale financial assets | 1,845 | 1,853 |
| Loans and receivables | 37,509 | 36,766 |
| Held-to-maturity investments (*) | - | - |
| Fair value changes of the hedged items in portfolio hedge of interest rate risk | 23 | 23 |
| Derivatives – Hedge accounting | 845 | 845 |
| Non-current assets and disposal groups classified as held for sale | 274 | 193 |
| Investments in subsidiaries, joint ventures and associates | 209 | 293 |
| Tangible assets | 908 | 626 |
| Intangible assets | 7 | 129 |
| Other assets | 581 | 498 |
| Financial Liabilities Held for Trading | (332) | (332) |
| Financial liabilities at Amortized Cost | (41,271) | (41,501) |
| Fair value changes of the hedged items in portfolio hedge of interest rate risk | (490) | (490) |
| Derivatives – Hedge accounting | (535) | (535) |
| Provisions | (1,248) | (1,667) |
| Other liabilities | (84) | (84) |
| Deferred tax | 3,312 | 3,630 |
| Total fair value of assets and liabilities acquired (B) | - | 1,205 |
| Non controlling Interest Catalunya Banc Group (**) (C) | 2 | 2 |
| Non controlling Interest after purchase (D) | - | 12 |
| Negative Goodwill (A)-(B)+(C )+(D) | - | (26) |
Because the resulting goodwill was negative, the net fair value of identifiable assets acquired and lesser liabilities assumed was initially estimated as of June 30, 2015 in an amount of 22 million euros but subsequently the calculation was modified to 26 million euros a gain was recognized in the accompanying consolidated income statement for 2015 under the heading “Negative Goodwill” (see Note 2.2.7).
Garanti Bank
As stated in Note 3, in the year ended December 31, 2015 the Group acquired 14.89% of the share capital of the Garanti Bank.
Shown below are details of the carrying amount of the consolidated assets and liabilities of Garanti Bank prior to its acquisition and the corresponding fair values, gross of tax, which have been estimated in accordance with the IFRS-3 acquisition method.
Valuation and calculation of goodwill in Garanti Bank (Millions of euros)
| Carrying Amount | Fair Value | |
|---|---|---|
| Acquisition cost (A) | - | 5,044 |
| Cash on hand | 8,915 | 8,915 |
| Financial assets held for trading | 419 | 419 |
| Financial assets designated at fair value through profit or loss | - | - |
| Available-for-sale financial assets | 14,618 | 14,773 |
| Loans and receivables | 58,495 | 58,054 |
| Non-current assets and disposal groups classified as held for sale | - | (2) |
| Investments in subsidiaries, joint ventures and associates | 14 | 21 |
| Hedging Derivatives | 785 | 1,399 |
| Non-current assets held for sale | 11 | 1,188 |
| Other assets | 3,715 | 3,652 |
| Financial liabilities designated at fair value through profit or loss | - | - |
| Financial liabilities at Amortized Cost | (70,920) | (70,926) |
| Provisions | (394) | (697) |
| Other liabilities | (6,418) | (6,418) |
| Deferred tax | 263 | 182 |
| Total fair value of assets and liabilities acquired (B) | - | 10,560 |
| Non controlling Interest Garanti Group (C) | 5,669 | 5,669 |
| Non controlling Interest after purchase (D) | - | 635 |
| Goodwill (A)-(B)+(C )+(D) | - | 788 |
In accordance with the acquisition method, which implies to account at fair value the assets acquired and liabilities of Garanti Bank along with the intangible assets identifies, as well as the cash payment carried out by the Group related to the transaction generates goodwill.
According to IFRS-3, the calculation of goodwill may be modified during a period of one year from the acquisition date, in 2016 the Group finalized said process without significant changes. Among the adjustments to this calculation, Garanti ́s brand has been reclassified as an intangible asset with a definite useful life, with its subsequent amortization under "Amortization - Other intangible assets" in the consolidated income statement.
The main significant assumptions used in the impairment test of this mentioned CGU are::
Impairment test assumptions CGU Goodwill in Turkey
| 2017 | 2016 | 2015 | |
|---|---|---|---|
| Discount rate | 18.0% | 17.7% | 14.8% |
| Sustainable growth rate | 7.0% | 7.0% | 7.0% |
The assumptions with a greater relative weight and whose volatility could affect more in determining the present value of the cash flows starting on the fifth year are the discount rate and the growth rate. Below is shown the increased (or decreased) amount of the recoverable amount as a result of a reasonable variation (in basic points) of each of the key assumptions:
Sensitivity analysis for main assumptions - Turkey (Millions of euros)
| Impact of an increase of 50 basis points (*) | Impact of a decrease of 50 basis points (*) | |
|---|---|---|
| Discount rate | (298) | 327 |
| Sustainable growth rate | 214 | (196) |
18.2 Other intangible assets
The breakdown of the balance and changes of this heading in the accompanying consolidated balance sheets, according to the nature of the related items, is as follows:
Other intangible assets (Millions of euros)
| 2017 | 2016 | 2015 | |
|---|---|---|---|
| Computer software acquisition expenses | 1,682 | 1,877 | 1,875 |
| Other intangible assets with an infinite useful life | 12 | 12 | 26 |
| Other intangible assets with a definite useful life | 708 | 960 | 1,235 |
| Total | 2,402 | 2,849 | 3,137 |
The changes of this heading in December 31, 2017, 2016 and 2015, are as follows:
Other Intangible Assets (Millions of euros)
| Notes | 2017 | 2016 | 2015 | |
|---|---|---|---|---|
| Balance at the beginning | 2,849 | 3,137 | 1,673 | |
| Acquisition of subsidiaries in the year | - | - | 1,452 | |
| Additions | 564 | 645 | 571 | |
| Amortization in the year | 45 | (694) | (735) | (631) |
| Exchange differences and other | (305) | (196) | 76 | |
| Impairment | (12) | (3) | (4) | |
| Balance at the end | 2,402 | 2,849 | 3,137 |
As of December 31, 2017, 2016 and 2015, the balance of fully amortized intangible assets that remained in use were €1,380 million, €1,501 million and €1,238 million respectively, while their recoverable value was not significant.
19. Tax assets and liabilities
19.1 Consolidated tax group
Pursuant to current legislation, the BBVA Consolidated Tax Group includes the Bank (as the parent company) and its Spanish subsidiaries that meet the requirements provided for under Spanish legislation regulating the taxation regime for the consolidated profit of corporate groups.
The Group’s non-Spanish other banks and subsidiaries file tax returns in accordance with the tax legislation in force in each country.
19.2 Years open for review by the tax authorities
The years open to review in the BBVA Consolidated Tax Group as of December 31, 2017 are 2014 and subsequent years for the main taxes applicable.
The remainder of the Spanish consolidated entities in general have the last four years open for inspection by the tax authorities for the main taxes applicable, except for those in which there has been an interruption of the limitation period due to the start of an inspection.
In the year 2017 as a consequence of the tax authorities examination reviews, inspections were initiated through the year 2013 inclusive, and all such years closed with acceptance during the year 2017. In this way, these inspections did not constitute any material amount of the Consolidated Annual accounts due to the fact that their impact was provisioned.
In view of the varying interpretations that can be made of some applicable tax legislation, the outcome of the tax inspections of the open years that may be conducted by the tax authorities in the future may give rise to contingent tax liabilities which cannot be reasonably estimated at the present time. However, the Group considers that the possibility of these contingent liabilities becoming actual liabilities is remote and, in any case, the tax charge which might arise therefore would not materially affect the Group’s accompanying consolidated financial statements.
19.3 Reconciliation
The reconciliation of the Group’s corporate income tax expense resulting from the application of the Spanish corporation income tax rate and the income tax expense recognized in the accompanying consolidated income statements is as follows:
Reconciliation of Taxation at the Spanish Corporation Tax Rate to the Tax Expense Recorded for the Period (Millions of euros)
| 2017 | 2016 | 2015 | ||||
|---|---|---|---|---|---|---|
| Amount | Effective Tax % | Amount | Effective Tax % | Amount | Effective Tax % | |
| Profit or (-) loss before tax | 6,392 | 4,603 | ||||
| From continuing operations | 6,931 | 6,392 | 4,603 | |||
| From discontinued operations | - | - | ||||
| Taxation at Spanish corporation tax rate 30% | 2,079 | 1,918 | 1,381 | |||
| Lower effective tax rate from foreign entities(*) | (307) | (298) | (221) | |||
| Mexico | (100) | 27% | (105) | 26% | (149) | 25% |
| Chile | (29) | 21% | (27) | 17% | (28) | 18% |
| Colombia | (3) | 29% | 22 | 36% | 2 | 30% |
| Peru | (16) | 27% | (18) | 26% | (13) | 28% |
| Turkey | (182) | 21% | (176) | 21% | - | - |
| Others | 23 | 6 | (33) | |||
| Revenues with lower tax rate (dividends) | (53) | (69) | (65) | |||
| Equity accounted earnings | (2) | (11) | (74) | |||
| Other effects | 452 | 159 | 253 | |||
| Current income tax | 2,169 | 1,699 | 1,274 | |||
| Of which: | ||||||
| Continuing operations | 2,169 | 1,699 | 1,274 | |||
| Discontinued operations | - | - | - |
The effective income tax rate for the Group in the years ended December 31, 2017, 2016 and 2015 is as follows:
Effective Tax Rate (Millions of euros)
| 2017 | 2016 | 2015 | |
|---|---|---|---|
| Income from: | |||
| Consolidated Tax Group | (678) | (483) | (1,426) |
| Other Spanish Entities | 29 | 52 | 107 |
| Foreign Entities | 7,580 | 6,823 | 5,922 |
| Total | 6,931 | 6,392 | 4,603 |
| Income tax and other taxes | 2,169 | 1,699 | 1,274 |
| Effective Tax Rate | 31.3% | 26.6% | 27.7% |
In the year 2017, the changes in the nominal tax rate on corporate income tax, in comparison with those existing in the previous period, in the main countries in which the Group has a presence, have been in Chile (from 24.00% to 25.5%) and Peru (from 28.0% to 29.5%).
19.4 Income tax recognized in equity
In addition to the income tax expense recognized in the accompanying consolidated income statements, the Group has recognized the following income tax charges for these items in the consolidated total equity:
Tax recognized in total equity (Millions of euros)
| 2017 | 2016 | 2015 | |
|---|---|---|---|
| Charges to total equity | |||
| Debt securities and others | (355) | (533) | (593) |
| Equity instruments | (74) | (2) | 113 |
| Subtotal | (429) | (535) | (480) |
| Total | (429) | (535) | (480) |
19.5 Current and deferred taxes
The balance under the heading "Tax assets" in the accompanying consolidated balance sheets includes current and deferred tax assets. The balance under the “Tax liabilities” heading includes the Group’s various current and deferred tax liabilities. The details of the most important tax assets and liabilities are as follows:
Tax assets and liabilities (Millions of euros)
| 2017 | 2016 | 2015 | |
|---|---|---|---|
| Tax assets | |||
| Current tax assets | 2,163 | 1,853 | 1,901 |
| Deferred tax assets | 14,725 | 16,391 | 15,878 |
| Pensions | 395 | 1,190 | 1,022 |
| Financial Instruments | 1,453 | 1,371 | 1,474 |
| Other assets (investments in subsidiaries) | 357 | 662 | 554 |
| Impairment losses | 1,005 | 1,390 | 1,346 |
| Other | 870 | 1,236 | 981 |
| Secured tax assets (*) | 9,433 | 9,431 | 9,536 |
| Tax losses | 1,212 | 1,111 | 965 |
| Total | 16,888 | 18,245 | 17,779 |
| Tax Liabilities | |||
| Current tax liabilities | 1,114 | 1,276 | 1,238 |
| Deferred tax liabilities | 2,184 | 3,392 | 3,415 |
| Financial Instruments | 1,427 | 1,794 | 1,907 |
| Charge for income tax and other taxes | 757 | 1,598 | 1,508 |
| Total | 3,298 | 4,668 | 4,653 |
At the end of year 2017, certain fiscal reforms have taken place in some countries where the Group operates, specifically in the United States, Turkey and Argentina, that will come into force as of January 1, 2018. The main changes are the modification of the tax rates applied for year 2018 but this effect has consequences in the valuation of the deferred tax assets and liabilities at December 2017. The most significant variations of the deferred assets and liabilities in the years 2017, 2016 and 2015 derived from the followings causes:
Deferred tax assets and liabilities (Millions of euros)
| 2017 | 2016 | 2015 | ||||
|---|---|---|---|---|---|---|
| Deferred Assets | Deferred Liabilities | Deferred Assets | Deferred Liabilities | Deferred Assets | Deferred Liabilities | |
| Balance at the beginning | 16,391 | 3,392 | 15,878 | 3,418 | 10,391 | 3,177 |
| Pensions | (795) | - | 168 | - | 120 | - |
| Financials Instruments | 82 | (367) | (103) | (113) | 554 | (189) |
| Other assets | (305) | - | 108 | - | 19 | - |
| Impairment losses | (385) | - | 44 | - | 305 | - |
| Others | (366) | (841) | 255 | - | 76 | - |
| Guaranteed Tax assets | 2 | - | (105) | - | 4,655 | - |
| Tax Losses | 101 | - | 146 | - | (242) | - |
| Charge for income tax and other taxes | - | - | - | 87 | - | 430 |
| Balance at the end | 14,725 | 2,184 | 16,391 | 3,392 | 15,878 | 3,418 |
With respect to the changes in assets and liabilities due to deferred tax contained in the above table, the following should be pointed out:
On the deferred tax assets and liabilities contained in the table above, those included in section 19.4 above have been recognized against the entity's equity, and the rest against earnings for the year.
As of December 31, 2017, 2016 and 2015, the estimated amount of temporary differences associated with investments in subsidiaries, joint ventures and associates, which were not recognized deferred tax liabilities in the accompanying consolidated balance sheets, amounted to 376 million euros, 874 million euros and 656 million euros, respectively.
Of the deferred tax assets contained in the above table, the detail of the items and amounts guaranteed by the Spanish and Portuguese governments, broken down by the items that originated those assets is as follows:
Secured tax assets (Millions of euros)
| 2017 | 2016 | 2015 | |
|---|---|---|---|
| Pensions | 1,897 | 1,901 | 1,904 |
| Impairment losses | 7,536 | 7,530 | 7,632 |
| Total | 9,433 | 9,431 | 9,536 |
As of December 31, 2017, non-guaranteed net deferred tax assets of the above table amounted to €3,108 million (€3,568 and €2,924 million as of December 31, 2016 and 2015 respectively), which broken down by major geographies is as follows:
Based on the information available as of December 31, 2017, including historical levels of benefits and projected results available to the Group for the coming years, it is considered that sufficient taxable income will be generated for the recovery of above mentioned unsecured deferred tax assets when they become deductible according to the tax laws.
On the other hand, the Group has not recognized certain deductible temporary differences, negative tax bases and deductions for which, in general, there is no legal period for offsetting, amounting to approximately 2,284 million euros, which are mainly originated by Catalunya Banc.
20. Other assets and liabilities
The breakdown of the balance under these headings in the accompanying consolidated balance sheets is as follows:
Other assets and liabilities: Breakdown by nature (Millions of euros)
| 2017 | 2016 | 2015 | |
|---|---|---|---|
| ASSETS | |||
| Inventories | 229 | 3,298 | 4,303 |
| Real estate | 226 | 3,268 | 4,172 |
| Others | 3 | 29 | 131 |
| Transactions in progress | 156 | 241 | 148 |
| Accruals | 768 | 723 | 804 |
| Prepaid expenses | 509 | 518 | 558 |
| Other prepayments and accrued income | 259 | 204 | 246 |
| Other items | 3,207 | 3,012 | 3,311 |
| Total Assets | 4,359 | 7,274 | 8,565 |
| LIABILITIES | |||
| Transactions in progress | 165 | 127 | 52 |
| Accruals | 2,490 | 2,721 | 2,609 |
| Accrued expenses | 1,997 | 2,125 | 2,009 |
| Other accrued expenses and deferred income | 493 | 596 | 600 |
| Other items | 1,894 | 2,131 | 1,949 |
| Total Liabilities | 4,550 | 4,979 | 4,610 |
The heading "Inventories" includes the net book value of land and building purchases that the Group’s Real estate entities have available for sale or as part of their business. Balances under this heading include mainly real estate assets acquired by these entities from distressed customers (mostly in Spain), net of their corresponding losses. The roll-forward of our inventories from distressed customers is provided below:
Inventories from Distressed Customers (Mlions of euros)
| 2017 | 2016 | 2015 | |
|---|---|---|---|
| Balance at the beginning | 8,499 | 9,318 | 9,119 |
| Business combinations and disposals | - | - | 580 |
| Acquisitions | 533 | 336 | 797 |
| Disposals | (2,288) | (1,214) | (1,188) |
| Others | (6,653) | 59 | 10 |
| Balance at the end | 91 | 8,499 | 9,318 |
| Accumulated impairment losses | (26) | (5,385) | (5,291) |
| Carrying amount | 65 | 3,114 | 4,026 |
The impairment included under the heading “Impairment or reversal of impairment on non-financial assets” of the accompanying consolidated financial statements were €307, €375 million and €209 million in 2017, 2016 and 2015, respectively (see Note 48).
As of December 31, 2017, the balance of real estate assets acquired from distressed customers was reclassified to the heading "Non-current assets and disposable groups of items that have been classified as held for sale" (see Note 21) due to the agreement with Cerberus to transfer the Real Estate business in Spain (See Note 3).
21. Non-current assets and disposal groups held for sale
The composition of the balance under the heading “Non-current assets and disposal groups classified as held for sale” in the accompanying consolidated balance sheets, broken down by the origin of the assets, is as follows:
Non-current assets and disposal groups classified as held for sale Breakdown by items (Millions of euros)
| 2017 | 2016 | 2015 | |
|---|---|---|---|
| Foreclosures and recoveries | 6,207 | 4,225 | 3,991 |
| Foreclosures (*) | 6,047 | 4,057 | 3,775 |
| Recoveries from financial leases | 160 | 168 | 216 |
| Other assets from tangible assets | 447 | 1,181 | 706 |
| Property, plant and equipment | 447 | 378 | 431 |
| Operating leases (**) | - | 803 | 275 |
| Business sale - Assets (***) | 18,623 | 40 | 37 |
| Accrued amortization (****) | (77) | (116) | (80) |
| Impairment losses | (1,348) | (1,727) | (1,285) |
| Total Non-current assets and disposal groups classified as held for sale | 23,853 | 3,603 | 3,369 |
The changes in the balances of “Non-current assets and disposal groups classified as held for sale” in 2017, 2016 and 2015 are as follows:
Non-current assets and disposal groups classified as held for sale Changes in the year 2017 (Millions of euros)
| Foreclosed Assets | From Own Use Assets (*) | Other assets (**) | Total | |||
|---|---|---|---|---|---|---|
| Notes | Foreclosed Assets through Auction Proceeding | Recovered Assets from Finance Leases | ||||
| Cost(1) | ||||||
| Balance at the beginning | 4,057 | 168 | 1,065 | 40 | 5,330 | |
| Additions | 791 | 45 | 1 | - | 837 | |
| Contributions from merger transactions | - | - | - | - | - | |
| Retirements (sales and other decreases) | (1,037) | (49) | (131) | - | (1,217) | |
| Transfers, other movements and exchange differences (**) | 2,236 | (4) | (564) | 18,583 | 20,251 | |
| Balance at the end | 6,047 | 160 | 371 | 18,623 | 25,201 | |
| Impairment(2) | ||||||
| Balance at the beginning | 1,237 | 47 | 443 | - | 1,727 | |
| Additions | 50 | 143 | 14 | 1 | - | 158 |
| Contributions from merger transactions | - | - | - | - | - | |
| Retirements (sales and other decreases) | (272) | (7) | (42) | - | (321) | |
| Other movements and exchange differences | (6) | (2) | (208) | - | (216) | |
| Balance at the end | 1,102 | 52 | 194 | - | 1,348 | |
| Balance at the end of Net carrying value (1)-(2) | 4,945 | 108 | 177 | 18,623 | 23,853 | |
Non-current assets and disposal groups classified as held for sale Changes in the year 2016 (Millions of euros)
| Foreclosed Assets | From Own Use Assets (*) | Other assets | Total | |||
|---|---|---|---|---|---|---|
| Notes | Foreclosed Assets through Auction Proceeding | Recovered Assets from Finance Leases | ||||
| Cost(1) | ||||||
| Balance at the beginning | 3,775 | 216 | 626 | 37 | 4,654 | |
| Additions | 582 | 57 | 23 | - | 662 | |
| Contributions from merger transactions | - | - | - | - | - | |
| Retirements (sales and other decreases) | (779) | (77) | (170) | 3 | (1,023) | |
| Transfers, other movements and exchange differences | 480 | (28) | 586 | - | 1,037 | |
| Balance at the end | 4,057 | 168 | 1,065 | 40 | 5,330 | |
| Impairment(2) | ||||||
| Balance at the beginning | 994 | 52 | 240 | - | 1,285 | |
| Additions | 50 | 129 | 3 | 5 | - | 136 |
| Contributions from merger transactions | - | - | - | - | - | |
| Retirements (sales and other decreases) | (153) | (6) | (33) | - | (192) | |
| Other movements and exchange differences | 268 | (2) | 232 | - | 499 | |
| Balance at the end | 1,237 | 47 | 443 | - | 1,727 | |
| Balance at the end of Net carrying value (1)-(2) | 2,820 | 121 | 621 | 40 | 3,603 | |
Non-current assets and disposal groups classified as held for sale Changes in the year 2015 (Millions of euros)
| Foreclosed Assets | From Own Use Assets (*) | Other assets (**) | Total | |||
|---|---|---|---|---|---|---|
| Notes | Foreclosed Assets through Auction Proceeding | Recovered Assets from Finance Leases | ||||
| Cost(1) | ||||||
| Balance at the beginning | 3,144 | 186 | 241 | 924 | 4,495 | |
| Additions | 801 | 94 | 79 | - | 974 | |
| Contributions from merger transactions | 446 | 1 | 163 | - | 609 | |
| Retirements (sales and other decreases) | (586) | (53) | (163) | (887) | (1,688) | |
| Transfers, other movements and exchange differences | (30) | (13) | 307 | - | 264 | |
| Balance at the end | 3,775 | 216 | 626 | 37 | 4,654 | |
| Impairment(2) | ||||||
| Balance at the beginning | 578 | 53 | 70 | - | 702 | |
| Additions | 50 | 208 | 11 | 66 | - | 285 |
| Contributions from merger transactions | 328 | - | 75 | - | 404 | |
| Retirements (sales and other decreases) | (117) | (14) | (39) | - | (170) | |
| Other movements and exchange differences | (4) | 2 | 66 | - | 64 | |
| Balance at the end | 994 | 52 | 240 | - | 1,285 | |
| Balance at the end of Net carrying value (1)-(2) | 2,781 | 164 | 387 | 37 | 3,369 | |
Assets from foreclosures or recoveries
As of December 31, 2017, 2016 and 2015, assets from foreclosures and recoveries, net of impairment losses, by nature of the asset, amounted to €1,924, €2,326 and €2,415 million in assets for residential use; €491, €574 and €486 million in assets for tertiary use (industrial, commercial or office) and €29, €41 and €44 million in assets for agricultural use, respectively. In December 31, 2017, 2016 and 2015, the average sale time of assets from foreclosures or recoveries was between 2 and 3 years.
During the years 2017, 2016 and 2015, some of the sale transactions for these assets were financed by Group companies. The amount of loans to buyers of these assets in those years amounted to €207, €219 and €179 million, respectively; with an average financing of 73% of the sales price.
As of December 31, 2017, 2016 and 2015, the amount of the profits arising from the sale of Group companies financed assets - and therefore not recognized in the consolidated income statement - amounted to €1, €1 and €18 million, respectively.
22. Financial liabilities at amortized cost
22.1 Breakdown of the balance
The breakdown of the balance under these headings in the accompanying consolidated balance sheets is as follows:
Financial liabilities measured at amortized cost (Millions of euros)
| Notes | 2017 | 2016 | 2015 | |
|---|---|---|---|---|
| Deposits | ||||
| Deposits from Central Banks | 9 | 37,054 | 34,740 | 40,087 |
| Deposits from Credit Institutions | 54,516 | 63,501 | 68,543 | |
| Customer deposits | 376,379 | 401,465 | 403,362 | |
| Debt securities issued | 63,915 | 76,375 | 81,980 | |
| Other financial liabilities | 11,850 | 13,129 | 12,141 | |
| Total | 543,714 | 589,210 | 606,113 |
22.2 Deposits from credit institutions
The breakdown of the balance under this heading in the consolidated balance sheets, according to the nature of the financial instruments, is as follows:
Deposits from credit institutions (Millions of euros)
| Notes | 2017 | 2016 | 2015 | |
|---|---|---|---|---|
| Term deposits | 25,941 | 30,429 | 38,153 | |
| Demand deposits | 3,731 | 4,651 | 4,318 | |
| Repurchase agreements | 35 | 24,843 | 28,420 | 26,072 |
| Other deposits | - | - | - | |
| Total | 54,516 | 63,501 | 68,543 |
The breakdown by geographical area and the nature of the related instruments of this heading in the accompanying consolidated balance sheets is as follows:
Deposits from Credit Institutions. December 2017 (Millions of euros)
| Demand Deposits & Reciprocal Accounts | Deposits with Agreed Maturity | Repurchase Agreements | Total | |
|---|---|---|---|---|
| Spain | 762 | 3,879 | 878 | 5,518 |
| The United States | 1,563 | 2,398 | - | 3,961 |
| Mexico | 282 | 330 | 1,817 | 2,429 |
| Turkey | 73 | 836 | 44 | 953 |
| South America | 448 | 2,538 | 13 | 2,999 |
| Rest of Europe | 526 | 12,592 | 21,732 | 34,849 |
| Rest of the world | 77 | 3,369 | 360 | 3,806 |
| Total | 3,731 | 25,941 | 24,843 | 54,516 |
Deposits from Credit Institutions. December 2016 (Millions of euros)
| Demand Deposits & Reciprocal Accounts | Deposits with Agreed Maturity | Repurchase Agreements | Total | |
|---|---|---|---|---|
| Spain | 956 | 4,995 | 817 | 6,768 |
| The United States | 1,812 | 3,225 | 3 | 5,040 |
| Mexico | 306 | 426 | 2,931 | 3,663 |
| Turkey | 317 | 1,140 | 5 | 1,463 |
| South America | 275 | 3,294 | 465 | 4,035 |
| Rest of Europe | 896 | 13,751 | 23,691 | 38,338 |
| Rest of the world | 88 | 3,597 | 509 | 4,194 |
| Total | 4,651 | 30,429 | 28,420 | 63,501 |
Deposits from Credit Institutions. December 2015 (Millions of euros)
| Demand Deposits & Reciprocal Accounts | Deposits with Agreed Maturity | Repurchase Agreements | Total | |
|---|---|---|---|---|
| Spain | 951 | 6,718 | 593 | 8,262 |
| The United States | 1,892 | 5,497 | 2 | 7,391 |
| Mexico | 54 | 673 | 916 | 1,643 |
| Turkey | 355 | 1,423 | 8 | 1,786 |
| South America | 212 | 3,779 | 432 | 4,423 |
| Rest of Europe | 801 | 15,955 | 23,140 | 39,896 |
| Rest of the world | 53 | 4,108 | 981 | 5,142 |
| Total | 4,318 | 38,153 | 26,072 | 68,543 |
22.3 Customer deposits
The breakdown of this heading in the accompanying consolidated balance sheets, by type of financial instrument, is as follows:
Customer deposits (Millions of euros)
| Notes | 2017 | 2016 | 2015 | |
|---|---|---|---|---|
| General Governments | 23,210 | 21,396 | 25,396 | |
| Current accounts | 223,497 | 212,604 | 195,655 | |
| Time deposits | 116,538 | 153,388 | 165,469 | |
| Repurchase agreements | 35 | 9,076 | 13,514 | 15,744 |
| Repurchase agreements | 194 | 233 | 285 | |
| Other accounts | 3,864 | 330 | 814 | |
| Total | 376,379 | 401,465 | 403,362 | |
| of which: | ||||
| In Euros | 184,150 | 189,438 | 203,053 | |
| In foreign currency | 192,229 | 212,027 | 200,309 |
The breakdown by geographical area of this heading in the accompanying consolidated balance sheets, by type of instrument is as follows:
Customer Deposits. December 2017 (Millions of euros)
| Demand Deposits | Deposits with Agreed Maturity | Repurchase Agreements | Total | |
|---|---|---|---|---|
| Spain | 123,382 | 39,513 | 2,664 | 165,559 |
| The United States | 36,728 | 21,436 | - | 58,164 |
| Mexico | 36,492 | 11,622 | 4,272 | 52,387 |
| Turkey | 12,427 | 24,237 | 152 | 36,815 |
| South America | 23,710 | 15,053 | 2 | 38,764 |
| Rest of Europe | 6,816 | 13,372 | 1,989 | 22,177 |
| Rest of the world | 1,028 | 1,484 | - | 2,511 |
| Total | 240,583 | 126,716 | 9,079 | 376,379 |
Customer Deposits. December 2016 (Millions of euros)
| Demand Deposits | Deposits with Agreed Maturity | Repurchase Agreements | Total | |
|---|---|---|---|---|
| Spain | 102,730 | 56,391 | 1,901 | 161,022 |
| The United States | 26,997 | 23,023 | 263 | 50,282 |
| Mexico | 36,468 | 10,647 | 7,002 | 54,117 |
| Turkey | 47,340 | 14,971 | - | 62,311 |
| South America | 9,862 | 28,328 | 21 | 38,211 |
| Rest of Europe | 6,959 | 19,683 | 4,306 | 30,949 |
| Rest of the world | 1,190 | 3,382 | - | 4,572 |
| Total | 231,547 | 156,425 | 13,493 | 401,465 |
Customer Deposits. December 2015 (Millions of euros)
| Demand Deposits | Deposits with Agreed Maturity | Repurchase Agreements | Total | |
|---|---|---|---|---|
| Spain | 86,564 | 70,816 | 11,309 | 168,689 |
| The United States | 47,071 | 15,893 | 24 | 62,988 |
| Mexico | 36,907 | 10,320 | 4,195 | 51,422 |
| Turkey | 9,277 | 26,744 | 15 | 36,036 |
| South America | 24,574 | 19,591 | 304 | 44,469 |
| Rest of Europe | 5,514 | 22,833 | 7,423 | 35,770 |
| Rest of the world | 357 | 3,631 | - | 3,988 |
| Total | 210,264 | 169,828 | 23,270 | 403,362 |
22.4 Debt securities issued (including bonds and debentures)
The breakdown of the balance under this heading, by currency, is as follows:
Debt securities issued (Millions of euros)
| 2017 | 2016 | 2015 | |
|---|---|---|---|
| In Euros | 38,735 | 45,619 | 51,449 |
| Promissory bills and notes | 1,309 | 875 | 471 |
| Non-convertible bonds and debentures | 9,418 | 8,766 | 10,081 |
| Covered bonds (*) | 16,425 | 24,845 | 29,672 |
| Hybrid financial instruments | 807 | 468 | 396 |
| Securitization bonds | 2,295 | 3,693 | 4,729 |
| Other securities | - | - | - |
| Subordinated liabilities | 8,481 | 6,972 | 6,100 |
| Convertible | 4,500 | 4,070 | 3,030 |
| Convertible perpetual securities | 4,500 | 4,070 | 3,030 |
| Convertible subordinated debt | - | - | - |
| Non-convertible | 3,981 | 2,902 | 3,071 |
| Preferred Stock | 107 | 359 | 357 |
| Other subordinated liabilities | 3,875 | 2,543 | 2,714 |
| In Foreign Currencies | 25,180 | 30,759 | 30,531 |
| Promissory bills and notes | 3,157 | 382 | 194 |
| Non-convertible bonds and debentures | 11,109 | 15,134 | 14,976 |
| Covered bonds (*) | 650 | 149 | 148 |
| Hybrid financial instruments | 1,809 | 2,059 | 2,422 |
| Securitization bonds | 47 | 3,019 | 3,077 |
| Other securities | - | - | - |
| Subordinated liabilities | 8,407 | 10,016 | 9,715 |
| Convertible | 2,085 | 1,548 | 1,511 |
| Convertible perpetual securities | 2,085 | 1,548 | 1,511 |
| Convertible subordinated debt | - | - | - |
| Non-convertible | 6,323 | 8,467 | 8,204 |
| Preferred Stock | 55 | 620 | 616 |
| Other subordinated liabilities | 6,268 | 7,846 | 7,589 |
| Total | 63,915 | 76,375 | 81,980 |
As of December 31, 2017, 71% of “Debt securities issued” have fixed-interest rates and 29% have variable interest rates.
Most of the foreign currency issues are denominated in U.S. dollars.
22.4.1 Non-convertible bonds and debentures
The senior debt issued by BBVA Senior Finance, S.A.U., are guaranteed jointly, severally and irrevocably by the Bank.
22.4.2 Subordinated liabilities
The issuances of BBVA International Preferred, S.A.U., BBVA Subordinated Capital, S.A.U., BBVA Global Finance, Ltd., Caixa Terrassa Societat de Participacions Preferents, S.A.U. and CaixaSabadell Preferents, S.A.U., are jointly, severally and irrevocably guaranteed by the Bank. The balance variances are mainly due to the following transactions:
Convertible perpetual securities
On May 24, 2017, BBVA carried out the fifth issuance of perpetual contingent convertible securities (additional tier 1 instrument), with exclusion of pre-emptive subscription rights of shareholders, for a total nominal amount of €500 million. This issuance is listed in the Global Exchange Market of the Irish Stock Exchange and was targeted only at qualified investors, not being offered to, and not being subscribed for, in Spain or by Spanish residents. The issuance qualifies as additional tier 1 capital of the Bank and the Group in accordance with Regulation EU 575/2013 (see Note 22.3).
Additionally, on November 14, 2017, BBVA carried out the sixth issuance of perpetual contingent convertible securities (additional tier 1 instrument), with exclusion of pre-emptive subscription rights of shareholders, for a total nominal amount of $1,000 million. This issuance is listed in the Global Exchange Market of the Irish Stock Exchange and was targeted only at qualified investors, not being offered to, and not being subscribed for, in Spain or by Spanish residents. The qualification of this issuance as additional tier 1 capital has been requested (see Note 22.3).
The additional four issuances of perpetual contingent convertible securities (additional tier 1 instruments) with exclusion of pre-emptive subscription rights of shareholders (in April 2013 for an amount of $1.5 billion, in February 2014 and February 2015 for an amount of €1.5 billion each one, and in April 2016 for an amount of €1 billion). These issuances were targeted only at qualified investors and foreign private banking clients not being offered to, and not being subscribed for, in Spain or by Spanish residents. The first two issuances are listed in the Singapore Exchange Securities Trading Limited and the last two issuances are listed in the Global Exchange Market of the Irish Stock Exchange. Furthermore, these four issuances qualify as additional tier 1 capital of the Bank and the Group in accordance with Regulation UE 575/2013 (see Note 22.3).
These perpetual securities will be converted into newly issued ordinary shares of BBVA if the CET 1 ratio of the Bank or the Group is less than 5.125%, in accordance with their respective terms and conditions.
These issues may be fully redeemed at BBVA ́s option only in the cases contemplated in their respective terms and conditions, and in any case, in accordance with the provisions of the applicable legislation.
Preferred securities
The breakdown by issuer of the balance under this heading in the accompanying consolidated balance sheets is as follows:
Preferred Securities by Issuer (Millions of euros)
| 2017 | 2016 | 2015 | |
|---|---|---|---|
| BBVA International Preferred, S.A.U. (1) | 36 | 855 | 842 |
| Unnim Group (2) | 98 | 100 | 109 |
| Compass Group | 19 | 22 | 22 |
| BBVA Colombia, S.A. | 1 | 1 | 1 |
| Other | 9 | 1 | - |
| Total | 163 | 979 | 974 |
These issues were fully subscribed at the moment of the issue by qualified/institutional investors outside the Group and are redeemable at the issuer company’s option after five years from the issue date, depending on the terms of each issue and with prior consent from the Bank of Spain
Redemption of preferred securities
On March 20, 2017 BBVA International Preferred, S.A.U. carried out the early redemption in full of its Series B preferred securities for an outstanding amount of €164,350,000.
Likewise, on March 22, 2017 BBVA International Preferred, S.A.U. carried out the early redemption in full of its Series A preferred securities for an outstanding amount of €85,550,000.
Finally, on April 18, 2017 BBVA International Preferred, S.A.U. carried out the early redemption in full of its Series C preferred securities for an outstanding amount of USD 600,000,000.
22.5 Other financial liabilities
The breakdown of the balance under this heading in the accompanying consolidated balance sheets is as follows:
Other financial liabilities (Millions of euros)
| Notes | 2017 | 2016 | 2015 | |
|---|---|---|---|---|
| Creditors for other financial liabilities | 2,835 | 3,465 | 3,303 | |
| Collection accounts | 3,452 | 2,768 | 2,369 | |
| Creditors for other payables | 5,563 | 6,370 | 5,960 | |
| Dividend payable but pending payment | 4 | - | 525 | 509 |
| Total | 11,850 | 13,129 | 12,141 |
23. Liabilities under insurance and reinsurance contracts
The Group has insurance subsidiaries mainly in Spain and Latin America (mostly in Mexico). The main product offered by the insurance subsidiaries is life insurance to cover the risk of death (risk insurance) and life-savings insurance. Within life and accident insurance, a distinction is made between freely sold products and those offered to customers who have taken mortgage or consumer loans, which cover the principal of those loans in the event of the customer’s death.
There are two types of savings products: individual insurance, which seeks to provide the customer with savings for retirement or other events, and group insurance, which is taken out by employers to cover their commitments to their employees.
The insurance business is affected by different risks, including those that are related to the BBVA Group such as credit risk, market risk, liquidity risk and operational risk and the methodology for risk measurement applied in the insurance activity is similar (see Note 7), although it has a differentiated management due to the particular characteristics of the insurance business, such as the coverage of contracted obligations and the long term of the commitments. Additionally, the insurance business generates certain specific risks, of a probabilistic nature:
The insurance industry is highly regulated in each country. In this regard, it should be noted that the insurance industry is undergoing a gradual regulatory transformation through new capital regulations risk- based, which have already been published in several countries.
The most significant provisions recognized by consolidated insurance subsidiaries with respect to insurance policies issued by them are under the heading “Liabilities under -Insurance and reinsurance contracts” in the accompanying consolidated balance sheets.
The breakdown of the balance under this heading is as follows:
Technical Reserves by type of insurance product (Millions of euros)
| 2017 | 2016 | 2015 | |
|---|---|---|---|
| Mathematical reserves | 7,961 | 7,813 | 8,101 |
| Individual life insurance (1) | 5,359 | 4,791 | 4,294 |
| Savings | 4,391 | 3,943 | 3,756 |
| Risk | 967 | 848 | 526 |
| Others | 1 | - | 12 |
| Group insurance (2) | 2,601 | 3,022 | 3,807 |
| Savings | 2,455 | 2,801 | 3,345 |
| Risk | 147 | 221 | 462 |
| Others | - | - | - |
| Provision for unpaid claims reported | 631 | 691 | 697 |
| Provisions for unexpired risks and other provisions | 631 | 635 | 609 |
| Total | 9,223 | 9,139 | 9,407 |
The cash flows of those Liabilities under insurance and reinsurance contracts are shown below:
Maturity (Millions of euros)
Liabilities under Insurance and Reinsurance Contracts
| Up to 1 Year | 1 to 3 Years | 3 to 5 Years | Over 5 Years | Total | |
|---|---|---|---|---|---|
| 2017 | 1,560 | 1,119 | 1,502 | 5,042 | 9,223 |
| 2016 | 1,705 | 1,214 | 1,482 | 4,738 | 9,139 |
| 2015 | 1,652 | 1,397 | 1,495 | 4,863 | 9,407 |
The modeling methods and techniques used to calculate the mathematical reserves for the insurance products are actuarial and financial methods and modeling techniques approved by the respective country’s insurance regulator or supervisor. The most important insurance entities are located in Spain and Mexico (which together account for approximately 85% of the insurance revenues), where the modeling methods and techniques are reviewed by the insurance regulator in Spain (General Directorate of Insurance) and Mexico (National Insurance and Bonding Commission), respectively. The modeling methods and techniques used to calculate the mathematical reserves for the insurance products are compliant with IFRS and primarily involve the valuation of the estimated future cash flows, discounted at the technical interest rate for each policy. To ensure this technical interest rate, asset-liability management is carried out, acquiring a portfolio of securities that generate the cash flows needed to cover the payment commitments assumed with the customers.
The table below shows the key assumptions as of December 31, 2017, used in the calculation of the mathematical reserves for insurance products in Spain and Mexico, respectively:
Mathematical Reserves
| Mortality table | Average technical interest type | |||
|---|---|---|---|---|
| Spain | Mexico | Spain | Mexico | |
| Individual life insurance (1) | GRMF 80-2 GKM 80 / GKMF 95 PERMF 2000 PASEM | Tables of the Comisión Nacional de Seguros y Fianzas 2000-individual | 0.26%-3.27% | 2.50% |
| Group insurance (2) | PERMF 2000 | Tables of the Comisión Nacional de Seguros y Fianzas 2000-grupo | Depending on the related portfolio | 5.50% |
The heading “Assets under reinsurance and insurance contracts” in the accompanying consolidated balance sheets includes the amounts that the consolidated insurance entities are entitled to receive under the reinsurance contracts entered into by them with third parties and, more specifically, the share of the reinsurer in the technical provisions recognized by the consolidated insurance subsidiaries. As of December 31, 2017, 2016 and 2015, the balance under this heading amounted to €421, €447 million and €511 million, respectively.
24. Provisions
The breakdown of the balance under this heading in the accompanying consolidated balance sheets, based on type of provisions, is as follows:
Provisions. Breakdown by concepts (Millions of euros)
| Notes | 2017 | 2016 | 2015 | |
|---|---|---|---|---|
| Provisions for pensions and similar obligations | 25 | 5,407 | 6,025 | 6,299 |
| Other long term employee benefits | 25 | 67 | 69 | 68 |
| Provisions for taxes and other legal contingencies | 756 | 418 | 616 | |
| Provisions for contingent risks and commitments | 578 | 950 | 714 | |
| Other provisions (1) | 669 | 1,609 | 1,155 | |
| Total | 7,477 | 9,071 | 8,852 |
The change in provisions for pensions and similar obligations for the years ended December 31, 2017, 2016 and 2015 is as follows:
Provisions for pensions and similar obligations. Changes Over the Period (Millions of euros)
| Notes | 2017 | 2016 | 2015 | |
|---|---|---|---|---|
| Balance at the beginning | 6,025 | 6,299 | 5,970 | |
| Add | ||||
| Charges to income for the year | 391 | 402 | 687 | |
| Interest expenses and similar charges | 71 | 96 | 108 | |
| Personnel expenses | 44.1 | 62 | 67 | 57 |
| Provision expenses | 258 | 239 | 522 | |
| Charges to equity (1) | 25 | 140 | 339 | 135 |
| Transfers and other changes (2) | (264) | 66 | 440 | |
| Less | ||||
| Benefit payments | 25 | (861) | (926) | (925) |
| Employer contributions | 25 | (25) | (154) | (8) |
| Balance at the end | 5,407 | 6,025 | 6,299 |
Provisions for Taxes, Legal Contingents and Other Provisions. Changes Over the Period (Millions of euros)
| 2017 | 2016 | 2015 | |
|---|---|---|---|
| Balance at beginning | 2,028 | 1,771 | 1,031 |
| Additions | 868 | 1,109 | 334 |
| Acquisition of subsidiaries (*) | - | - | 1,256 |
| Unused amounts reversed during the period | (164) | (311) | (205) |
| Amount used and other variations | (1,306) | (540) | (645) |
| Balance at the end | 1,425 | 2,028 | 1,771 |
Ongoing legal proceedings and litigation
The financial sector is facing an environment of greater regulatory and litigious pressure. In this environment, BBVA is frequently party to individual or collective legal actions arising in the ordinary course of business. According to the procedural status of these proceedings and the criteria of the legal counsel, BBVA considers that, as of December 31, 2017, none of such actions is material, individually or as a whole, and with no significant impact on the operating results, liquidity or financial situation at a Group consolidated or individual level of the Bank. As of December 31, 2017 BBVA ́s Management believes that the provisions made in respect of such legal proceedings are adequate.
In the consolidated financial statements for the year 2016, the judicial procedure related to the clauses of limitation of interest rates in mortgage loans with consumers (the so-called “cláusulas suelo”) was considered material. In relation to this issue, after the preliminary ruling to the Court of Justice of the European Union (CJEU), and after the analysis carried out on the portfolio of mortgage loans to consumers to which a floor clause had been applied, BBVA endowed a provision of €577 million (with an impact on the attributed profit of approximately €404 million) recorded in the consolidated profit and loss account for 2016, to cover potential claims. This provision has been used for this purpose during the year 2017. The additional provisions that have been made during the year 2017, to cover the possible claims that may arise in relation to this matter, have not been significant.
25. Post-employment and other employee benefit commitment
As stated in Note 2.2.12, the Group has assumed commitments with employees including short-term employee benefits (see Note 44.1), defined contribution and defined benefit plans (see Glossary), healthcare and other long-term employee benefits.
The Group sponsors defined-contribution plans for the majority of its active employees with the plans in Spain and Mexico being the most significant. Most defined benefit plans are closed to new employees with liabilities relating largely to retired employees, the most significant being those in Spain, Mexico, the United States and Turkey. In Mexico, the Group provides medical benefits to a closed group of employees and their family members, both active service and in retirees.
The breakdown of the balance sheet net defined benefit liability as of December 31, 2017, 2016 and 2015 is provided below:
Net Defined Benefit Liability (asset) on the Consolidated Balance Sheet (Millions of euros)
| 2017 | 2016 | 2015 | |
|---|---|---|---|
| Pension commitments | 4,969 | 5,277 | 5,306 |
| Early retirement commitments | 2,210 | 2,559 | 2,855 |
| Medical benefits commitments | 1,204 | 1,015 | 1,023 |
| Other long term employee benefits | 67 | 69 | 68 |
| Total commitments | 8,451 | 8,920 | 9,252 |
| Pension plan assets | 1,892 | 1,909 | 1,974 |
| Medical benefit plan assets | 1,114 | 1,113 | 1,149 |
| Total plan assets (1) | 3,006 | 3,022 | 3,124 |
| Total net liability / asset on the consolidated balance sheet | 5,445 | 5,898 | 6,128 |
| Of which: | |||
| Net asset on the consolidated balance sheet (2) | (27) | (194) | (238) |
| Net liability on the consolidated balance sheet for provisions for pensions and similar obligations (3) | 5,407 | 6,025 | 6,299 |
| Net liability on the consolidated balance sheet for other long term employee benefits (4) | 67 | 69 | 68 |
The amounts relating to benefit commitments charged to consolidated income statement for the years 2017, 2016 and 2015 are as follows:
Consolidated Income Statement Impact (Millions of euros)
| Notas | 2017 | 2016 | 2015 | |
|---|---|---|---|---|
| Interest and similar expenses | 71 | 96 | 108 | |
| Interest expense | 294 | 303 | 309 | |
| Interest income | (223) | (207) | (201) | |
| Personnel expenses | 149 | 154 | 141 | |
| Defined contribution plan expense | 44.1 | 87 | 87 | 84 |
| Defined benefit plan expense | 44.1 | 62 | 67 | 57 |
| Provisions (net) | 46 | 343 | 332 | 592 |
| Early retirement expense | 227 | 236 | 502 | |
| Past service cost expense | 3 | (2) | 26 | |
| Remeasurements (*) | 31 | 3 | 20 | |
| Other provision expenses | 82 | 95 | 44 | |
| Total impact on Consolidated Income Statement: Debit (Credit) | 563 | 582 | 841 |
The amounts relating to post-employment benefits charged to the consolidated balance sheet correspond to the actuarial gains (losses) on remeasurement of the net defined benefit liability relating to pension and medical commitments before income taxes. As of December 31, 2017, 2016 and 2015 are as follows:
Equity Impact (Millons of euros)
| 2017 | 2016 | 2015 | |
|---|---|---|---|
| Defined benefit plans | (40) | 237 | 128 |
| Post-employment medical benefits | 179 | 119 | 7 |
| Total impact on equity: Debit (Credit) (*) | 140 | 356 | 135 |
25.1 Defined benefit plans
Defined benefit commitments relate mainly to employees who have already retired or taken early retirement, certain closed groups of active employees still accruing defined benefit pensions, and in-service death and disability benefits provided to most active employees. For the latter, the Group pays the required premiums to fully insure the related liability. The change in these pension commitments during the years ended December 31, 2017, 2016 and 2015 is presented below:
Defined Benefits (Millions of euros)
| 2017 | 2016 | 2015 | |||||||
|---|---|---|---|---|---|---|---|---|---|
| Defined Benefit Obligation | Plan Assets | Net Liability (asset) | Defined Benefit Obligation | Plan Assets | Net Liability (asset) | Defined Benefit Obligation | Plan Assets | Net Liability (asset) | |
| Balance at the beginning | 8,851 | 3,022 | 5,829 | 9,184 | 3,124 | 6,060 | 8,622 | 2,937 | 5,685 |
| Current service cost | 64 | - | 64 | 67 | - | 67 | 57 | - | 57 |
| Interest income or expense | 290 | 223 | 68 | 299 | 207 | 92 | 309 | 201 | 108 |
| Contributions by plan participants | 4 | 4 | 0 | 5 | 5 | - | 2 | 2 | - |
| Employer contributions | - | 25 | (25) | - | 154 | (154) | - | 8 | (8) |
| Past service costs (1) | 231 | - | 231 | 235 | - | 235 | 530 | - | 530 |
| Remeasurements: | 331 | 161 | 171 | 354 | (5) | 359 | 42 | (113) | 155 |
| Return on plan assets (2) | - | 161 | (161) | - | (20) | 20 | - | (106) | 106 |
| From changes in demographic assumptions | 100 | - | 100 | 107 | - | 107 | 8 | - | 8 |
| From changes in financial assumptions | 220 | - | 220 | 106 | - | 106 | (53) | - | (53) |
| Other actuarial gain and losses | 12 | - | 12 | 141 | 15 | 125 | 88 | (7) | 94 |
| Benefit payments | (1,029) | (169) | (861) | (1,052) | (169) | (883) | (1,086) | (146) | (940) |
| Settlement payments | - | - | - | (43) | - | (43) | (2) | (17) | 94 |
| Business combinations and disposals | - | - | - | - | - | - | 795 | 321 | 474 |
| Effect on changes in foreign exchange rates | (278) | (258) | (19) | (282) | (293) | 11 | (136) | (98) | (38) |
| Conversions to defined contributions | (82) | - | (82) | ||||||
| Other effects | (1) | (1) | 0 | 84 | - | 84 | 50 | 28 | 22 |
| Balance at the end | 8,384 | 3,006 | 5,378 | 8,851 | 3,022 | 5,829 | 9,184 | 3,124 | 6,060 |
| Of which | |||||||||
| Spain | 5,442 | 320 | 5,122 | 6,157 | 358 | 5,799 | 6,491 | 380 | 6,111 |
| Mexico | 1,661 | 1,602 | 60 | 1,456 | 1,627 | (171) | 1,527 | 1,745 | (219) |
| The United States | 360 | 309 | 51 | 385 | 339 | 46 | 362 | 329 | 33 |
| Turkey | 520 | 424 | 96 | 447 | 348 | 99 | 435 | 337 | 98 |
The balance under the heading “Provisions - Pensions and other post-employment defined benefit obligations” of the accompanying consolidated balance sheet as of December 31, 2017 includes €341 million relating to post-employment benefit commitments to former members of the Board of Directors and the Bank’s Management (see Note 54).
The most significant commitments are those in Spain and Mexico and, to a lesser extent, in the United States and Turkey. The remaining commitments are located mostly in Portugal and South America. Unless otherwise required by local regulation, all defined benefit plans have been closed to new entrants, who instead are able to participate in the Group ́s defined contribution plans.
Both the costs and the present value of the commitments are determined by independent qualified actuaries using the “projected unit credit” method.
In order to guarantee the good governance of these plans, the Group has established specific benefits committees. These benefit committees include members from the different areas of the business to ensure that all decisions are made taking into consideration all of the associated impacts.
The following table sets out the key actuarial assumptions used in the valuation of these commitments as of December 31, 2017, 2016 and 2015:
Actuarial Assumptions (Millions of euros)
| 2017 | 2016 | 2015 | ||||||||||
|---|---|---|---|---|---|---|---|---|---|---|---|---|
| Spain | Mexico | USA | Turkey | Spain | Mexico | USA | Turkey | Spain | Mexico | USA | Turkey | |
| Discount rate | 1.24% | 9.48% | 3.57% | 11.60% | 1.50% | 9.95% | 4.04% | 11.50% | 2.00% | 9.30% | 4.30% | 10.30% |
| Rate of salary increase | - | 4.75% | - | 9.90% | 1.50% | 4.75% | 3.00% | 9.30% | 2.00% | 4.75% | 3.00% | 8.60% |
| Rate of pension increase | - | 2.13% | - | 8.40% | - | 2.13% | - | 7.80% | - | 2.13% | - | 7.10% |
| Medical cost trend rate | - | 7.00% | - | 12.60% | - | 6.75% | - | 10.92% | - | 6.75% | - | 9.94% |
| Mortality tables | PERM/F 2000P | EMSSA09 | RP 2014 | CSO2001 | PERM/F 2000P | EMSSA97 (adjustment EMSSA09) | RP 2014 | CSO2001 | PERM/F 2000P | EMSSA 97 | RP 2014 | CSO2001 |
In Spain, the discount rate shown as of December, 31, 2017, corresponds to the weighted average rate, the actual discount rates used are 0.50% and 1.75% depending on the type of commitment.
Discount rates used to value future benefit cash flows have been determined by reference to high quality corporate bonds (Note 2.2.12) denominated in Euro in the case of Spain, Mexican peso for Mexico and USD for the United States, and government bonds denominated in new Turkish Lira for Turkey.
The expected return on plan assets has been set in line with the adopted discount rate.
Assumed retirement ages have been set by reference to the earliest age at which employees are entitled to retire, the contractually agreed age in the case of early retirements in Spain or by using retirement rates.
Changes in the main actuarial assumptions may affect the valuation of the commitments. The table below shows the sensitivity of the benefit obligations to changes in the key assumptions:
Sensitivity Analysis (Millions of euros)
| Basis points change | 2017 | 2016 | |||
|---|---|---|---|---|---|
| Increase | Decrease | Increase | Decrease | ||
| Discount rate | 50 | (352) | 386 | (367) | 401 |
| Rate of salary increase | 50 | 5 | (5) | 9 | (9) |
| Rate of pension increase | 50 | 23 | (22) | 28 | (27) |
| Medical cost trend rate | 100 | 290 | (225) | 263 | (204) |
| Change in obligation from each additional year of longevity | - | 155 | - | 121 | - |
The sensitivities provided above have been determined at the date of these consolidated financial statements, and reflect solely the impact of changing one individual assumption at a time, keeping the rest of the assumptions unchanged, thereby excluding the effects which may result from combined assumption changes.
In addition to the commitments to employees shown above, the Group has other less material long-term employee benefits. These include long-service awards, which consist of either an established monetary award or some vacation days granted to certain groups of employees when they complete a given number of years of service. As of December 31, 2017, 2016 and 2015, the actuarial liabilities for the outstanding awards amounted to €67 million, €69 million, and €68 million, respectively. These commitments are recorded under the heading "Provisions - Other long-term employee benefits" of the accompanying consolidated balance sheet (see Note 24).
As described above, the Group maintains both pension and medical post-employment benefit commitments with their employees.
25.1.1 Post-employment commitments and similar obligations
These commitments relate mostly to pensions in payment, and which have been determined based on salary and years of service. For most plans, pension payments are due on retirement, death and long term disability.
In addition, during the year 2017, Group entities in Spain offered certain employees the option to take retirement or early retirement (that is, earlier than the age stipulated in the collective labor agreement in force). This offer was accepted by 731 employees (613 and 1,817 employees during years 2016 and 2015, respectively). These commitments include both the compensation and indemnities due as well as the contributions payable to external pension funds during the early retirement period. As of December 31, 2017, 2016 and 2015, the value of these commitments amounted to €2,210 million, €2,559 million and €2,855 million, respectively.
The change in the benefit plan obligations and plan assets as of December 31, 2017 was as follows:
Post-employment commitments 2017 (Millions of euros)
| Defined Benefit Obligation | |||||
|---|---|---|---|---|---|
| Spain | Mexico | USA | Turkey | Rest of the world | |
| Balance at the beginning | 6,157 | 455 | 385 | 447 | 392 |
| Current service cost | 4 | 5 | 3 | 21 | 5 |
| Interest income or expense | 78 | 44 | 14 | 45 | 9 |
| Contributions by plan participants | - | - | - | 3 | 1 |
| Employer contributions | - | - | - | - | - |
| Past service costs (1) | 235 | 1 | - | 4 | 3 |
| Remeasurements: | (46) | 48 | 20 | 113 | (3) |
| Return on plan assets (2) | - | - | - | - | - |
| From changes in demographic assumptions | - | 22 | (2) | - | (3) |
| From changes in financial assumptions | (33) | 18 | 22 | 81 | 4 |
| Other actuarial gain and losses | (13) | 7 | - | 32 | (4) |
| Benefit payments | (906) | (41) | (14) | (24) | (10) |
| Settlement payments | - | - | - | - | - |
| Business combinations and disposals | - | - | - | - | - |
| Effect on changes in foreign exchange rates | - | (41) | (47) | (89) | (9) |
| Conversions to defined contributions | (82) | - | - | - | - |
| Other effects | 2 | - | (2) | - | (1) |
| Balance at the end | 5,442 | 470 | 360 | 520 | 387 |
| Of which: | |||||
| Vested benefit obligation relating to current employees | 111 | ||||
| Vested benefit obligation relating to retired employees | 5,331 | ||||
Post-employment commitments 2017 (Millions of euros)
| Plan Assets | |||||
|---|---|---|---|---|---|
| Spain | Mexico | USA | Turkey | Rest of the world | |
| Balance at the beginning | 358 | 514 | 339 | 348 | 349 |
| Current service cost | - | - | - | - | 1 |
| Interest income or expense | 5 | 50 | 13 | 36 | 7 |
| Contributions by plan participants | - | - | - | 3 | 1 |
| Employer contributions | - | 1 | - | 16 | 8 |
| Past service costs (1) | - | - | - | - | 1 |
| Remeasurements: | 21 | 10 | 11 | 101 | (2) |
| Return on plan assets (2) | 21 | 10 | 11 | 101 | (2) |
| From changes in demographic assumptions | - | - | - | - | - |
| From changes in financial assumptions | - | - | - | - | - |
| Other actuarial gain and losses | - | - | - | - | - |
| Benefit payments | (64) | (40) | (12) | (12) | (7) |
| Settlement payments | - | - | - | - | - |
| Business combinations and disposals | - | - | - | - | - |
| Effect on changes in foreign exchange rates | - | (46) | (41) | (68) | (4) |
| Conversions to defined contributions | - | - | - | - | - |
| Other effects | - | - | (1) | - | - |
| Balance at the end | 320 | 488 | 309 | 424 | 351 |
Post-employment commitments 2017 (Millions of euros)
| Net Liability (Asset) | |||||
|---|---|---|---|---|---|
| Spain | Mexico | USA | Turkey | Rest of the world | |
| Balance at the beginning | 5,799 | (59) | 46 | 99 | 43 |
| Current service cost | 4 | 5 | 3 | 21 | 5 |
| Interest income or expense | 73 | (6) | 1 | 9 | 2 |
| Contributions by plan participants | - | - | - | - | 0 |
| Employer contributions | - | (1) | - | (16) | (8) |
| Past service costs (1) | 235 | 1 | - | 4 | 3 |
| Remeasurements: | (67) | 38 | 9 | 12 | (1) |
| Return on plan assets (2) | (21) | (10) | (11) | (101) | 2 |
| From changes in demographic assumptions | - | 22 | (2) | - | (3) |
| From changes in financial assumptions | (33) | 18 | 22 | 81 | 4 |
| Other actuarial gain and losses | (13) | 7 | - | 32 | (4) |
| Benefit payments | (842) | (1) | (2) | (11) | (3) |
| Settlement payments | - | - | - | - | - |
| Business combinations and disposals | - | - | - | - | - |
| Effect on changes in foreign exchange rates | - | 5 | (5) | (21) | (5) |
| Conversions to defined contributions | (82) | - | - | - | - |
| Other effects | 2 | - | (1) | - | (1) |
| Balance at the end | 5,122 | (18) | 51 | 96 | 36 |
The change in net liabilities (assets) during the years ended 2016 and 2015 was as follows:
Post-employment commitments (Millions of euros)
| 2016: Net liability (asset) | 2015: Net liability (asset) | |||||||||
|---|---|---|---|---|---|---|---|---|---|---|
| Spain | Mexico | USA | Turkey | Rest of the world | Spain | Mexico | USA | Turkey | Rest of the world | |
| Balance at the beginning | 6,109 | (79) | 35 | 97 | 24 | 5,830 | (94) | 38 | - | 69 |
| Current service cost | 10 | 6 | 4 | 22 | 5 | 9 | 8 | 3 | 2 | 4 |
| Interest income or expense | 98 | (7) | 1 | 8 | 2 | 123 | (10) | 1 | 4 | 3 |
| Contributions by plan participants | - | - | - | - | - | - | - | - | - | - |
| Employer contributions | - | (14) | (1) | (17) | (9) | - | (1) | - | - | (7) |
| Past service costs (1) | 240 | 1 | - | 4 | (4) | 550 | (15) | - | 2 | - |
| Remeasurements: | 188 | 23 | 10 | 8 | 11 | 112 | 29 | (9) | 10 | 7 |
| Return on plan assets (2) | (35) | 23 | 3 | (23) | (8) | - | 50 | 19 | (54) | (3) |
| From changes in demographic assumptions | - | 2 | (5) | - | (1) | - | - | (7) | 15 | - |
| From changes in financial assumptions | 192 | (22) | 13 | (23) | 37 | 101 | (23) | (18) | (25) | 3 |
| Other actuarial gain and losses | 31 | 19 | (1) | 54 | (17) | 11 | 2 | (3) | 74 | 7 |
| Benefit payments | (867) | - | (3) | (9) | (2) | (913) | - | (20) | (4) | (3) |
| Settlement payments | (43) | - | - | - | - | - | - | 17 | - | - |
| Business combinations and disposals | - | - | - | - | - | 378 | - | - | 96 | - |
| Effect on changes in foreign exchange rates | - | 10 | 2 | (15) | (4) | 1 | 5 | 4 | (11) | (45) |
| Other effects | 63 | - | (3) | - | 20 | 23 | 1 | (1) | - | (1) |
| Balance at the end | 5,799 | (59) | 46 | 99 | 42 | 6,109 | (78) | 33 | 98 | 23 |
In Spain, local regulation requires that pension and death benefit commitments must be funded, either through a qualified pension plan or an insurance contract.
In the Spanish entities these commitments are covered by insurance contracts which meet the requirements of the accounting standard regarding the non-recoverability of contributions. However, a significant number of the insurance contracts are with BBVA Seguros, S.A.– a consolidated subsidiary and related party – and consequently these policies cannot be considered plan assets under IAS 19. For this reason, the liabilities insured under these policies are fully recognized under the heading "Provisions – Pensions and other post- employment defined benefit obligations" of the accompanying consolidated balance sheet (see Note 24), while the related assets held by the insurance company are included within the Group ́s consolidated assets (registered according to the classification of the corresponding financial instruments). As of December 31, 2017 the value of these separate assets was €2,689 million, representing direct rights of the insured employees held in the consolidated balance sheet, hence these benefits are effectively fully funded.
On the other hand, some pension commitments have been funded through insurance contracts with insurance companies not related to the Group, and can therefore be considered qualifying insurance policies and plan assets under IAS 19. In this case the accompanying consolidated balance sheet reflects the value of the obligations net of the fair value of the qualifying insurance policies. As of December 31, 2017, 2016 and 2015, the fair value of the aforementioned insurance policies (€320, €358 million and €380 million, respectively) exactly match the value of the corresponding obligations and therefore no amount for this item has been recorded in the accompanying consolidated balance sheet.
Pensions benefits are paid by the insurance companies with whom BBVA has insurance contracts and to whom all insurance premiums have been paid. The premiums are determined by the insurance companies using “cash flow matching” techniques to ensure that benefits can be met when due, guaranteeing both the actuarial and interest rate risk.
In Mexico, there is a defined benefit plan for employees hired prior to 2001. Other employees participate in a defined contribution plan. External funds/trusts have been constituted locally to meet benefit payments as required by local regulation.
In the United States there are mainly two defined benefit plans, both closed to new employees, who instead are able to join a defined contribution plan. External funds/trusts have been constituted locally to fund the plans, as required by local regulation.
In 2008, the Turkish government passed a law to unify the different existing pension systems under a single umbrella Social Security system. Such system provides for the transfer of the various previously established funds.
The financial sector is in this stage at present, maintaining these pension commitments managed by external pension funds (foundations) established for that purpose.
The Foundation that maintains the assets and liabilities relating to employees of Garanti in Turkey, as per the local regulatory requirements, has registered an obligation amounting to €228 million as of December 31, 2017 pending future transfer to the Social Security system.
Furthermore, Garanti has set up a defined benefit pension plan for employees, additional to the social security benefits, reflected in the consolidated balance sheet.
Until the year 2016, he Bank also had commitments to pay indemnities to certain employees and members of the Group’s Senior Management in the event that they cease to hold their positions for reasons other than their own will, retirement, disability or serious dereliction of duties. The amount will be calculated according to the salary and professional conditions of each employee, taking into consideration fixed elements of the remuneration and the length of office at the Bank. Under no circumstances indemnities will be paid in cases of disciplinary dismissal for misconduct upon decision of the employer on grounds of the employee's serious dereliction of duties.
25.1.2 Medical benefit commitments
The change in defined benefit obligations and plan assets during the years 2017, 2016 and 2015 was as follows:
Medical Benefits Commitments
| 2017 | 2016 | 2015 | |||||||
|---|---|---|---|---|---|---|---|---|---|
| Defined Benefit Obligation | Plan assets | Net liability (asset) | Defined Benefit Obligation | Plan assets | Net liability (asset) | Defined Benefit Obligation | Plan assets | Net liability (asset) | |
| Balance at the beginning | 1,015 | 1,113 | (98) | 1,022 | 1,149 | (127) | 1,083 | 1,240 | (157) |
| Current service cost | 26 | - | 26 | 24 | - | 24 | 31 | - | 31 |
| Interest income or expense | 101 | 112 | (11) | 86 | 97 | (11) | 95 | 109 | (14) |
| Contributions by plan participants | - | - | - | - | - | - | - | - | - |
| Employer contributions | - | - | - | - | 114 | (114) | - | - | - |
| Past service costs (1) | (11) | - | (11) | (5) | - | (5) | 1 | - | 1 |
| Remeasurements: | 200 | 21 | 179 | 59 | (60) | 119 | (87) | (94) | 7 |
| Return on plan assets (2) | - | 21 | (21) | - | (60) | 60 | - | (94) | 94 |
| From changes in demographic assumptions | 83 | - | 83 | 110 | - | 110 | - | - | - |
| From changes in financial assumptions | 128 | - | 128 | (91) | - | (91) | (91) | - | (91) |
| Other actuarial gain and losses | (10) | - | (10) | 39 | - | 39 | 4 | - | 4 |
| Benefit payments | (35) | (33) | (2) | (33) | (30) | (2) | (30) | (30) | - |
| Settlement payments | - | - | - | - | - | - | (2) | - | (2) |
| Business combinations and disposals | - | - | - | - | - | - | - | - | - |
| Effect on changes in foreign exchange rates | (92) | (100) | 8 | (138) | (156) | 18 | (69) | (76) | 8 |
| Other effects | - | - | - | - | - | - | - | - | - |
| Balance at the end | 1,204 | 1,114 | 91 | 1,015 | 1,113 | (98) | 1,022 | 1,149 | (127) |
In Mexico there is a medical benefit plan for employees hired prior to 2007. New employees from 2007 are covered by a medical insurance policy. An external trust has been constituted locally to fund the plan, in accordance with local legislation and Group policy.
In Turkey employees are currently provided with medical benefits through a foundation in collaboration with the Social Security system, although local legislation prescribes the future unification of this and similar systems into the general Social Security system itself.
The valuation of these benefits and their accounting treatment follow the same methodology as that employed in the valuation of pension commitments.
25.1.3 Estimated benefit payments
As of December 31, 2017, the estimated benefit payments over the next ten years for all the entities in Spain, Mexico, The United States and Turkey are as follows:
Estimated Benefit Payments (Millions of euros)
| 2018 | 2019 | 2020 | 2021 | 2022 | 2023-2027 | |
|---|---|---|---|---|---|---|
| Commitments in Spain | 753 | 681 | 596 | 500 | 402 | 1,101 |
| Commitments in Mexico | 78 | 79 | 83 | 90 | 95 | 591 |
| Commitments in United States | 15 | 16 | 17 | 18 | 18 | 101 |
| Commitments in Turkey | 25 | 15 | 17 | 20 | 22 | 189 |
| Total | 871 | 791 | 713 | 628 | 537 | 1,982 |
25.1.4 Plan assets
The majority of the Group ́s defined benefit plans are funded by plan assets held in external funds/trusts legally separate from the Group sponsoring entity. However, in accordance with local regulation, some commitments are not externally funded and covered through internally held provisions, principally those relating to early retirements in Spain.
Plan assets are those assets which will be used to directly settle the assumed commitments and which meet the following conditions: they are not part of the Group sponsoring entities assets, they are available only to pay post-employment benefits and they cannot be returned to the Group sponsoring entity.
To manage the assets associated with defined benefit plans, BBVA Group has established investment policies designed according to criteria of prudence and minimizing the financial risks associated with plan assets.
The investment policy consists of investing in a low risk and diversified portfolio of assets with maturities consistent with the term of the benefit obligation and which, together with contributions made to the plan, will be sufficient to meet benefit payments when due, thus mitigating the plans‘ risks.
In those countries where plan assets are held in pension funds or trusts, the investment policy is developed consistently with local regulation. When selecting specific assets, current market conditions, the risk profile of the assets and their future market outlook are all taken into consideration. In all the cases, the selection of assets takes into consideration the term of the benefit obligations as well as short-term liquidity requirements.
The risks associated with these commitments are those which give rise to a deficit in the plan assets. A deficit could arise from factors such as a fall in the market value of plan assets, an increase in long-term interest rates leading to a decrease in the fair value of fixed income securities, or a deterioration of the economy resulting in more write-downs and credit rating downgrades.
The table below shows the allocation of plan assets of the main companies of the BBVA Group as of December 31, 2017:
Plan Assets Breakdown (Millions of euros)
| 2017 | |
|---|---|
| Cash or cash equivalents | 68 |
| Debt securities (Government bonds) | 2,178 |
| Property | 1 |
| Mutual funds | 1 |
| Insurance contracts | 4 |
| Other investments | 10 |
| Total | 2,261 |
| Of which: | |
| Bank account in BBVA | 5 |
| Debt securities issued by BBVA | 3 |
In addition to the above there are plan assets relating to the previously mentioned insurance contracts in Spain and the foundation in Turkey.
The following table provides details of investments in listed securities (Level 1) as of December 31, 2017:
Investments in listed markets
| 2017 | |
|---|---|
| Cash or cash equivalents | 68 |
| Debt securities (Government bonds) | 2,178 |
| Mutual funds | 1 |
| Total | 2,247 |
| Of which: | |
| Bank account in BBVA | 5 |
| Debt securities issued by BBVA | 3 |
The remainders of the assets are mainly invested in Level 2 assets in in accordance with the classification established under IFRS 13 (mainly insurance contracts). As of December 31, 2017, almost all of the assets related to employee’s commitments corresponded to fixed income securities.
25.2 Defined contribution plans
Certain Group entities sponsor defined contribution plans. Some of these plans allow employees to make contributions which are then matched by the employer.
Contributions are recognized as and when they are accrued, with a charge to the consolidated income statement in the corresponding year. No liability is therefore recognized in the accompanying consolidated balance sheet (see Note 44.1).
26. Common stock
As of December 31, 2017, BBVA’s common stock amounted to €3,267,264,424.20 divided into 6,667,886,580 fully subscribed and paid-up registered shares, all of the same class and series, at €0.49 par value each, represented through book-entry accounts. All of the Bank shares carry the same voting and dividend rights, and no single stockholder enjoys special voting rights. Each and every share is part of the Bank’s common stock.
The Bank’s shares are traded on the Spanish stock market, as well as on the London and Mexico stock markets. BBVA American Depositary Shares (ADSs) traded on the New York Stock Exchange. Also, as of December 31, 2017, the shares of BBVA Banco Continental, S.A., Banco Provincial S.A., BBVA Colombia, S.A., BBVA Chile, S.A., and BBVA Banco Frances, S.A. were listed on their respective local stock markets. BBVA Banco Frances, S.A. is also listed on the Latin American market (Latibex) of the Madrid Stock Exchange and on the New York Stock Exchange.
Additionally, as of December 31, 2017, the shares of BBVA Banco Continental, S.A .; Banco Provincial, S.A .; BBVA Colombia, S.A .; BBVA Chile, S.A .; BBVA Banco Francés, S.A. and Turkiye Garanti Bankasi A.S., were listed on their respective local stock markets. BBVA Banco Francés, S.A. was also quoted in the Latin American market (Latibex) of the Madrid Stock Exchange and the New York Stock Exchange.
As of December 31, 2017, State Street Bank and Trust Co., Chase Nominees Ltd and The Bank of New York Mellon SA NV in their capacity as international custodian/depositary banks, held 12.53%, 6.48%, and 3.80% of BBVA common stock, respectively. Of said positions held by the custodian banks, BBVA is not aware of any individual shareholders with direct or indirect holdings greater than or equal to 3% of BBVA common stock outstanding.
On October 18, 2017, the Blackrock, Inc. reported to the Spanish Securities and Exchange Commission (CNMV) that, it now has an indirect holding of BBVA common stock totaling 5.939%, of which 5.708% are voting rights attributed to shares and 0.231% are voting rights through financial instruments.
BBVA is not aware of any direct or indirect interests through which control of the Bank may be exercised. BBVA has not received any information on stockholder agreements including the regulation of the exercise of voting rights at its annual general meetings or restricting or placing conditions on the free transferability of BBVA shares. No agreement is known that could give rise to changes in the control of the Bank.
The changes in the heading “Paid up Capital” of the accompanying consolidated balance sheets are due to the following common stock increases:
Capital Increase
| Number of Shares | Paid up capital (Millions of Euros) | |
|---|---|---|
| As of December 31, 2015 | 6,366,680,118 | 3,120 |
| Dividend option - April 2016 | 113,677,807 | 56 |
| Dividend option - October 2016 | 86,257,317 | 42 |
| As of December 31, 2016 | 6,566,615,242 | 3,218 |
| Dividend Option . April 2017 | 101,271,338 | 50 |
| As of December 31, 2017 | 6,667,886,580 | 3,267 |
“Dividend Option” Program in 2017:
The AGM of BBVA held on March 17, 2017 adopted, under agenda item three, a capital increase to be charged to voluntary reserves to implement the shareholder remuneration system called the “Dividend Option” this year in similar conditions to those agreed in 2014, 2015 and 2016, conferring on the Board of Directors, in accordance with article 297.1.a) of the Spanish Companies Act, the authority to set the date on which the capital increase should be carried out, within one year of the date of approval of the AGM resolution.
By virtue of such resolution, the Board of Directors of BBVA resolved, on March 29, 2017, to execute the capital increase to be charged to voluntary reserves, in accordance with the terms and conditions approved by the AGM mentioned above. As a result, BBVA’s share capital was increased by an amount of 49,622,955.62 euros through the issuance of 101,271,338 newly-issued BBVA ordinary shares at 0.49 euros par value each (see Note 4).
“Dividend Option” Program in 2016:
The AGM held on March 11, 2016, under agenda item three, adopted four capital increase resolutions to be charged to voluntary reserves to once again implement the shareholder remuneration program called the “Dividend Option” (see Note 4), conferring on the Board of Directors, in accordance with article 297.1 a) of the Spanish Companies Act, the authority to set the date on which said capital increases should be carried out, within one year of the date of approval of the AGM resolution, including the power not to implement any of the resolutions, when deemed advisable.
On March 31, 2016, the Board of Directors of BBVA approved the execution of the first of the capital increases charged to voluntary reserves, in accordance with the terms and conditions agreed by the aforementioned AGM. As a result of this increase, the Bank’s capital increased by €55,702,125.43 through the issuance of 113,677,807 ordinary shares at €0.49 par value each.
On September 28, 2016, BBVA’s Board of Directors approved the execution of the second of the capital increases charged to voluntary reserves in accordance with the terms and conditions agreed by the aforementioned AGM. As a result of this increase, the Bank’s capital increased by €42,266,085.33 through the issuance of 86,257,317 ordinary shares at €0.49 par value each.
“Dividend Option” Program in 2015:
The AGM held on March 13, 2015 under Point Four of the Agenda, adopted four resolutions on capital increase to be charged to voluntary reserves, to once again implement the shareholder remuneration program called the “Dividend Option” (see Note 4), pursuant to article 297.1 a) of the Spanish Corporate Enterprises Act, conferring on the Board of Directors the authority to indicate the date on which said capital increases should be carried out, within one year of the date of the AGM, including the power not to implement any of the resolutions, when deemed advisable.
On March 25, 2015, the Board of Directors of BBVA approved the execution of the first of the capital increases charged to voluntary reserves agreed by the aforementioned AGM. As a result of this increase, the Bank’s capital increased by €39,353,896.26 through the issue and circulation of 80,314,074 shares with a €0.49 par value each.
Likewise, on September 30, 2015, the Board of Directors of BBVA approved the execution of the second of the capital increases charged to voluntary reserves agreed by the aforementioned AGM. As a result of this increase, the Bank’s capital increased by €30,106,631.94 through the issue and circulation of 61,442,106 shares with a €0.49 par value each.
Convertible and/or exchangeable securities:
The AGM held on March 17, 2017, resolved, under agenda item five, to confer authority to the Board of Directors to issue securities convertible into newly issued BBVA shares, on one or several occasions, within the maximum term of five years to be counted from the approval date of the authorization, up to a maximum overall amount of €8 billion or its equivalent in any other currency. Likewise, the AGM resolved to confer to the Board of Directors the authority to totally or partially exclude shareholders’ pre-emptive subscription rights within the framework of a specific issue of convertible securities, although this power was limited to ensure the nominal amount of the capital increases resolved or effectively carried out to cover the conversion of mandatory convertible issuances of this authority (without prejudice to anti-dilution adjustments), with exclusion of pre-emptive subscription rights and of those likewise resolved or carried out with exclusion of pre-emptive subscription rights in use of the authority to increase the share capital conferred by the AGM held on March 17, 2017, under agenda item four, do not exceed the maximum nominal amount, overall, of 20% of the share capital of BBVA at the time of the authorization, this limit not being applicable to contingent convertible issues.
In use of the authority mentioned above, BBVA carried out, on May 24, 2017 the fifth issuance of perpetual contingent convertible securities (additional tier 1 instrument), with exclusion of pre-emptive subscription rights of shareholders, for a total nominal amount of €500 million. This issuance is listed in the Global Exchange Market of the Irish Stock Exchange and was targeted only at qualified investors, not being offered to, and not being subscribed for, in Spain or by Spanish residents. The issuance qualifies as additional tier 1 capital of the Bank and the Group in accordance with Regulation EU 575/2013 (see Note 22.3).
Likewise, in use of such authority, BBVA carried out, on November 14, 2017 the sixth issuance of perpetual contingent convertible securities (additional tier 1 instrument), with exclusion of pre-emptive subscription rights of shareholders, for a total nominal amount of $1,000 million. This issuance is listed in the Global Exchange Market of the Irish Stock Exchange and was targeted only at qualified investors, not being offered to, and not being subscribed for, in Spain or by Spanish residents. The qualification of this issuance as additional tier 1 capital has been requested (see Note 22.3).
In past years, BBVA has carried out, in use of the authority to issue convertible securities conferred by the AGM held on March 16, 2012 (in effect until March 16, 2017), four additional issuances of perpetual contingent convertible securities (additional tier 1 instrument), with exclusion of pre-emptive subscription rights of shareholders (in April 2013 for an amount of $1.5 billion, in February 2014 and February 2015 for an amount of €1.5 billion each one, and in April 2016 for an amount of €1 billion). These issuances were targeted only at qualified investors and foreign private banking clients not being offered to, and not being subscribed for, in Spain or by Spanish residents. The first two issuances are listed in the Singapore Exchange Securities Trading Limited and the last two issuances are listed in the Global Exchange Market of the Irish Stock Exchange. Furthermore, these four issuances qualify as additional tier 1 capital of the Bank and the Group in accordance with Regulation UE 575/2013 (see Note 22.3).
Capital increase
BBVA’s AGM held on March 17, 2017 resolved, under agenda item four, to confer authority on the Board of Directors to increase Bank’s share capital, on one or several occasions, subject to provisions in the law and in the Company Bylaws that may be applicable at any time, within the legal term of five years of the approval date of the authorization, up to the maximum amount corresponding to 50% of Bank’s share capital at the time on which the resolution was adopted, likewise conferring authority to the Board of Directors to totally or partially exclude shareholders’ pre-emptive subscription rights over any specific issue that may be made under such authority; although the power to exclude pre-emptive subscription rights was limited, such that the nominal amount of the capital increases resolved or effectively carried out with the exclusion of pre- emptive subscription rights in use of the referred authority and those that may be resolved or carried out to cover the conversion of mandatory convertible issues that may equally be made with the exclusion of pre- emptive subscription rights in use of the authority to issue convertible securities conferred by the AGM held on March 17, 2017, under agenda item five (without prejudice to the anti-dilution adjustments) shall not exceed the nominal maximum overall amount of 20% of the share capital of BBVA at the time of the authorization.
As of the date of this document, the Bank’s Board of Directors has not exercised the authority conferred by the AGM.
27. Share premium
As of December 31, 2017, 2016 and 2015, the balance under this heading in the accompanying consolidated balance sheets was €23,992 million.
The amended Spanish Corporation Act expressly permits the use of the share premium balance to increase capital and establishes no specific restrictions as to its use (see Note 26).
28. Retained earnings, revaluation reserves and other reserves
The breakdown of the balance under this heading in the accompanying consolidated balance sheet is as follows:
Retained earnings, revaluation reserves and other reserves. Breakdown by concepts (Millions of euros)
| 2017 | 2016 | 2015 | |
|---|---|---|---|
| Legal reserve | 644 | 624 | 605 |
| Restricted reserve | 159 | 201 | 213 |
| Reserves for regularizations and balance revaluations | 12 | 20 | 22 |
| Voluntary reserves | 8,643 | 8,521 | 6,971 |
| Total reserves holding company (*) | 9,458 | 9,366 | 7,811 |
| Consolidation reserves attributed to the Bank and dependent consolidated companies, | 15,985 | 14,275 | 14,701 |
| Total | 25,443 | 23,641 | 22,512 |
28.1 Legal reserve
Under the amended Corporations Act, 10% of any profit made each year must be transferred to the legal reserve. The transfer must be made until the legal reserve reaches 20% of the common stock.
The legal reserve can be used to increase the common stock provided that the remaining reserve balance does not fall below 10% of the increased capital. While it does not exceed 20% of the common stock, it can only be allocated to offset losses exclusively in the case that there are not sufficient reserves available.
28.2 Restricted reserves
As of December 31, 2017, 2016 and 2015, the Bank’s restricted reserves are as follows:
Restricted Reserves (Millions of euros)
| 2017 | 2016 | 2015 | |
|---|---|---|---|
| Restricted reserve for retired capital | 88 | 88 | 88 |
| Restricted reserve for Parent Company shares and loans for those shares | 69 | 111 | 123 |
| Restricted reserve for redenomination of capital in euros | 2 | 2 | 2 |
| Total | 159 | 201 | 213 |
The restricted reserve for retired capital resulted from the reduction of the nominal par value of the BBVA shares made in April 2000.
The most significant heading corresponds to restricted reserves related to the amount of shares issued by the Bank in its possession at each date, as well as the amount of customer loans outstanding at those dates that were granted for the purchase of, or are secured by, the Parent Company shares.
Finally, pursuant to Law 46/1998 on the Introduction of the Euro, a restricted reserve is recognized as a result of the rounding effect of the redenomination of the Parent Company common stock in euros.
28.3 Retained earnings, revaluation reserves and other reserves by entity
The breakdown, by company or corporate group, under the heading “Reserves” in the accompanying consolidated balance sheets is as follows:
Retained earnings, Revaluation reserves and Other reserves (Millions of euros)
| 2017 | 2016 | 2015 | ||
|---|---|---|---|---|
| Accumulated income and Revaluation reserves | ||||
| Holding Company | 15,625 | 14,101 | 14,763 | |
| BBVA Bancomer Group | 9,442 | 9,108 | 8,178 | |
| BBVA Seguros, S.A. | (215) | (62) | 261 | |
| Corporacion General Financiera, S.A. | 1,202 | 1,187 | 1,192 | |
| BBVA Banco Provincial Group | 1,749 | 1,752 | 1,751 | |
| BBVA Chile Group | 951 | 1,264 | 1,115 | |
| BBVA Paraguay | 108 | 98 | 90 | |
| Compañía de Cartera e Inversiones, S.A. | (20) | (27) | (16) | |
| Anida Grupo Inmobiliario, S.L. | 515 | 528 | 527 | |
| BBVA Suiza, S.A. | (57) | (1) | (4) | |
| BBVA Continental Group | 681 | 611 | 506 | |
| BBVA Luxinvest, S.A. | 25 | 16 | 33 | |
| BBVA Colombia Group | 926 | 803 | 656 | |
| BBVA Banco Francés Group | 999 | 827 | 621 | |
| Banco Industrial De Bilbao, S.A. | 25 | 61 | 33 | |
| Uno-E Bank, S.A | - | - | (62) | |
| Gran Jorge Juan, S.A. | (47) | (30) | (40) | |
| BBVA Portugal Group | (436) | (477) | (511) | |
| Participaciones Arenal, S.L. | (183) | (180) | (180) | |
| BBVA Propiedad S.A. | (503) | (431) | (412) | |
| Anida Operaciones Singulares, S.L. | (4,881) | (4,127) | (3,962) | |
| Grupo BBVA USA Bancshares | (794) | (1,053) | (1,459) | |
| Garanti Turkiye Bankasi Group | 751 | 127 | - | |
| Unnim Real Estate | (576) | (477) | (403) | |
| Bilbao Vizcaya Holding, S.A. | 145 | 139 | 73 | |
| Pecri Inversión S.L. | (73) | (75) | (78) | |
| Other | 127 | 25 | (62) | |
| Subtotal | 25,486 | 23,708 | 22,610 | |
| Reserves or accumulated losses of investments in joint ventures and associates | ||||
| Metrovacesa, S.A. | - | - | (143) | |
| Metrovacesa Suelo, S.A. | (53) | (52) | - | |
| Other | 9 | (15) | 45 | |
| Subtotal | (44) | (67) | (98) | |
| Total | 25,443 | 23,641 | 22,512 |
For the purpose of allocating the reserves and accumulated losses to the consolidated entities and to the parent company, the transfers of reserves arising from the dividends paid and transactions between these entities are taken into account in the period in which they took place.
29. Treasury shares
In the years ended December 31, 2017, 2016 and 2015 the Group entities performed the following transactions with shares issued by the Bank:
Financial Assets Held-for-Trading: Equity instruments by Issuer (Millions of euros)
| 2017 | 2016 | 2015 | ||||
|---|---|---|---|---|---|---|
| Number of Shares | Millions of Euros | Number of Shares | Millions of Euros | Number of Shares | Millions of Euros | |
| Balance at beginning | 7,230,787 | 48 | 38,917,665 | 309 | 41,510,698 | 350 |
| + Purchases | 238,065,297 | 1,674 | 379,850,939 | 2,004 | 431,321,283 | 3,273 |
| - Sales and other changes | (231,956,502) | (1,622) | (411,537,817) | (2,263) | (433,914,316) | (3,314) |
| +/- Derivatives on BBVA shares | - | (4) | - | (1) | - | - |
| +/- Other changes | - | - | - | - | - | - |
| Balance at the end | 13,339,582 | 96 | 7,230,787 | 48 | 38,917,665 | 309 |
| Of which: | ||||||
| Held by BBVA, S.A. | - | - | 2,789,894 | 22 | 1,840,378 | 19 |
| Held by Corporación General Financiera, S.A. | 13,339,582 | 96 | 4,440,893 | 26 | 37,077,287 | 290 |
| Held by other subsidiaries | - | - | - | - | - | - |
| Average purchase price in Euros | 7.03 | 5.27 | 7.60 | |||
| Average selling price in Euros | 6.99 | 5.50 | 7.67 | |||
| Net gain or losses on transactions (Shareholders' funds-Reserves) |
1 | (30) | 6 | |||
The percentages of treasury shares held by the Group in the years ended December 31, 2017, 2016 and 2015 are as follows:
Treasury Stock
| 2017 | 2016 | 2015 | |||||||
|---|---|---|---|---|---|---|---|---|---|
| Min | Max | Closing | Min | Max | Closing | Min | Max | Closing | |
| % treasury stock | 0.004% | 0.278% | 0.200% | 0.081% | 0.756% | 0.110% | 0.000% | 0.806% | 0.613% |
The number of BBVA shares accepted by the Group in pledge of loans as of December 31, 2017, 2016 and 2015 is as follows:
Shares of BBVA Accepted in Pledge
| 2017 | 2016 | 2015 | |
|---|---|---|---|
| Number of shares in pledge | 64,633,003 | 90,731,198 | 92,703,291 |
| Nominal value | 0.49 | 0.49 | 0.49 |
| % of share capital | 0.97% | 1.38% | 1.46% |
The number of BBVA shares accepted by the Group in pledge of loans as of December 31, 2017, 2016 and 2015 is as follows:
Shares of BBVA Owned by Third Parties but Managed by the Group
| 2017 | 2016 | 2015 | |
|---|---|---|---|
| Number of shares owned by third parties | 34,597,310 | 85,766,602 | 92,783,913 |
| Nominal value | 0.49 | 0.49 | 0.49 |
| % of share capital | 0.52% | 1.31% | 1.46% |
30. Accumulated other comprehensive income (loss)
The breakdown of the balance under this heading in the accompanying consolidated balance sheets is as follows:
Accumulated other comprehensive income (Millions of euros)
| 2017 | 2016 | 2015 | |
|---|---|---|---|
| Items that will not be reclassified to profit or loss | (1,183) | (1,095) | (859) |
| Actuarial gains or (-) losses on defined benefit pension plans | (1,183) | (1,095) | (859) |
| Non-current assets and disposal groups classified as held for sale | - | - | - |
| Share of other recognized income and expense of investments in subsidiaries, joint ventures and associates | - | - | - |
| Other adjustments | - | - | - |
| Items that may be reclassified to profit or loss | (7,609) | (4,363) | (2,490) |
| Hedge of net investments in foreign operations [effective portion] | 1 | (118) | (274) |
| Foreign currency translation | (9,159) | (5,185) | (3,905) |
| Hedging derivatives. Cash flow hedges [effective portion] | (34) | 16 | (49) |
| Available-for-sale financial assets | 1,641 | 947 | 1,674 |
| Debt instruments | 1,557 | 1,629 | 1,769 |
| Equity instruments | 84 | (682) | (95) |
| Non-current assets and disposal groups classified as held for sale | (26) | - | - |
| Share of other recognized income and expense of investments in subsidiaries, joint ventures and associates | (31) | (23) | 64 |
| Total | (8,792) | (5,458) | (3,349) |
The balances recognized under these headings are presented net of tax.
The majority of the balance is related to the conversion to euros of the financial statements balances from consolidated entities whose functional currency is not euros. In this regard, the increase in item "Foreign currency translation" in the above table in the year 2017 is mainly related to the depreciation of the Mexican peso and the Turkish lira (see Note 2.2.16).
31. Non-controlling interest
The breakdown by groups of consolidated entities of the balance under the heading “Non-controlling interest” of total equity in the accompanying consolidated balance sheets is as follows:
Non-Controlling Interests (Millions of euros)
| 2017 | 2016 | 2015 | |
|---|---|---|---|
| BBVA Colombia Group | 65 | 67 | 58 |
| BBVA Chile Group | 399 | 377 | 314 |
| BBVA Banco Continental Group | 1,059 | 1,059 | 913 |
| BBVA Banco Provincial Group | 78 | 97 | 100 |
| BBVA Banco Francés Group | 420 | 243 | 220 |
| Garanti Group | 4,903 | 6,157 | 6,302 |
| Other entities | 55 | 64 | 86 |
| Total | 6,979 | 8,064 | 7,992 |
The decrease in the heading “Minority interest” corresponds to the acquisition of the 9.95% of Garanti Group (see Note 3).
These amounts are broken down by groups of consolidated entities under the heading “Profit - Attributable to non-controlling interests” in the accompanying consolidated income statements:
Profit attributable to Non-Controlling Interests (Millions of euros)
| 2017 | 2016 | 2015 | |
|---|---|---|---|
| BBVA Colombia Group | 7 | 9 | 11 |
| BBVA Chile Group | 51 | 40 | 42 |
| BBVA Banco Continental Group | 208 | 193 | 211 |
| BBVA Banco Provincial Group | (2) | (2) | - |
| BBVA Banco Francés Group | 93 | 55 | 76 |
| Garanti Group | 883 | 917 | 316 |
| Other entities | 4 | 8 | 30 |
| Total | 1,244 | 1,218 | 686 |
Dividends distributed to non-controlling interest of the Group during the year 2017 are: BBVA Banco Continental Group €104 million, BBVA Chile Group €11 million, BBVA Banco Francés Group €8 million, Garanti Group €158 million, BBVA Colombia Group €3 million, and other Spanish entities accounted for €8 million.
32. Capital base and capital management
32.1 Capital base
As of December 31, 2017, 2016 and 2015, equity is calculated in accordance with current regulation on minimum capital base requirements for Spanish credit institutions –both as individual entities and as consolidated group– and how to calculate them, as well as the various internal capital adequacy assessment processes they should have in place and the information they should disclose to the market.
The minimum capital base requirements established by the current regulation are calculated according to the Group’s exposure to credit and dilution risk, counterparty and liquidity risk relating to the trading portfolio, exchange-rate risk and operational risk. In addition, the Group must fulfill the risk concentration limits established in said regulation and the internal corporate governance obligations.
As a result of the Supervisory Review and Evaluation Process (SREP) carried out by the European Central Bank (ECB), BBVA has received a communication from the ECB requiring BBVA to maintain, effective from the 1 st of January 2018, a (i) CET1 phased-in capital of 8.438% at a consolidated level and 7.875% at an individual level; and (ii) a phased-in total capital ratio of 11.938% at the consolidated level and 11.375% at the individual level.
This total consolidated capital ratio of 11.938% includes: i) the minimum CET1 capital ratio required under Pillar 1 (4.5%); ii) Pillar 1 Additional Tier 1 capital requirements (1.5%); iii) Pillar 1 Tier 2 capital requirements (2%); iv) Pillar 2 CET1 capital requirements (1.5%); v) the capital conservation buffer (CCB) (1.875% CET1 phased-in) and vi) the Other Systemic Important Institution buffer (OSII) (0.563% CET1 phased-in).
Since BBVA has been excluded from the list of global systemically important financial institutions in 2017 (which is updated every year by the Financial Stability Board (FSB)), as of January 1, 2018, the G-SIB buffer will not apply to BBVA in 2018, (notwithstanding the possibility that the FSB or the supervisor may include BBVA on it in the future).
However, the supervisor has informed BBVA that it is included on the list of other systemically important financial institutions, and a D-SIB buffer of 0.75% of the fully-loaded ratio applies at the consolidated level. It will be implemented gradually from January 1, 2016 to January 1, 2019.
The Group’s bank capital in accordance with the aforementioned applicable regulation, considering entities scope required by the above regulation, as of December 31, 2017, 2016 and 2015, is shown below:
Eligible capital resources (Millions of euros)
| Notes | December 2017 (*) (**) | December 2016 (***) | December 2015 | |
|---|---|---|---|---|
| Capital | 26 | 3,267 | 3,218 | 3,120 |
| Share premium | 27 | 23,992 | 23,992 | 23,992 |
| Retained earnings, revaluation reserves and other reserves | 28 | 25,443 | 23,641 | 22,512 |
| Other equity instruments, net | 28 | 54 | 54 | 35 |
| Treasury shares | 29 | (96) | (48) | (309) |
| Attributable to the parent company | 6 | 3,519 | 3,475 | 2,642 |
| Attributable dividend | 4 | (1,043) | (1,510) | (1,352) |
| Total equity | 55,136 | 52,821 | 50,640 | |
| Accumulated other comprehensive income | 30 | (8,792) | (5,458) | (3,349) |
| Non-controlling interest | 31 | 6,979 | 8,064 | 8,149 |
| Shareholders' equity | 53,323 | 55,428 | 55,440 | |
| Intangible assets | (6,627) | (5,675) | (3,901) | |
| Fin. treasury shares | (48) | (82) | (95) | |
| Indirect treasury shares | (134) | (51) | (415) | |
| Deductions | (6,809) | (5,808) | (4,411) | |
| Temporary CET 1 adjustments | (273) | (129) | (788) | |
| Capital gains from the Available-for-sale debt instruments portfolio | (256) | (402) | (796) | |
| Capital gains from the Available-for-sale equity portfolio | (17) | 273 | 8 | |
| Differences from solvency and accounting level | (189) | (120) | (40) | |
| Equity not eligible at solvency level | (462) | (249) | (828) | |
| Other adjustments and deductions | (3,715) | (2,001) | (1,647) | |
| Common Equity Tier 1 (CET 1) | 42,337 | 47,370 | 48,554 | |
| Additional Tier 1 before Regulatory Adjustments | 6,296 | 6,114 | 5,302 | |
| Total Regulatory Adjustments of Additional Tier 1 | (1,656) | (3,401) | (5,302) | |
| Tier 1 | 46,977 | 50,083 | 48,554 | |
| Tier 2 | 9,137 | 8,810 | 11,646 | |
| Total Capital (Total Capital=Tier 1 + Tier 2) | 56,114 | 58,893 | 60,200 | |
| Total Minimum equity required | 40,238 | 37,923 | 38,125 |
Capital Base (Millions of euros)
| 2017 (*) | 2016 | 2015 | |
|---|---|---|---|
| Tier 1 (thousand of euros) (a) | 46,977 | 50,083 | 48,554 |
| Exposure (thousand of euros) (b) | 700,443 | 747,216 | 766,589 |
| Leverage ratio (a)/(b) (percentage) | 6.71% | 6.70% | 6.33% |
As of December 31, 2017, the phased-in Common Equity Tier 1 (CET1) stood at 11.7%, accounting a decrease with respect to December 2016 of 47 basis points. The negative effect on the minority interests and deductions due to the regulatory phase-in calendar of 80% in 2017 compared to 60% in 2016 has an impact of -56 basis points which is compensated by the organic generation of capital leaning against the recurrence of the results, net of dividends paid and remunerations.
It should be noted that CET1 ratio was affected by corporate transactions carried out during 2017, in particular the acquisition of an additional 9.95% stake in Garanti and the sale of 1.7% in CNCB. Both transactions had a combined negative impact on the ratio of -13 basis points (see Note 3).
Additionally, BBVA Group has registered a negative charge in the income statements of 2017 up to €1,123 million due to the unrealized losses from its shares in Telefonica. However, this impact does not affect the equity or the capital ratio since these unrealized losses were already accounted for (see Note 12.4).
During 2017 BBVA Group continued to strengthen its capital position with the issuance of new perpetual securities eventually convertible into shares, classified as additional TIER1 equity instruments (contingent convertible) amounting to €500 million and $1,000 million (the latter in the American market, with the prospectus registered at the Securities and Exchange Commission and not yet included in the Group’s TIER1 capital as of December 31, 2017).
Regarding TIER2, BBVA, S.A. issued subordinated debts with a total amount of €1,500 million; and Garanti issued a subordinated debt of $750 million.
Finally, the total phased-in capital ratio stood at 15.5% reflecting the effects discussed above.
These levels are above the requirements established by the ECB in its SREP letter and the systemic buffers applicable to BBVA Group for the CET1 ratio in 2017 (11.125%).
Risk-weighted assets decreased approximately by 7% compared to December 31, 2016, mainly explained by the impact of the general depreciation of certain local currencies and the efficient management and allocation of capital in line with the strategic objectives of the Group.
A reconciliation of the balance sheet to the accounting and regulatory scope (provisional data) as of December 31, 2017 is provided below:
Public balance sheet headings (Millions of euros)
| Public balance sheet | Insurance companies and real estate companies (1) | Jointly-controlled entities and other adjustments (2) | Regulatory balance sheet | |
|---|---|---|---|---|
| Cash and balances with central banks and other demand deposits | 42,680 | - | 24 | 42,704 |
| Financial assets held for trading | 64,695 | 2,206 | - | 66,901 |
| Other financial assets designated at fair value through profit or loss | 2,709 | (2,061) | - | 648 |
| Available for sale financial assets | 69,476 | (19,794) | - | 49,682 |
| Loans and receivables | 431,521 | (1,805) | 764 | 430,480 |
| Held to maturity investments | 13,754 | - | - | 13,754 |
| Hedgind derivatives | 2,485 | (90) | (1) | 2,394 |
| Fair value changes of the hedged items in portfolio hedges of interest rate risk | (25) | - | - | (25) |
| Investments in entities accounted for using the equity method | 1,588 | 3,294 | (80) | 4,802 |
| Non-current assets held for sale | 23,853 | (334) | 3 | 23,522 |
| Other | 37,323 | 595 | 5 | 37,923 |
| Total assets | 690,059 | (17,989) | 715 | 672,785 |
32.2 Capital management
Capital management in the BBVA Group has a twofold aim:
This capital management is carried out determining the capital base and the solvency ratios established by the prudential and minimum capital requirements also have to be met for the entities subject to prudential supervision in each country.
The current regulation allows each entity to apply its own internal ratings-based (IRB) approach to risk assessment and capital management, subject to Bank of Spain approval. The BBVA Group carries out an integrated management of these risks in accordance with its internal policies and its internal capital estimation model has received the Bank of Spain’s approval for certain portfolios (see Note 7).
33. Commitments and guarantees given
The breakdown of the balance under these headings in the accompanying consolidated balance sheets is as follows:
Loan commitments, financial guarantees and other commitments (*) (Millions of euros)
| Notes | 2017 | 2016 | 2015 | |
|---|---|---|---|---|
| Loan commitments given | 7.3.1 | 94,268 | 107,254 | 123,620 |
| of which: defaulted | 537 | 411 | 446 | |
| Central banks | 1 | 1 | 8 | |
| General governments | 2,198 | 4,354 | 3,823 | |
| Credit institutions | 946 | 1,209 | 1,239 | |
| Other financial corporations | 3,795 | 4,155 | 4,032 | |
| Non-financial corporations | 58,133 | 71,710 | 71,583 | |
| Households | 29,195 | 25,824 | 42,934 | |
| Financial guarantees given | 7.3.1 | 16,545 | 18,267 | 19,176 |
| of which: defaulted | 278 | 278 | 146 | |
| Central banks | - | - | - | |
| General governments | 248 | 103 | 100 | |
| Credit institutions | 1,158 | 1,553 | 1,483 | |
| Other financial corporations | 3,105 | 722 | 1,621 | |
| Non-financial corporations | 11,518 | 15,354 | 15,626 | |
| Households | 516 | 534 | 346 | |
| Other commitments and guarantees given | 7.3.1 | 45,738 | 42,592 | 42,813 |
| of which: defaulted | 461 | 402 | 517 | |
| Central banks | 4 | 12 | 15 | |
| General governments | 227 | 372 | 101 | |
| Credit institutions | 15,330 | 9,880 | 9,640 | |
| Other financial corporations | 3,820 | 4,892 | 5,137 | |
| Non-financial corporations | 25,992 | 27,297 | 27,765 | |
| Households | 362 | 138 | 156 | |
| Total Loan commitments and financial guarantees | 156,551 | 168,113 | 185,609 |
As of December 31, 2017, the provisions of loan commitments given, financial guarantees given and other commitments and guarantees given, disclosed in the consolidated balance sheet amounted €199 million, €190 million and €188 million, respectively.
Since a significant portion of the amounts above will expire without any payment being made by the consolidated entities, the aggregate balance of these commitments cannot be considered the actual future requirement for financing or liquidity to be provided by the BBVA Group to third parties.
In the years 2017, 2016 and 2015, no issuance of debt securities carried out by associates of the BBVA Group, joint venture entities or non-Group entities have been guaranteed.
34. Other contingent assets and liabilities
As of December 31, 2017, 2016 and 2015, there were no material contingent assets or liabilities other than those disclosed in the accompanying notes to the financial statements.
35. Purchase and sale commitments and future payment obligations
The breakdown of purchase and sale commitments of the BBVA Group as of December 31, 2017, 2016 and 2015 is as follows:
Purchase and Sale Commitments (Millions of euros)
| Notes | 2017 | 2016 | 2015 | |
|---|---|---|---|---|
| Financial Instruments sold with repurchase commitments | 40,077 | 46,562 | 68,401 | |
| Central Banks | 9 | 6,155 | 4,649 | 19,065 |
| Credit Institutions | 22.1 | 24,843 | 28,421 | 26,069 |
| General governments | 22.2 | 3 | - | 7,556 |
| Other | 22.2 | 9,076 | 13,491 | 15,711 |
| Financial instruments purchased with resale commitments | 26,368 | 22,921 | 16,935 | |
| Central Banks | 305 | 81 | 149 | |
| Credit Institutions | 13.1 | 13,861 | 15,561 | 11,749 |
| General governments | 13.2 / 11 | 1,290 | 544 | 326 |
| Other | 13.2 | 10,912 | 6,735 | 4,710 |
A breakdown of the maturity of other payment obligations, not included in previous notes, due after December 31, 2017 is provided below:
Maturity of Future Payment Obligations (Millions of euros)
| Up to 1 Year | 1 to 3 Years | 3 to 5 Years | Over 5 Years | Total | |
|---|---|---|---|---|---|
| Finance leases | - | - | - | - | - |
| Operating leases | 343 | 301 | 531 | 2,410 | 3,584 |
| Purchase commitments | 29 | - | - | - | 29 |
| Technology and systems projects | 9 | - | - | - | 9 |
| Other projects | 20 | - | - | - | 20 |
| Total | 372 | 301 | 531 | 2,410 | 3,614 |
36. Transactions on behalf of third parties
As of December 31, 2017, 2016 and 2015 the details of the most significant items under this heading are as follows:
Transactions on Behalf of Third Parties (Millions of euros)
| 2017 | 2016 | 2015 | |
|---|---|---|---|
| Financial instruments entrusted to BBVA by third parties | 624,822 | 637,761 | 664,911 |
| Conditional bills and other securities received for collection | 14,775 | 16,054 | 15,064 |
| Securities lending | 5,485 | 3,968 | 4,125 |
| Total | 645,081 | 657,783 | 684,100 |
As of December 31, 2017, 2016 and 2015 the customer funds managed by the BBVA Group are as follows:
Customer Funds by Type (Millions of euros)
| 2017 | 2016 | 2015 | |
|---|---|---|---|
| Asset management by type of customer (*): | |||
| Collective investment | 60,939 | 55,037 | 54,419 |
| Pension funds | 33,985 | 33,418 | 31,542 |
| Customer portfolios managed | 36,901 | 40,805 | 42,074 |
| Of which: | |||
| Portfolios managed on a discretionary basis | 19,628 | 18,165 | 19,919 |
| Other resources | 3,081 | 2,831 | 3,786 |
| Customer resources distributed but not managed by type of product: | |||
| Collective investment | 3,407 | 3,695 | 4,181 |
| Insurance products | 35 | 39 | 41 |
| Other | - | - | 31 |
| Total | 138,347 | 135,824 | 136,074 |
37. Interest income and expense
37.1 Interest income
The breakdown of the interest and similar income recognized in the accompanying consolidated income statement is as follows:
Interest Income. Breakdown by Origin (Millions of euros)
| Notes | 2017 | 2016 | 2015 | |
|---|---|---|---|---|
| Central Banks | 406 | 229 | 140 | |
| Loans and advances to credit institutions | 410 | 217 | 260 | |
| Loans and advances to customers | 22,699 | 21,608 | 19,200 | |
| Debt securities | 3,809 | 4,128 | 3,792 | |
| Held for trading | 1,263 | 1,014 | 981 | |
| Other portfolios | 2,546 | 3,114 | 2,810 | |
| Adjustments of income as a result of hedging transactions | 427 | (385) | (382) | |
| Cash flow hedges (effective portion) | 15 | 12 | 47 | |
| Fair value hedges | 412 | (397) | (429) | |
| Insurance activity | 1,058 | 1,219 | 1,152 | |
| Other income | 487 | 692 | 621 | |
| Total | 55.2 | 29,296 | 27,708 | 24,783 |
The amounts recognized in consolidated equity in connection with hedging derivatives and the amounts derecognized from consolidated equity and taken to the consolidated income statement during both periods are given in the accompanying “Consolidated statements of recognized income and expenses”.
37.2 Interest expense
The breakdown of the balance under this heading in the accompanying consolidated income statements is as follows:
Interest Expenses. Breakdown by Origin (Millions of euros)
| 2017 | 2016 | 2015 | |
|---|---|---|---|
| Central banks | 123 | 192 | 138 |
| Deposits from credit institutions | 1,880 | 1,367 | 1,186 |
| Customers deposits | 5,814 | 5,766 | 4,340 |
| Debt securities issued | 1,930 | 2,323 | 2,548 |
| Adjustments of expenses as a result of hedging transactions | 665 | (574) | (859) |
| Cash flow hedges (effective portion) | 38 | 42 | (16) |
| Fair value hedges | 627 | (616) | (844) |
| Cost attributable to pension funds | 125 | 96 | 108 |
| Insurance activity | 682 | 846 | 816 |
| Other expenses | 316 | 634 | 484 |
| Total | 11,537 | 10,648 | 8,761 |
37.3 Average return on investments and average borrowing cost
The detail of the average return on investments in the years ended December 31, 2017, 2016 and 2015 is as follows:
Assets (Millions of euros)
| 2017 | 2016 | 2015 | |||||||
|---|---|---|---|---|---|---|---|---|---|
| Average Balances | Interest income | Average Interest Rates (%) | Average Balances | Interest income | Average Interest Rates (%) | Average Balances | Interest income | Average Interest Rates (%) | |
| Cash and balances with central banks and other demand deposits | 33,917 | 83 | 0.25 | 26,209 | 10 | 0.04 | 23,542 | 2 | 0.01 |
| Securities portfolio and derivatives | 177,164 | 4,724 | 2.67 | 202,388 | 5,072 | 2.51 | 211,589 | 4,673 | 2.21 |
| Loans and advances to central banks | 10,945 | 258 | 2.36 | 15,326 | 229 | 1.50 | 12,004 | 140 | 1.17 |
| Loans and advances to credit institutions | 26,420 | 485 | 1.83 | 28,078 | 218 | 0.78 | 27,171 | 270 | 0.99 |
| Loans and advances to customers | 407,153 | 23,261 | 5.71 | 410,895 | 21,853 | 5.32 | 382,125 | 19,471 | 5.10 |
| Euros | 196,893 | 3,449 | 1.75 | 201,967 | 3,750 | 1.86 | 196,987 | 4,301 | 2.18 |
| Foreign currency | 210,261 | 19,812 | 9.42 | 208,928 | 18,104 | 8.67 | 185,139 | 15,170 | 8.19 |
| Other assets | 48,872 | 485 | 0.99 | 52,748 | 325 | 0.62 | 49,128 | 226 | 0.46 |
| Total | 704,471 | 29,296 | 4.16 | 735,645 | 27,708 | 3.77 | 705,559 | 24,783 | 3.51 |
The average borrowing cost in the years ended December 31, 2017, 2016 and 2015 is as follows:
Liabilities (Millions of euros)
| 2017 | 2016 | 2015 | |||||||
|---|---|---|---|---|---|---|---|---|---|
| Average Balances | Interest expenses | Average Interest Rates (%) | Average Balances | Interest expenses | Average Interest Rates (%) | Average Balances | Interest expenses | Average Interest Rates (%) | |
| Deposits from central banks and credit institutions | 90,619 | 2,212 | 2.44 | 101,975 | 1,866 | 1.83 | 99,289 | 1,559 | 1.57 |
| Customer deposits | 392,057 | 7,007 | 1.79 | 398,851 | 5,944 | 1.49 | 366,249 | 4,390 | 1.20 |
| Euros | 186,261 | 461 | 0.25 | 195,310 | 766 | 0.39 | 187,721 | 1,024 | 0.55 |
| Foreign currency | 205,796 | 6,546 | 3.18 | 203,541 | 5,178 | 2.54 | 178,528 | 3,366 | 1.89 |
| Debt securities issued | 84,221 | 1,631 | 1.94 | 89,876 | 1,738 | 1.93 | 89,672 | 1,875 | 2.09 |
| Other liabilities | 82,699 | 687 | 0.83 | 89,328 | 1,101 | 1.23 | 96,049 | 936 | 0.97 |
| Equity | 54,874 | - | - | 55,616 | - | - | 54,300 | - | - |
| Total | 704,471 | 11,537 | 1.64 | 735,645 | 10,648 | 1.45 | 705,559 | 8,761 | 1.24 |
The change in the balance under the headings “Interest and similar income” and “Interest and similar expenses” in the accompanying consolidated income statements is the result of exchange rate effect, changing prices (price effect) and changing volume of activity (volume effect), as can be seen below:
Interest Income and Expenses : Change in the Balance (Millions of euros)
| 2017 / 2016 | 2016 / 2015 | |||||
|---|---|---|---|---|---|---|
| Volume Effect (1) | Price Effect(2) | Total Effect | Volume Effect (1) | Price Effect(2) | Total Effect | |
| Cash and balances with central banks and other demand deposits | 3 | 71 | 74 | - | 7 | 8 |
| Securities portfolio and derivatives | (632) | 285 | (347) | (203) | 602 | 399 |
| Loans and advances to Central Banks | (66) | 94 | 29 | 39 | 51 | 89 |
| Loans and advances to credit institutions | (13) | 279 | 266 | 9 | (61) | (52) |
| Loans and advances to customers | (199) | 1,606 | 1,408 | 1,466 | 916 | 2,382 |
| In Euros | (94) | (206) | (301) | 109 | (660) | (552) |
| In other currencies | 115 | 1,593 | 1,708 | 1,949 | 985 | 2,934 |
| Other assets | (24) | 184 | 160 | 17 | 82 | 99 |
| Interest income | 1,588 | 2,925 | ||||
| Deposits from central banks and credit institutions | (208) | 554 | 346 | 42 | 265 | 307 |
| Customer deposits | (101) | 1,164 | 1,063 | 391 | 1,162 | 1,553 |
| Domestic | (35) | (269) | (305) | 41 | (300) | (258) |
| Foreign | 57 | 1,311 | 1,368 | 472 | 1,340 | 1,812 |
| Debt securities issued | (109) | 3 | (106) | 4 | (142) | (137) |
| Other liabilities | (82) | (332) | (414) | (66) | 230 | 165 |
| Interest expenses | 889 | 1,888 | ||||
| Net Interest Income | 699 | 1,037 | ||||
38. Dividend income
The balances for this heading in the accompanying consolidated income statements correspond to dividends on shares and equity instruments other than those from shares in entities accounted for using the equity method (see Note 39), as can be seen in the breakdown below:
Dividend Income (Millions of euros)
| 2017 | 2016 | 2015 | |
|---|---|---|---|
| Dividends from: | |||
| Financial assets held for trading | 145 | 156 | 144 |
| Available-for-sale financial assets | 188 | 307 | 271 |
| Other | - | 5 | - |
| Total | 334 | 467 | 415 |
39. Share of profit or loss of entities accounted for using the equity method
The breakdown of the balance under the heading “Investments in Entities Accounted for Using the Equity Method (see Note 16) in the accompanying consolidated income statements is as follows:
Investments in Entities Accounted for Using the Equity Method (Millions of euros)
| Notas | 2017 | 2016 | 2015 | |
|---|---|---|---|---|
| Garanti Group | 3 | - | - | 167 |
| Metrovacesa, S.A. | - | - | (46) | |
| Other | 4 | 25 | 53 | |
| Total | 4 | 25 | 174 |
40. Fee and commission income and expense
The breakdown of the balance under this heading in the accompanying consolidated income statements is as follows:
Fee and Commission Income (Millions of euros)
| 2017 | 2016 | 2015 | |
|---|---|---|---|
| Bills receivables | 46 | 52 | 94 |
| Demand accounts | 507 | 469 | 405 |
| Credit and debit cards | 2,834 | 2,679 | 2,336 |
| Checks | 212 | 207 | 239 |
| Transfers and others payment orders | 601 | 578 | 474 |
| Insurance product commissions | 192 | 178 | 171 |
| Commitment fees | 231 | 237 | 172 |
| Contingent risks | 396 | 406 | 360 |
| Asset Management | 923 | 839 | 686 |
| Securities fees | 385 | 335 | 283 |
| Custody securities | 122 | 122 | 314 |
| Other fees and commissions | 700 | 701 | 807 |
| Total | 7,150 | 6,804 | 6,340 |
Fee and Commission Expense (Millions of euros)
| 2017 | 2016 | 2015 | |
|---|---|---|---|
| Credit and debit cards | 1,458 | 1,334 | 1,113 |
| Transfers and others payment orders | 102 | 102 | 92 |
| Commissions for selling insurance | 60 | 63 | 69 |
| Other fees and commissions | 610 | 587 | 454 |
| Total | 2,229 | 2,086 | 1,729 |
41. Gains (losses) on financial assets and liabilities, net and Exchange Difference
The breakdown of the balance under this heading, by source of the related items, in the accompanying consolidated income statement is as follows:
Gains or losses on financial assets and liabilities and exchange differences: Breakdown by Heading of the Consolidated Income Statement (Millions of euros)
| 2017 | 2016 | 2015 | |
|---|---|---|---|
| Gains or (losses) on derecognition of financial assets and liabilities not measured at fair value through profit or loss, net | 985 | 1,375 | 1,055 |
| Available-for-sale financial assets | 843 | 1,271 | 980 |
| Loans and receivables | 133 | 95 | 76 |
| Other | 9 | 10 | (1) |
| Gains or (losses) on financial assets and liabilities held for trading, net | 218 | 248 | (409) |
| Gains or (losses) on financial assets and liabilities designated at fair value through profit or loss, net | (56) | 114 | 126 |
| Gains or (losses) from hedge accounting, net | (209) | (76) | 93 |
| Subtotal Gains or (losses) on financial assets and liabilities | 938 | 1,661 | 865 |
| Exchange Differences | 1,030 | 472 | 1,165 |
| Total | 1,968 | 2,133 | 2,030 |
The breakdown of the balance (excluding exchange rate differences) under this heading in the accompanying income statements by the nature of financial instruments is as follows:
Gains or losses on financial assets and liabilities: Breakdown by nature of the Financial Instrument (Millions of euros)
| 2017 | 2016 | 2015 | |
|---|---|---|---|
| Debt instruments | 545 | 906 | 522 |
| Equity instruments | 845 | 459 | (414) |
| Loans and advances to customers | 97 | 65 | 88 |
| Trading derivatives and hedge accounting | (470) | 109 | 561 |
| Customer deposits | (96) | 87 | 83 |
| Other | 18 | 35 | 25 |
| Total | 938 | 1,661 | 865 |
The breakdown of the balance of the impact of the derivatives (trading and hedging) under this heading in the accompanying consolidated income statements is as follows:
Derivatives - Hedge accounting (Millions of euros)
| 2017 | 2016 | 2015 | |
|---|---|---|---|
| Derivatives | |||
| Interest rate agreements | 165 | 431 | 666 |
| Security agreements | (139) | 86 | 751 |
| Commodity agreements | 99 | (29) | (1) |
| Credit derivative agreements | (564) | (118) | 39 |
| Foreign-exchange agreements | 315 | 186 | (1,001) |
| Other agreements | (137) | (371) | 15 |
| Subtotal | (261) | 185 | 468 |
| Hedging Derivatives Ineffectiveness | |||
| Fair value hedges | (177) | (76) | 80 |
| Hedging derivative | (236) | (330) | (28) |
| Hedged item | 59 | 254 | 108 |
| Cash flow hedges | (32) | - | 13 |
| Subtotal | (209) | (76) | 93 |
| Total | (470) | 109 | 561 |
In addition, in the years ended December31, 2017, 2016 and 2015, under the heading “Gains or losses on financial assets and liabilities held for trading, net” of the consolidated income statement, net amounts of negative €235 million, positive €151 million and positive €135 million, respectively, were recognized for transactions with foreign exchange trading derivatives.
42. Other operating income and expense
The breakdown of the balance under the heading “Other operating income” in the accompanying consolidated income statements is as follows:
Other operating income (Millions of euros)
| 2017 | 2016 | 2015 | |
|---|---|---|---|
| Gains from sales of non-financial services | 1,109 | 882 | 912 |
| Of which: Real estate | 884 | 588 | 668 |
| Rest of other operating income | 330 | 390 | 403 |
| Of which: net profit from building leases | 61 | 76 | 90 |
| Total | 1,439 | 1,272 | 1,315 |
The breakdown of the balance under the heading “Other operating expense” in the accompanying consolidated income statements is as follows:
Other operating expense (Millions of euros)
| 2017 | 2016 | 2015 | |
|---|---|---|---|
| Change in inventories | 886 | 617 | 678 |
| Of Which: Real estate | 816 | 511 | 594 |
| Rest of other operating expenses | 1,337 | 1,511 | 1,607 |
| Total | 2,223 | 2,128 | 2,285 |
43. Income and expense from insurance and reinsurance contracts
The breakdown of the balance under the headings “Income and expense from insurance and reinsurance contracts” in the accompanying consolidated income statements is as follows:
Other operating income and expense on insurance and reinsurance contracts (Millions of euros)
| 2017 | 2016 | 2015 | |
|---|---|---|---|
| Income on insurance and reinsurance contracts | 3,342 | 3,652 | 3,678 |
| Expenses on insurance and reinsurance contracts | (2,272) | (2,545) | (2,599) |
| Total | 1,069 | 1,107 | 1,080 |
The table below shows the contribution of each insurance product to the Group’s income for the years ended December 31, 2017, 2016 and 2015:
Income by type of insurance product (Millions of euros)
| 2017 | 2016 | 2015 | |
|---|---|---|---|
| Life insurance | 604 | 634 | 670 |
| Individual | 346 | 268 | 329 |
| Savings | 38 | 30 | 80 |
| Risk | 308 | 238 | 249 |
| Group insurance | 258 | 366 | 342 |
| Savings | (4) | 8 | 22 |
| Risk | 263 | 357 | 320 |
| Non-Life insurance | 464 | 474 | 409 |
| Home insurance | 118 | 131 | 127 |
| Other non-life insurance products | 346 | 342 | 283 |
| Total | 1,069 | 1,107 | 1,080 |
44. Administration costs
44.1 Personnel expenses
The breakdown of the balance under this heading in the accompanying consolidated income statements is as follows:
Personnel Expenses (Millions of euros)
The breakdown of the average number of employees in the BBVA Group in the year ended December 31, 2017, 2016 and 2015 by professional categories and geographical areas is as follows:
Average Number of Employees by Geographical Areas
| 2017 | 2016 | 2015 | |
|---|---|---|---|
| Spanish banks | |||
| Management Team | 1,026 | 1,044 | 1,026 |
| Other line personnel | 22,180 | 23,211 | 22,702 |
| Clerical staff | 3,060 | 3,730 | 4,033 |
| Branches abroad | 603 | 718 | 747 |
| Subtotal | 26,869 | 28,703 | 28,508 |
| Companies abroad | |||
| Mexico | 30,664 | 30,378 | 29,711 |
| United States | 9,532 | 9,710 | 9,969 |
| Turkey | 23,154 | 23,900 | 11,814 |
| Venezuela | 4,379 | 5,097 | 5,183 |
| Argentina | 6,173 | 6,041 | 5,681 |
| Colombia | 5,374 | 5,714 | 5,628 |
| Peru | 5,571 | 5,455 | 5,357 |
| Other | 5,501 | 5,037 | 4,676 |
| Subtotal | 90,348 | 91,332 | 78,019 |
| Pension fund managers | 362 | 335 | 332 |
| Other non-banking companies | 14,925 | 16,307 | 17,337 |
| Total | 132,504 | 136,677 | 124,196 |
| Of Which: | |||
| Men | 60,730 | 62,738 | 57,841 |
| Women | 71,774 | 73,939 | 66,355 |
| Of Which: | |||
| BBVA, S.A. | 26,869 | 25,979 | 25,475 |
The breakdown of the number of employees in the BBVA Group as of December 31, 2017, 2016 and 2015 by category and gender is as follows:
Number of Employees at the period end. Professional Category and Gender
| 2017 | 2016 | 2015 | ||||
|---|---|---|---|---|---|---|
| Male | Female | Male | Female | Male | Female | |
| Management Team | 1,244 | 342 | 1,331 | 350 | 1,493 | 365 |
| Other line personnel | 38,670 | 39,191 | 38,514 | 39,213 | 38,204 | 38,868 |
| Clerical staff | 20,639 | 31,770 | 22,066 | 33,318 | 23,854 | 35,184 |
| Total | 60,553 | 71,303 | 61,911 | 72,881 | 63,551 | 74,417 |
44.1.1 Share-based employee remuneration
The amounts recognized under the heading “Administration costs - Personnel expenses - Other personnel expenses” in the consolidated income statements for the year ended December 31, 2017, 2016 and 2015 correspond to the plans for remuneration based on equity instruments in each year, amounted to €38 million, €57 million and €38 million, respectively. These amounts have been recognized with a corresponding entry under the heading “Shareholders’ funds - Other equity instruments” in the accompanying consolidated balance sheets, net of tax effect.
The characteristics of the Group's remuneration plans based on equity instruments are described below.
System of Variable Remuneration in Shares
In BBVA, the annual variable remuneration applying generally to all employees consists of one incentive, to be paid in cash, awarded once a year and linked to the achievement of predetermined objectives and to a sound risk management (hereinafter, the “Annual Variable Remuneration”).
According to the remuneration policy for BBVA Group, in force until 2016, the specific settlement and payment system for the Annual Variable Remuneration applicable to those employees and senior managers whose professional activities have a significant impact on the Group’s risk profile including the executive directors and members of BBVA Senior Management (hereinafter, the "Identified Staff"), which includes, among others, the payment in shares of part of their Annual Variable Remuneration.
According to the remuneration policy for BBVA Group, in force until 2016, the specific settlement and payment system for the Annual Variable Remuneration applicable to those employees and senior managers whose professional activities have a significant impact on the Group’s risk profile including the executive directors and members of BBVA Senior Management (hereinafter, the "Identified Staff"), which includes, among others, the payment in shares of part of their Annual Variable Remuneration.
This remuneration policy was approved, with respect to BBVA directors, by the Annual General Shareholders' Meeting held on March 13, 2015.
The specific rules of the settlement and payment system of 2016 Annual Variable Remuneration which have given rise to the delivery of shares in 2017 to executive directors and members of the Senior Management are described in Note 54, while the rules listed below were established to the rest of the Identified Staff:
In this regard, the Annual General Meeting resolved, in line with applicable legislation, the application of the maximum level of variable remuneration up to 200% of the fixed remuneration for a specific group of employees whose professional activities have a material impact on the Group’s risk profile, and to enlarge this group, whose variable remuneration will be subject to the maximum threshold of 200% of the fixed component of their total remuneration. This is entirely consistent with the Recommendations Report issued by the BBVA's Board of Directors.
According to the settlement and payment scheme indicated, during 2017, members of the Identified Staff received a total amount of 6,481,409 shares corresponding to the initial payment corresponding to 2016 Annual Variable Remuneration to be delivered in shares.
Additionally, the remuneration policy prevailing until 2014 provided for a specific settlement and payment scheme for the variable remuneration of the Identified Staff that established a three-year deferral period for the Annual Variable Remuneration, being the deferred amount paid in thirds over this period in equal parts, in cash and in BBVA shares.
According to this prior scheme, during 2017, the members of the Identified Staff received the shares corresponding to the deferred parts of the Annual Variable Remuneration from previous years, and their corresponding adjustments in cash, delivery of which corresponded in 2017, were delivered to the beneficiary members of the Identified Staff, resulting in (i) a total amount of 943,955 shares corresponding to the second deferred third of the 2014 Annual Variable Remuneration and €697,583 as adjustments for updates of the shares granted; and (ii) a total amount of 437,069 shares corresponding to the last deferred third of the 2013 Annual Variable Remuneration and €501,318 in adjustments for updates.
The information on the delivery of shares to executive Directors and senior management corresponding to the deferred parts of the Annual Variable Remuneration from previous years and their corresponding adjustments in cash, are detailed in Note 54.
Additionally, in line with specific regulation applicable in Portugal and Brazil, BBVA identifies those employees that, according to local regulators, should be subject to a specific settlement and payment scheme of the Annual Variable Remuneration.
According to this regulation, during 2017 a number of 49,798 shares corresponding to the initial payment of 2016 Annual Variable Remuneration were delivered to these beneficiaries.
Additionally, during 2017 the shares corresponding to the deferred parts of the Annual Variable Remuneration and their corresponding adjustments in cash, were delivered to these beneficiaries, giving rise in 2017, of a total of 10,485 shares corresponding to the first deferred third of the 2015 Annual Variable Remuneration, and €3,869 as adjustments for updates of the shares granted; a total of 7,201 shares corresponding to the second third of the 2014 Annual Variable Remuneration, and €5,322 as adjustments for updates of the shares granted; and a total of 5,757 shares corresponding to the final third of the 2013 Annual Variable Remuneration, and €6,603 as adjustments for updates of the shares granted.
Additionally, BBVA Compass' remuneration structure included a long-term incentive programme in shares for employees in certain key positions. This plan is applicable for a three-year term and consisted in the delivery of a number of shares to its beneficiaries, subject to their permanence in the company for a period of three years.
During 2017, a number of 331,111 shares corresponding to this programme were delivered.
Remuneration policy applicable from 2017 onwards
The Bank has modified its remuneration policy applicable to the Identified Staff and to BBVA Directors for the years 2017, 2018 and 2019, aimed at improving alignment with new regulatory requirements, best market practices and BBVA’s organization and internal strategy. This policy was approved, with respect to Identified Staff, by the Board of Directors held in 9 February 2017, and, with respect to BBVA directors, by the General Shareholders’ Meeting held on March 17, 2017.
The new remuneration policy includes a specific settlement and payment system of the Annual Variable Remuneration applicable to the Identified Staff, including directors and senior management, under the following rules, among others:
In this regard, the General Meeting held on March, 17 2017 resolved to increase the maximum level of variable remuneration to 200% of the fixed component for a number of the Identified Staff, in the terms indicated in the Report of Recommendations issued for this purpose by the Board of Directors dated 9 February 2017.
In accordance with the new remuneration policy applicable to the Identified Staff, malus and clawback arrangements will be applicable to the Annual Variable Remuneration awarded as of the year 2016, inclusive, for each member of the Identified Staff.
According to this new policy, the first disbursement in shares will be the upfront payment of the 2017 Annual Variable Remuneration, in equal parts in BBVA shares and in cash, which will take place in 2018.
44.2 Other administrative expenses
The breakdown of the balance under this heading in the accompanying consolidated income statements is as follows:
Other Administrative Expenses (Millions of euros)
| 2017 | 2016 | 2015 | |
|---|---|---|---|
| Technology and systems | 692 | 673 | 625 |
| Communications | 269 | 294 | 281 |
| Advertising | 352 | 398 | 387 |
| Property, fixtures and materials | 1,033 | 1,080 | 1,030 |
| Of which: Rent expenses (*) | 581 | 616 | 591 |
| Taxes other than income tax | 456 | 433 | 466 |
| Other expenses | 1,738 | 1,766 | 1,775 |
| Total | 4,541 | 4,644 | 4,563 |
45. Depreciation and Amortization
The breakdown of the balance under this heading in the accompanying consolidated income statements is as follows:
Depreciation and amortization (Millions of euros)
| Notes | 2017 | 2016 | 2015 | |
|---|---|---|---|---|
| Tangible assets | 17 | 694 | 690 | 641 |
| For own use | 680 | 667 | 615 | |
| Investment properties | 13 | 23 | 25 | |
| Assets leased out under operating lease | - | - | - | |
| Other Intangible assets | 694 | 735 | 631 | |
| Total | 1,387 | 1,426 | 1,272 |
46. Provisions or reversal of provisions
In the years ended December 31, 2017, 2016 and 2015 the net provisions registered in this income statement line item were as follows:
Provisions or reversal of provisions (Millions of euros)
| Notes | 2017 | 2016 | 2015 | |
|---|---|---|---|---|
| Pensions and other post employment defined benefit obligations | 25 | 343 | 332 | 592 |
| Other long term employee benefits | - | - | - | |
| Commitments and guarantees given | (313) | 56 | 10 | |
| Pending legal issues and tax litigation | 318 | 76 | (25) | |
| Other Provisions | 397 | 722 | 154 | |
| Total | 745 | 1,186 | 731 |
47. Impairment or reversal of impairment on financial assets not measured at fair value through profit or loss
The breakdown of Impairment or reversal of impairment on financial assets not measured at fair value through profit or loss by the nature of those assets in the accompanying consolidated income statements is as follows:
Impairment or reversal of impairment on financial assets not measured at fair value through profit or loss (Millons of euros)
| Notes | 2017 | 2016 | 2015 | |
|---|---|---|---|---|
| Financial assets measured at cost | - | - | - | |
| Available-for-sale financial assets | 12.4 | 1,127 | 202 | 24 |
| Debt securities | (4) | 157 | 1 | |
| Equity instruments | 1,131 | 46 | 23 | |
| Loans and receivables | 3,677 | 3,597 | 4,248 | |
| Of which: Recovery of written-off assets | 7.3.5 | (558) | (541) | (490) |
| Held to maturity investments | (1) | 1 | - | |
| Total | 4,803 | 3,801 | 4,272 |
48. Impairment or reversal of impairment on non-financial assets
The impairment losses on non-financial assets broken down by the nature of those assets in the accompanying consolidated income statements are as follows:
Impairment or reversal of impairment on non-financial assets (Millions of euros)
49. Gains (losses) on derecognition of non financial assets and subsidiaries, net
The breakdown of the balance under this heading in the accompanying consolidated income statements is as follows:
Gains or losses on derecognition of non financial assets and subsidiaries, net (Millions of euros)
| 2017 | 2016 | 2015 | |
|---|---|---|---|
| Gains | |||
| Disposal of investments in non-consolidated subsidiaries | 38 | 111 | 23 |
| Disposal of tangible assets and other | 69 | 64 | 71 |
| Losses: | |||
| Disposal of investments in non-consolidated subsidiaries | (27) | (58) | (2,222) |
| Disposal of tangible assets and other | (33) | (47) | (7) |
| Total | 47 | 70 | (2,135) |
During 2015, the heading “Losses – Disposal of investments in subsidiaries” included, mainly, the fair value measurement of its previously acquired stake in Garanti Group because of the change in the consolidation method (see Note 3).
50. Profit (loss) from non-current assets and disposal groups classified as held for sale not qualifying as discontinued operations
The main items included in the balance under this heading in the accompanying consolidated income statements are as follows:
Profit or loss from non-current assets and disposal groups classified as held for sale not qualifying as discontinued operations (Millions of euros)
| Notes | 2017 | 2016 | 2015 | |
|---|---|---|---|---|
| Gains on sale of real estate | 102 | 66 | 97 | |
| Impairment of non-current assets held for sale | 21 | (158) | (136) | (285) |
| Gains on sale of investments classified as non current assets held for sale | 82 | 39 | 45 | |
| Gains on sale of equity instruments classified as non current assets held for sale (*) | - | - | 877 | |
| Total | 26 | (31) | 734 |
51. Consolidated statements of cash flows
In the consolidated statements of cash flows, Balance of “Cash equivalent in central banks” includes short- term deposits at central banks under the heading "Loans and receivables" in the accompanying consolidated balance sheets and does not include demand deposits with credit institutions registered in the chapter "Cash, balances in cash at Central Bank and other demand deposits".
Cash flows from operating activities decreased in the year ended December 31, 2017 by €4,568 million (compared with a decrease of €16,478 million in December 31, 2016). The most significant reason for the change occurred under “Financial liabilities held for trading”.
The variances in cash flows from investing activities increased in the year ended December 31, 2017 by €3,462 million (compared with an increase of €3,851 million in December 31, 2016). The most significant reason for the change occurred under the heading “Held to maturity investments”.
The variances in cash flows from financing activities decreased in the year ended December 31, 2017 by €1,015 million (compared with a decrease of €1,240 million in December 31, 2016). The most significant reason for the change occurred under the heading “Subordinated liabilities”.
Liabilities from financing activities (Millions of Euros)
| December 31, 2016 | Cash flows | Non-cash changes | December 31, 2017 | |||
|---|---|---|---|---|---|---|
| Acquisition | Foreign exchange movement | Fair value changes | ||||
| Debt securities issued | 59,388 | (5,958) | - | (2,796) | - | 50,635 |
| Subordinated debt securities issued | 16,987 | 1,679 | - | (1,223) | - | 17,443 |
| Short-term debt | 11,556 | (1,319) | - | (224) | - | 10,013 |
| Other financial liabilities | 10,179 | (378) | - | (910) | - | 8,891 |
| Total | 98,111 | (5,976) | - | (5,153) | - | 86,982 |
52. Accountant fees and services
The details of the fees for the services contracted by entities of the BBVA Group for the year ended December 31, 2017 with their respective auditors and other audit entities are as follows:
Fees for Audits Conducted and Other Related Services (Millions of euros) (**)
| 2017 | |
|---|---|
| Audits of the companies audited by firms belonging to the KPMG worldwide organization and other reports related with the audit (*) | 27.2 |
| Other reports required pursuant to applicable legislation and tax regulations issued by the national supervisory bodies of the countries in which the Group operates, reviewed by firms belonging to the KPMG worldwide organization | 1.9 |
| Fees for audits conducted by other firms | 0.1 |
In the year ended December 31, 2017, other entities in the BBVA Group contracted other services (other than audits) as follows:
Other Services rendered (Millions of euros)
| 2017 | |
|---|---|
| Firms belonging to the KPMG worldwide organization | 0.5 |
This total of contracted services includes the detail of the services provided by KPMG Auditores, S.L. to BBVA, S.A. or its controlled companies at the date of preparation of these consolidated financial statements as follows:
Fees for Audits Conducted (*) (Millions of euros)
| 2017 | |
|---|---|
| Legal audit of BBVA,S.A. or its companies under control | 6.8 |
| Other audit services of BBVA, S.A or its companies under control | 5.0 |
| Limited Review of BBVA, S.A. or its companies under control | 0.9 |
| Reports related to issuances | 0.4 |
| Assurance jobs and other required by the regulator | 0.2 |
| Other | - |
The services provided by the auditors meet the independence requirements established under Audit of Accounts Law (Law 22/2015) and under the Sarbanes-Oxley Act of 2002 adopted by the Securities and Exchange Commission (SEC); accordingly they do not include the performance of any work that is incompatible with the auditing function.
53. Related-party transactions
As financial institutions, BBVA and other entities in the Group engage in transactions with related parties in the normal course of their business. All of these transactions are not material and are carried out under normal market conditions. As of December 31, 2017, 2016 and 2015, the following are the transactions with related parties:
53.1 Transactions with significant shareholders
As of December 31, 2017, 2016 and 2015, there were no shareholders considered significant (see Note 26).
53.2 Transactions with BBVA Group entities
The balances of the main aggregates in the accompanying consolidated balance sheets arising from the transactions carried out by the BBVA Group with associates and joint venture entities accounted for using the equity method are as follows:
Balances arising from transactions with Entities of the Group (Millions of euros)
| 2017 | 2016 | 2015 | |
|---|---|---|---|
| Assets: | |||
| Loans and advances to credit institutions | 91 | 69 | 109 |
| Loans and advances to customers | 510 | 442 | 710 |
| Liabilities: | |||
| Deposits from credit institutions | 5 | 1 | 2 |
| Customer deposits | 428 | 533 | 449 |
| Debt certificates | |||
| Memorandum accounts: | |||
| Financial guarantees given | 1,254 | 1,586 | 1,671 |
| Contingent commitments | 114 | 42 | 28 |
The balances of the main aggregates in the accompanying consolidated income statements resulting from transactions with associates and joint venture entities that are accounted for under the equity method are as follows:
Balances of Income Statement arising from transactions with Entities of the Group (Millions of euros)
| 2017 | 2016 | 2015 | |
|---|---|---|---|
| Income statement: | |||
| Financial incomes | 26 | 26 | 53 |
| Financial costs | 1 | 1 | 1 |
| Fee and Commission Income | 5 | 5 | 5 |
| Fee and Commission Expenses | 49 | 58 | 55 |
There were no other material effects in the consolidated financial statements arising from dealings with these entities, other than the effects from using the equity method (see Note 2.1) and from the insurance policies to cover pension or similar commitments, as described in Note 25; and the futures transactions arranged by BBVA Group with these entities, associates and joint ventures.
In addition, as part of its normal activity, the BBVA Group has entered into agreements and commitments of various types with shareholders of subsidiaries and associates, which have no material effects on the accompanying consolidated financial statements.
53.3 Transactions with members of the Board of Directors and Senior Management
The information on the remuneration of the members of the BBVA Board of Directors and Senior Management is included in Note 54.
As of December 31, 2017 and 2016, there were no loans granted by the Group’s entities to the members of the Board of Directors. As of December 31, 2015 the amount availed against the loans by the Group’s entities to the members of the Board of Directors was €200 thousand. The amount availed against the loans by the Group’s entities to the members of Senior Management on those same dates (excluding the executive directors) amounted to €4,049, €5,573 and €6,641 thousand, respectively.
As of December 31, 2017 and 2016, there were no loans granted to parties related to the members of the Board of Directors. As of December 31, 2015, the amount availed against the loans to parties related to the members of the Bank’s Board of Directors was €10,000 thousand. As of December 31, 2017, 2016 and 2015 the amount availed against the loans to parties related to members of the Senior Management amounted to €85, €98 and €113 thousand, respectively.
As of December 31, 2017, 2016 and 2015 no guarantees had been granted to any member of the Board of Directors.
As of December 31, 2017 and 2016, the amount availed against guarantees arranged with members of the Senior Management totaled €28 thousand. As of December 31, 2015 no guarantees had been granted to any member of the Senior Management.
As of December 31, 2017, 2016 and 2015 the amount against commercial loans and guarantees arranged with parties related to the members of the Bank’s Board of Directors and the Senior Management totaled €8, €8 and €1,679 thousand, respectively.
53.4 Transactions with other related parties
In the years ended December 31, 2017, 2016 and 2015, the Group did not conduct any transactions with other related parties that are not in the ordinary course of its business, which were not carried out at arm's- length market conditions and of marginal relevance; whose information is not necessary to give a true picture of the BBVA Group’s consolidated net equity, net earnings and financial situation.
54. Remuneration and other benefits received by the Board of Directors and members of the Bank’s Senior Management
Renumeration of non-executive directors received in 2017
The remuneration paid to the non-executive members of the Board of Directors during 2017 is indicated below. The figures are given individually for each non-executive director and itemized:
Remuneration for non-executive directors (Thousands of euros)
| Board of Directors | Executive Committee | Audit & Compliance Committee | Risks Committee | Remunerations Committee | Appointments Committee | Technology and Cybersecurity Committee | Total | |
|---|---|---|---|---|---|---|---|---|
| Tomás Alfaro Drake | 129 | - | 71 | - | 25 | 102 | 43 | 370 |
| José Miguel Andrés Torrecillas | 129 | - | 179 | 107 | - | 41 | - | 455 |
| José Antonio Fernández Rivero | 129 | 167 | - | - | 43 | - | 25 | 363 |
| Belén Garijo López | 129 | - | 71 | - | 80 | - | - | 280 |
| Sunir Kumar Kapoor | 129 | - | - | - | - | - | 43 | 172 |
| Carlos Loring Martínez de Irujo | 129 | 167 | - | 107 | 25 | - | - | 427 |
| Lourdes Máiz Carro | 129 | - | 71 | - | 25 | 41 | - | 266 |
| José Maldonado Ramos | 129 | 167 | - | 62 | - | 41 | - | 399 |
| Juan Pi Llorens | 129 | - | 71 | 125 | 45 | - | 43 | 412 |
| Susana Rodríguez Vidarte | 129 | 167 | - | 107 | - | 41 | - | 443 |
| Total (1) | 1,287 | 667 | 464 | 508 | 243 | 265 | 154 | 3,587 |
Moreover, during 2017, €126 thousand has been paid in healthcare and casualty insurance premiums for the non-executive members of the Board of Directors.
Remuneration of executive directors received in the year 2017
During the year 2017, the executive directors have received the amount of the fixed remuneration corresponding to that year, established in the Remuneration Policy for BBVA Directors applicable during financial years 2017, 2018 and 2019. The Policy was approved by the General Meeting held on March 17, 2017 by a majority of 96.54%.
Likewise, the executive directors have received the annual variable remuneration corresponding to the year 2016 which payment vested during the first quarter of 2017, in accordance with the settlement and payment system established under the former remuneration policy for directors, approved by the General Meeting held on March 13, 2015.
In accordance with that settlement and payment system:
Furthermore, following approval of the new Remuneration Policy for BBVA Directors by the 2017 General Meeting, the annual variable remuneration awarded as of the year 2016, inclusive, is subject to arrangements for the reduction (“malus”) and recoupment ("clawback") of variable remuneration during the entire deferral and retention period, in the terms mentioned in said Policy.
Likewise, in accordance with the settlement and payment system applicable to the annual variable remuneration of the years 2014 and 2013, pursuant to the applicable policy for said years, the executive directors have received the deferred parts of the annual variable remuneration of those years, delivery of which was due in the first quarter of year 2017.
Pursuant to the above, the remuneration paid to the executive directors during 2017 is shown below. The figures are given individually for each executive director and itemized:
Remuneration of executive directors (Thounsands of Euros)
| Fixed remuneration | 2016 annual variable remuneration in cash (1) | Deferred variable remuneration in cash from previous years (2) | Total cash 2017 | 2016 annual variable remuneration in BBVA shares (1) | Deferred variable remuneration in BBVA shares from previous years (2) | Total shares 2017 | |
|---|---|---|---|---|---|---|---|
| Group Executive Chairman | 2,475 | 734 | 622 | 3,831 | 114,204 | 66,947 | 181,151 |
| Chief Executive Officer | 1,965 | 591 | 182 | 2,738 | 91,915 | 19,703 | 111,618 |
| Head of Global Economics, Regulation & Public Affairs (“Head of GERPA”) | 834 | 89 | 50 | 972 | 13,768 | 5,449 | 19,217 |
| Total | 5,274 | 1,414 | 853 | 7,541 | 219,887 | 92,099 | 311,986 |
As at year-end 2017, the last third corresponding to the deferred variable remuneration of the year 2014 is pending payment, delivery of which will correspond in the first quarter of the year 2018, in accordance with the settlement and payment system established for that year.
In accordance with the conditions established in the settlement and payment system previously mentioned, 50% of executive directors’ annual variable remuneration corresponding to the years 2015 and 2016 remains deferred, to be paid in future years, where applicable, according to the aforementioned system.
Likewise, executive directors have received, during 2017, remuneration in kind, which includes insurance premiums and others, for a total overall amount of €217 thousand, of which €16 thousand correspond to the Group Executive Chairman; €121 thousand to the Chief Executive Officer; and €79 thousand to the executive director Head of GERPA.
Annual variable remuneration of executive directors for the year
Following year-end 2017, the variable remuneration for executive directors corresponding to that year has been determined, applying the conditions established at the beginning of 2017, as set forth in the Remuneration Policy for BBVA Directors, approved by the General Meeting held on 17 March 2017, in the following terms:
Moreover, in accordance with the settlement and payment system established in the Remuneration Policy for BBVA Directors:
The amounts corresponding to the deferred shares are recorded under the item “own share based compensation schemes - equity” and the amounts corresponding to cash are recorded under the item “Other Liabilities – Accrued interest” of the consolidated balance sheet at 31 December 2017.
Remuneration of the members of the Senior Management received in 2017
During 2017, members of Senior Management have received the amount of the fixed remuneration corresponding to that year and the annual variable remuneration corresponding to the year 2016, which payment vested during the first quarter of the year 2017, according to the settlement and payment system set forth in the remuneration policy applicable to the Senior Management in that year.
In accordance with this settlement and payment system:
Furthermore, the annual variable remuneration awarded as of the year 2016, inclusive, is subject to arrangements for the reduction (“malus”) and recoupment ("clawback") of variable remuneration during the entire deferral and retention period.
Pursuant to the above, the remuneration paid during the year 2017 to members of the Senior Management as a whole, excluding executive directors, is shown below (itemized):
Remuneration of members of the Senior Management (Thousands of Euros)
| Fixed remuneration | 2016 annual variable remuneration in cash (1) | Deferred variable remuneration in cash from previous years (2) | Total cash 2017 | 2016 annual variable remuneration in BBVA shares (1) | Deferred variable remuneration in BBVA shares from previous years (2) | Total shares 2017 | |
|---|---|---|---|---|---|---|---|
| Total members of the Senior Management (*) | 15,673 | 2,869 | 1,016 | 19,558 | 441,596 | 110,105 | 551,701 |
As at year-end 2017, the last third corresponding to the deferred variable remuneration of the year 2014 is pending payment, delivery of which will correspond in the first quarter of the year 2018, in accordance with the settlement and payment system established for that year.
Likewise, 50% of members of the Senior Management’s annual variable remuneration corresponding to the years 2015 and 2016 remains deferred, to be paid in future years, where applicable, according to the settlement and payment system established for said years.
Additionally, members of the Senior Management as a whole, excluding executive directors, have received remuneration in kind during the year 2017, which includes insurance premiums and others, for a total overall amount of €684 thousand.
Remuneration system in shares with deferred delivery for non-executive directors
BBVA has a remuneration system in shares with deferred delivery for its non-executive directors, which was approved by the General Meeting held on March 18, 2006 and extended by resolutions of the General Meeting held on March 11, 2011 and on March 11, 2016, for a further five-year period in each case.
This system is based on the annual allocation to non-executive directors of a number of "theoretical shares", equivalent to 20% of the total remuneration in cash received by each director in the previous year, calculated according to the average closing prices of the BBVA share during the sixty trading sessions prior to the Annual General Meetings approving the corresponding financial statements for each year.
These shares will be delivered to each beneficiary, where applicable, on the date they leave directorship for any reason other than serious breach of their duties.
The number of “theoretical shares” allocated in the first semester of 2017 to each non-executive director beneficiary of the remuneration system in shares with deferred delivery, corresponding to 20% of the total remuneration received in cash by said directors in 2016, is as follows:
| Theoretical shares allocated in 2017 | Theoretical shares accumulated at December 31, 2017 | |
|---|---|---|
| Tomás Alfaro Drake | 10,630 | 73,082 |
| José Miguel Andrés Torrecillas | 14,002 | 23,810 |
| José Antonio Fernández Rivero | 11,007 | 102,053 |
| Belén Garijo López | 7,313 | 26,776 |
| Sunir Kumar Kapoor | 4,165 | 4,165 |
| Carlos Loring Martínez de Irujo | 11,921 | 86,891 |
| Lourdes Máiz Carro | 7,263 | 15,706 |
| José Maldonado Ramos | 10,586 | 67,819 |
| Juan Pi Llorens | 10,235 | 42,609 |
| Susana Rodríguez Vidarte | 13,952 | 92,558 |
| Total (1) | 101,074 | 535,469 |
Pension commitments
The Bank has undertaken pension commitments in favor of the Chief Executive Officer and the executive director Head of GERPA, in accordance with the Bylaws, the Remuneration Policy for BBVA Directors and their respective contracts entered into with the Bank, to cover retirement, disability and death.
As regards the Chief Executive Officer, the Remuneration Policy for BBVA Directors provides for a new benefits framework whereby his previous defined-benefits system has been transformed into a defined- contribution system, according to which he is entitled, provided he does not leave his position as Chief Executive Officer due to serious breach of his duties, to a retirement benefit when he reaches the legal retirement age, in the form of capital or as income, which amount shall result from the funds accumulated by the Bank until December 2016 to cover the commitments under his previous benefits scheme and the sum of the annual contributions made by the Bank as of January 1, 2017, to cover said benefit under the new pension scheme, along with the corresponding accumulated yields.
Should the contractual relationship be terminated before he reaches the retirement age, for reason other than serious breach of his duties, the retirement benefit to which the Chief Executive Officer is entitled, when he reaches the age legally established, shall be calculated on the basis of the contributions made by the Bank up to that date, along with the corresponding accumulated yields, with no additional contributions to be made by the Bank upon leave of directorship.
The amount established in the Remuneration Policy for BBVA Directors for the Chief Executive Officer, as annual contribution to cover the retirement benefit under the new defined-contribution scheme, amounts to €1,642 thousand, amount which shall be updated in the same proportion as the annual fixed remuneration for the Chief Executive Officer, in the terms established in said Policy.
Likewise, pursuant to the Policy, 15% of the agreed annual contribution, mentioned above, shall be based on variable components and be considered "discretionary pension benefits", thus subject to the conditions of delivery in shares, retention and clawback established in applicable regulations, as well as to those other conditions of variable remuneration applicable to them pursuant to the aforementioned Policy.
On the other hand, the Bank will assume payment of the annual insurance premiums in order to top up the coverage of death and disability of the Chief Executive Officer’s benefits scheme, in the terms established in the Remuneration Policy for BBVA Directors.
Pursuant to the foregoing, in the year 2017 an amount of €1,853 thousand has been recorded to attend the benefits commitments undertaken with the Chief Executive Officer, amount which includes the contribution to retirement coverage (€1,642 thousand), as well as to death and disability (€211 thousand), with the total accumulated fund to cover retirement commitments amounting €17,503 thousand, as at December 31, 2017.
15% of the agreed annual contribution to retirement (€246 thousand) has been registered in the year 2017 as “discretionary pension benefits” and, following year-end 2017, said amount has been adjusted according to the criteria established for the determination of the Chief Executive Officer’s annual variable remuneration for 2017. Accordingly, the “discretionary pension benefits” for the year 2017 have been determined in an amount of €288 thousand, amount which will be included in the accumulated fund in the year 2018, subject to the same conditions as the Deferred Component of annual variable remuneration for the year 2017, as well as the remaining conditions established for these benefits in the Remuneration Policy for BBVA Directors.
As regards the executive director Head of GERPA, the pension scheme established in the Remuneration Policy for BBVA Directors establishes an annual contribution of 30% of his fixed remuneration as of January 1, 2017, to cover retirement benefit, as well as payment of the corresponding annual insurance premiums in order to top up the coverage of death and disability.
As in the case of the Chief Executive Officer, 15% of the agreed annual contribution, mentioned above, shall be based on variable components and be considered "discretionary pension benefits", thus subject to the conditions of delivery in shares, retention and clawback established in applicable regulations, as well as to those other conditions of variable remuneration applicable to them pursuant to the aforementioned Policy.
The executive director Head of GERPA shall be entitled, when he reaches the retirement age, to the benefits arising from the contributions made by the Bank to cover pension commitments, plus the corresponding accumulated yields up to that date, provided he does not leave his position due to serious breach of his duties. In the event of voluntary termination of contractual relationship by the director before retirement, benefits shall be limited to 50% of the contributions made by the Bank to that date, along with the corresponding accumulated yields, with the Bank's contributions ceasing upon leave of directorship.
Pursuant to the foregoing, in the year 2017 an amount of €393 thousand has been recorded to attend the benefits commitments undertaken with the executive director Head of GERPA, amount which includes the contribution to retirement coverage (€250 thousand), as well as to death and disability (€143 thousand), with the total accumulated fund to cover retirement commitments amounting €842 thousand, as at December 31, 2017.
15% of the agreed annual contribution to retirement (€38 thousand) has been registered in the year 2017 as “discretionary pension benefits” and, following year-end 2017, said amount has been adjusted according to the criteria established for the determination of the executive director Head of GERPA’s annual variable remuneration for 2017. Accordingly, the “discretionary pension benefits” for the year 2017 have been determined in an amount of €46 thousand, amount which will be included in the accumulated fund in the year 2018, subject to the same conditions as the Deferred Component of annual variable remuneration for the year 2017, as well as the remaining conditions established for these benefits in the Remuneration Policy for BBVA Directors.
There are no other pension obligations undertaken in favor of other executive directors.
Likewise, an amount of €5,630 thousand has been recorded to attend the benefits commitments undertaken with members of the Senior Management, excluding executive directors, amount which includes the contribution to retirement coverage (€4,910 thousand), as well as to death and disability (€720 thousand), with the total accumulated fund to cover retirement commitments with the Senior Management amounting €55,689 thousand, as at December 31, 2017.
As in the case of executive directors, 15% of the annual contributions agreed for members of the Senior Management shall be based on variable components and be considered "discretionary pension benefits", thus subject to the conditions of delivery in shares, retention and clawback established in applicable regulations, as well as to those other conditions of variable remuneration applicable to them pursuant to the remuneration policy applicable to Senior Management.
Pursuant to the foregoing, from the annual contribution to cover retirement recorded in 2017, an amount of €585 thousand has been recorded in the year 2017 as “discretionary pension benefits” and, following year- end 2017, said amount has been adjusted according to the criteria established for the determination of the Senior Management’s annual variable remuneration for 2017. Accordingly, the “discretionary pension benefits” for the year 2017 have been determined in an amount of €589 thousand, amount which will be included in the accumulated fund in the year 2018, subject to the same conditions as the Deferred Component of annual variable remuneration for the year 2017, as well as the remaining conditions established for these benefits in the remuneration policy applicable to members of the Senior Management.
Extinction of contractual relationship
In accordance with the Remuneration Policy for BBVA Directors, approved by the 2017 General Meeting, the Bank has no commitments to pay severance indemnity to executive directors.
The new contractual framework defined in the aforementioned Policy for the Chief Executive Officer and the executive director Head of GERPA includes a post-contractual non-compete agreement for a period of two years, after they cease as BBVA executive directors, in accordance to which they shall receive remuneration in an amount equivalent to one annual fixed remuneration for every year of duration of the non-compete arrangement, which shall be paid periodically over the course of the two years, provided that leave of directorship is not due to retirement, disability or serious breach of duties.
55. Other information
55.1 Environmental impact
Given the activities BBVA Group entities engage in, the Group has no environmental liabilities, expenses, assets, provisions or contingencies that could have a significant effect on its consolidated equity, financial situation and profits. Consequently, as of December 31, 2017, there is no item in the Group’s accompanying consolidated financial statements that requires disclosure in an environmental information report pursuant to Ministry of Justice Order JUS/471/2017, of May 19, and consequently no specific disclosure of information on environmental matters is included in these financial statements.
55.2 Reporting requirements of the Spanish National Securities Market Commission (CNMV)
Dividends paid in the year
The table below presents the dividends per share paid in cash during 2015, 2016 and 2017 (cash basis dividend, regardless of the year in which they were accrued, but without including other shareholder remuneration, such as the “Dividend Option”). See Notes 4 and 22.4 for a complete analysis of all remuneration awarded to shareholders.
Dividends Paid ("Dividend Option" not included)
| 2017 | 2016 | 2015 | |||||||
|---|---|---|---|---|---|---|---|---|---|
| % Over Nominal | Euros per Share | Amount (Millions of Euros) | % Over Nominal | Euros per Share | Amount (Millions of Euros) | % Over Nominal | Euros per Share | Amount (Millions of Euros) | |
| Ordinary shares | 34.69% | 0.17 | 1,135 | 32.65% | 0.16 | 1,028 | 16.33% | 0.08 | 504 |
| Rest of shares | - | - | - | - | - | - | - | - | - |
| Total dividends paid in cash | 34.69% | 0.17 | 1,135 | 32.65% | 0.16 | 1,028 | 16.33% | 0.08 | 504 |
| Dividends with charge to income | 34.69% | 0.17 | 1,135 | 32.65% | 0.16 | 1,028 | 16.33% | 0.08 | 504 |
| Dividends with charge to reserve or share premium | - | - | - | - | - | - | - | - | - |
| Dividends in kind | - | - | - | - | - | - | - | - | - |
Earnings and ordinary income by operating segment
The detail of the consolidated profit for each operating segment is as follows:
Profit Attributable by Operating Segments
| Profit Attributable by Operating Segments | Notes | 2017 | 2016 | 2015 |
|---|---|---|---|---|
| Banking Activity in Spain | 1,381 | 912 | 1,085 | |
| Non Core Real Estate | (501) | (595) | (496) | |
| United States | 511 | 459 | 517 | |
| Mexico | 2,162 | 1,980 | 2,094 | |
| Turkey | 826 | 599 | 371 | |
| South America | 861 | 771 | 905 | |
| Rest of Eurasia | 125 | 151 | 75 | |
| Subtotal operating segments | 5,363 | 4,276 | 4,551 | |
| Corporate Center | (1,844) | (801) | (1,910) | |
| Profit attributable to parent company | 16 | 3,519 | 3,475 | 2,641 |
| Non-assigned income | - | - | - | |
| Elimination of interim income (between segments) | - | - | - | |
| Other gains (losses) (*) | 1,243 | 1,218 | 686 | |
| Income tax and/or profit from discontinued operations | 2,169 | 1,699 | 1,274 | |
| Operating profit before tax | 16 | 6,931 | 6,392 | 4,603 |
Interest income by geographical area
The breakdown of the balance of “Interest Income” in the accompanying consolidated income statements by geographical area is as follows:
Interest income. Breakdown by Geographical Area (Millions of euros)
| Notes | 2017 | 2016 | 2015 | |
|---|---|---|---|---|
| Domestic | 5,093 | 5,962 | 6,275 | |
| Foreign | 24,203 | 21,745 | 18,507 | |
| European Union | 422 | 291 | 387 | |
| Other OECD countries | 19,386 | 17,026 | 13,666 | |
| Other countries | 4,395 | 4,429 | 4,454 | |
| TOTAL | 37.1 | 29,296 | 27,708 | 24,783 |
55.3 Mortgage market policies and procedures
The information on “Mortgage market policies and procedures” (for the granting of mortgage loans and for debt issues secured by such mortgage loans) required by Bank of Spain Circular 5/2011, applying Royal Decree 716/2009, dated April 24 (which developed certain aspects of Act 2/1981, dated March 25, on the regulation of the mortgage market and other mortgage and financial market regulations), can be found in Appendix X.
56. Subsequent events
From January 1, 2018 to the date of preparation of these Consolidated Financial Statements, no other subsequent events not mentioned above in these financial statements have taken place that could significantly affect the Group’s earnings or its equity position.
Transition to IFRS 9
Under Commission Regulation (EU) No. 2016/2067 of 22 November 2016, all companies governed by the law of a Member State of the European Union, and whose securities are traded on a regulated market in one of the States of the Union, must apply IFRS 9 as from the commencement date of their first financial year starting on or after January 1, 2018 (see Note 2.3); and it is the Group's intention to use the option allowed by the standard itself of not reformulating the comparative financial statements for 2017 that will be presented in the Consolidated Financial Statements for 2018.
57. Explanation added for translation into English
These accompanying consolidated financial statements are presented on the basis of IFRS, as adopted by the European Union. Certain accounting practices applied by the Group that conform to EU-IFRS may not conform to other generally accepted accounting principles.