
Business areas
This section presents and analyzes the most relevant aspects of the Group's different business areas. Specifically, for each one of them, it shows a summary of the income statement and balance sheet, the business activity figures and the most significant ratios.
At the end of 2020, BBVA Group’s business areas reporting structure continued to be the same as the one presented at the end of 2019, although BBVA has reached agreements that, in some cases, could affect that structure. BBVA Group's business areas and the agreements reached in relation to some of them are summarized below:
- Spain mainly includes the banking and insurance businesses that the Group carries out in this country. In relation to the agreement reached in April 2020 with Allianz to create a bancassurance alliance, by setting up a newly created insurance company, once the authorizations from the competent regulators had been received, on December 14, 2020. BBVA Seguros transferred half plus one share from the aforementioned company to Allianz. The results from this new company are included in this business area.
- The United States incorporates the businesses of BBVA USA, including the Group´s wholesale business through the New York branch office, the stake in Propel Venture Partners and the broker dealer BBVA Securities Inc business, all of which are excluded from the sale agreement reached with PNC. In relation to said agreement (for more information, see the chapter “Highlights” of this report), it includes BBVA USA and other companies in the United States with activities related to this banking business. Likewise, in accordance with IFRS 8 “Operating Segments”, the information for this business area is provided for the financial years 2020 and 2019, including the companies subject to the sale agreement, whose closing is subject to obtaining regulatory authorizations from the competent authorities.
- Mexico includes banking and insurance businesses in this country, as well as the activity that BBVA Mexico carries out through its branch in Houston.
- Turkey reports the activity of the group Garanti BBVA that is mainly carried out in this country and, to a lesser extent, in Romania and the Netherlands.
- South America mainly includes banking and insurance activity carried out in the region. With respect to the agreement reached with Banco GNB Paraguay, S.A., for the sale of BBVA Paraguay, the closing of the transaction materialized on January 22, 2021, once the approval of the competent regulatory authorities was received. The information in this business area includes BBVA Paraguay at the end of December 2020 and 2019.
- Rest of Eurasia includes the banking business activity carried out in Asia and in Europe, excluding Spain.
The Corporate Center contains the centralized functions of the Group, including: the costs of the head offices with a corporate function; management of structural exchange rate positions; some equity instrument issuances to ensure an adequate management of the Group's global solvency. It also includes portfolios whose management is not linked to customer relationships, such as industrial holdings; certain tax assets and liabilities; funds due to commitments to employees; goodwill and other intangible assets.
The information by business area is based on units at the lowest level and/or companies that comprise the Group, which are assigned to the different areas according to the main region or company group in which they carry out their activity.
As usual, in the case of the different business areas in Americas and Turkey, the results applying constant exchange rates are given as well as the year-on-year variations at current exchange rates.
MAIN INCOME STATEMENT LINE ITEMS BY BUSINESS AREA (MILLIONS OF EUROS)
| Business areas | |||||||||
|---|---|---|---|---|---|---|---|---|---|
| BBVA Group | Spain | The United States | Mexico | Turkey | South America | Rest of Eurasia | ∑ Business areas | Corporate Center | |
| 31-12-20 | |||||||||
| Net interest income | 16,801 | 3,553 | 2,284 | 5,415 | 2,783 | 2,701 | 214 | 16,950 | (149) |
| Gross income | 22,974 | 5,554 | 3,152 | 7,017 | 3,573 | 3,225 | 510 | 23,031 | (57) |
| Operating income | 12,219 | 2,515 | 1,281 | 4,677 | 2,544 | 1,853 | 225 | 13,094 | (876) |
| Profit/(loss) before tax | 5,225 | 809 | 502 | 2,472 | 1,522 | 896 | 184 | 6,386 | (1,160) |
| Net attributable profit/(loss) | 1,305 | 606 | 429 | 1,759 | 563 | 446 | 137 | 3,940 | (2,635) |
| 31-12-19 | |||||||||
| Net interest income | 18,124 | 3,567 | 2,395 | 6,209 | 2,814 | 3,196 | 175 | 18,357 | (233) |
| Gross income | 24,463 | 5,656 | 3,223 | 8,029 | 3,590 | 3,850 | 454 | 24,802 | (339) |
| Operating income | 12,561 | 2,402 | 1,257 | 5,384 | 2,375 | 2,276 | 161 | 13,855 | (1,294) |
| Profit/(loss) before tax | 7,716 | 1,878 | 705 | 3,691 | 1,341 | 1,396 | 163 | 9,173 | (1,457) |
| Net attributable profit/(loss) | 3,512 | 1,386 | 590 | 2,699 | 506 | 721 | 127 | 6,029 | (2,517) |
- General note: as a result of the interpretation issued by the International Financial Reporting Standards Interpretations Committee (IFRIC) regarding the collecting of interests of written-off financial assets for the purpose of IFRS 9, those collections are presented as reduction of the credit allowances and not as a higher interest income, recognition method applied until December 2019. Therefore, and in order to make the information comparable, the information of the 2019 income statements has been restated.
GROSS INCOME (1), OPERATING INCOME (1) AND NET ATTRIBUTABLE PROFIT(1) BREAKDOWN (PERCENTAGE, 2020)
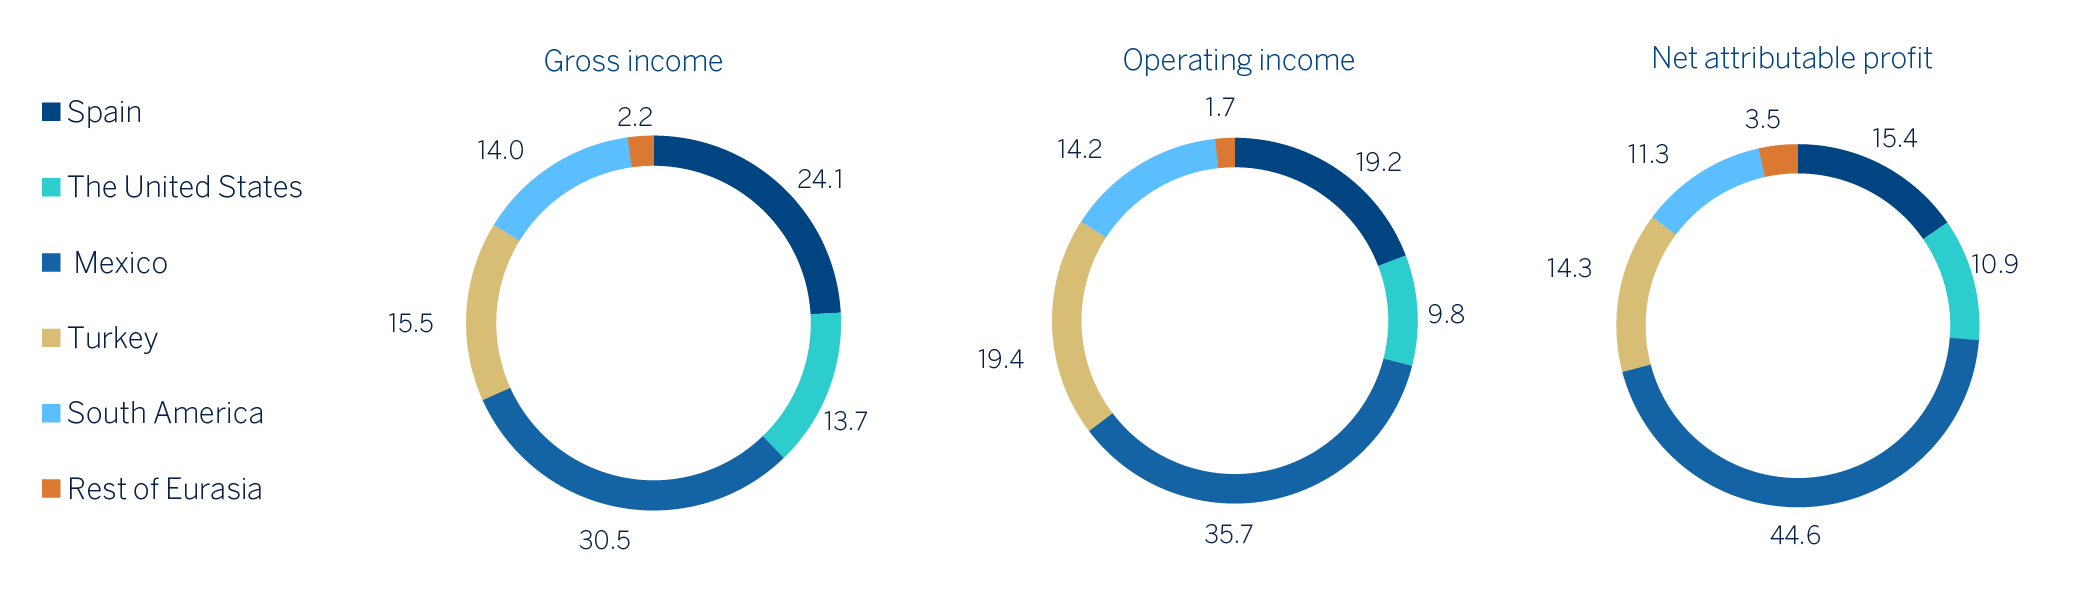
(1) Excludes the Corporate Center.
MAIN BALANCE-SHEET ITEMS AND RISK-WEIGHTED ASSETS BY BUSINESS AREA (MILLIONS OF EUROS)
| Business areas | ||||||||||
|---|---|---|---|---|---|---|---|---|---|---|
| BBVA Group | Spain | The United States | Mexico | Turkey | South America | Rest of Eurasia | ∑ Business areas | Corporate Center | Deletions | |
| 31-12-20 | ||||||||||
| Loans and advances to customers | 365,006 | 167,998 | 57,983 | 50,002 | 37,295 | 33,615 | 18,908 | 365,801 | 503 | (1,299) |
| Deposits from customers | 409,122 | 206,428 | 69,923 | 54,052 | 39,353 | 36,874 | 4,578 | 411,208 | 363 | (2,449) |
| Off-balance sheet funds | 102,947 | 62,707 | - | 22,524 | 3,425 | 13,722 | 569 | 102,947 | - | - |
| Total assets/liabilities and equity | 736,176 | 405,878 | 93,953 | 110,224 | 59,585 | 55,435 | 22,881 | 747,957 | 41,674 | (53,455) |
| RWAs | 353,272 | 104,388 | 60,365 | 60,797 | 53,021 | 39,804 | 18,249 | 336,624 | 16,648 | - |
| 31-12-19 | ||||||||||
| Loans and advances to customers | 383,565 | 167,332 | 63,162 | 58,081 | 40,500 | 35,701 | 19,669 | 384,445 | 813 | (1,692) |
| Deposits from customers | 385,686 | 182,370 | 67,525 | 55,934 | 41,335 | 36,104 | 4,708 | 387,976 | 308 | (2,598) |
| Off-balance sheet funds | 107,803 | 66,068 | - | 24,464 | 3,906 | 12,864 | 500 | 107,803 | - | - |
| Total assets/liabilities and equity | 697,737 | 364,427 | 88,529 | 109,079 | 64,416 | 54,996 | 23,257 | 704,703 | 49,886 | (56,852) |
| RWAs | 364,448 | 104,911 | 65,170 | 59,299 | 56,642 | 45,413 | 17,989 | 349,422 | 15,026 | - |
- General note: figures without considering the classification of BBVA Paraguay as Non-current Assets and Liabilities Held for Sale as of 31-12-2020 and 31-12-2019 and BBVA USA and the rest of Group's companies in the United States included in the sale agreement signed with PNC as Non-current Assets and Liabilities Held For Sale as of 31-12-2020.
The balance sheet includes a column, which represents the deletions and balance sheet adjustments between the different business areas, especially in terms of the relationship between the areas in which the parent company operates, i.e. Spain, Rest of Eurasia and the United States, and the Corporate Center.
NUMBER OF EMPLOYEES
(1) December 2020 data for the United States includes Houston branch employees.
NUMBER OF BRANCHES
NUMBER OF ATMS
Spain
Highlights
- Activity growth driven by corporate and investment banking operations and government support programs.
- Improved efficiency ratio, driven by controlled operating expenses.
- Risk indicators contained.
- Net attributable profit affected by the level of impairment on financial assets.
BUSINESS ACTIVITY (1) (YEAR-ON-YEAR CHANGE. DATA AS OF 31-12-20)
(1) Excluding repos.
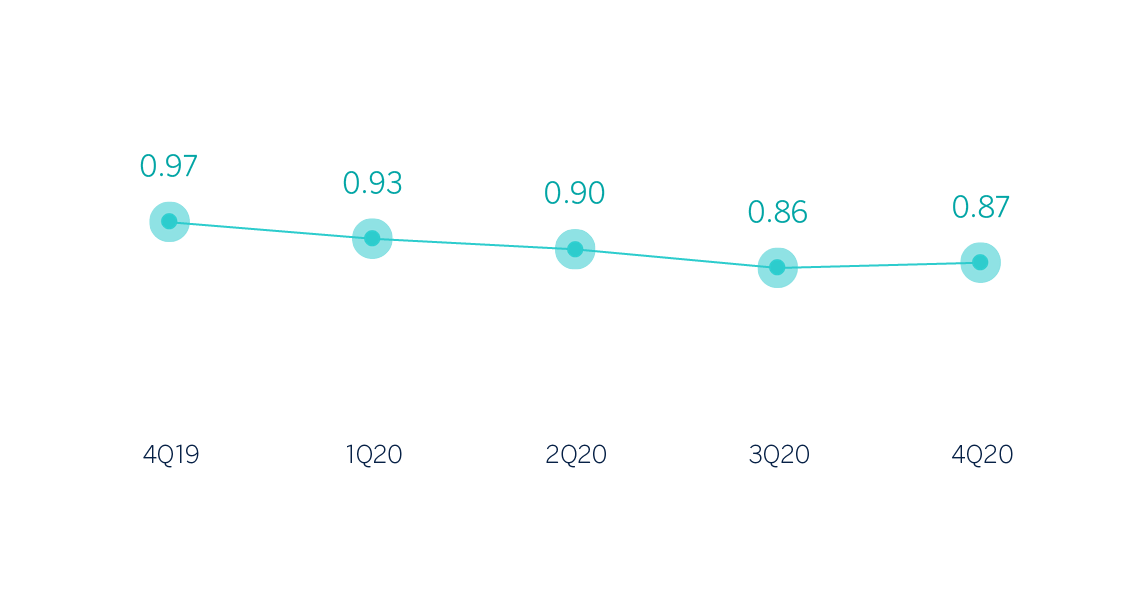
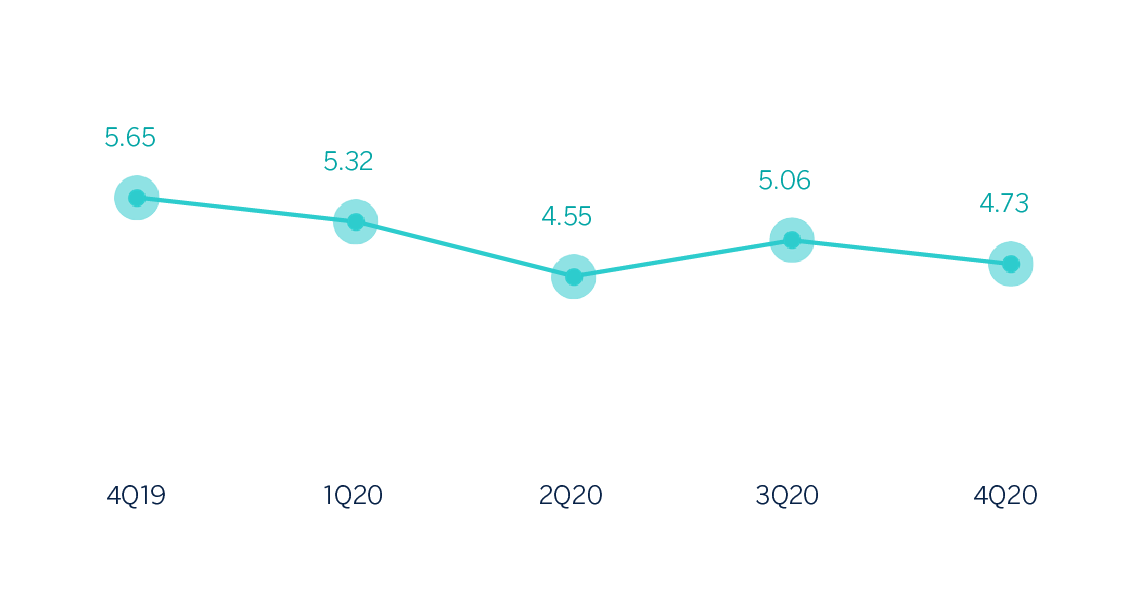
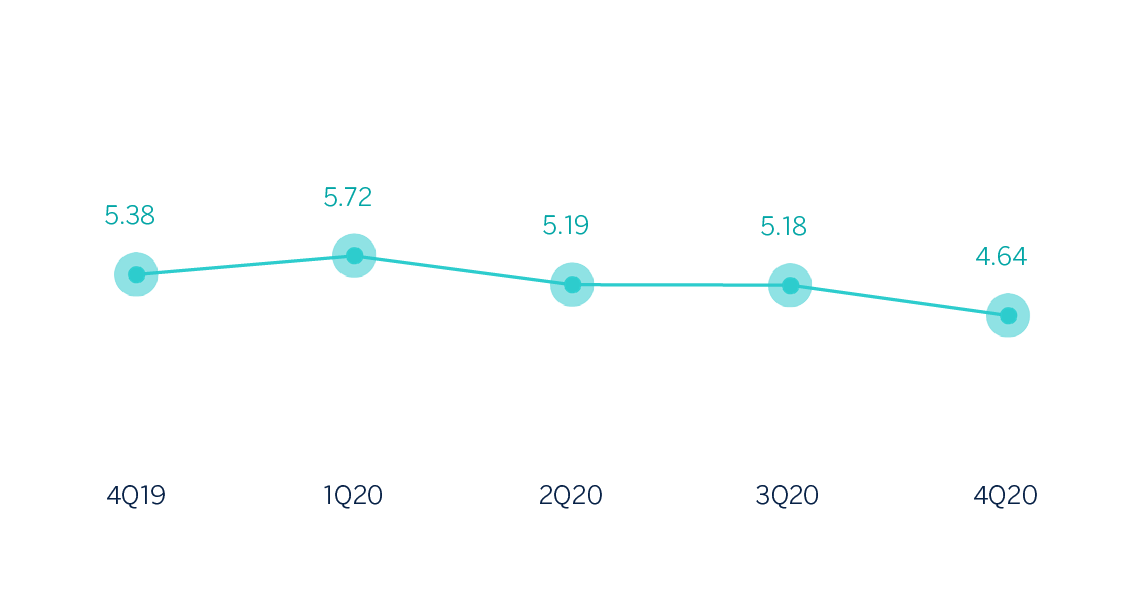
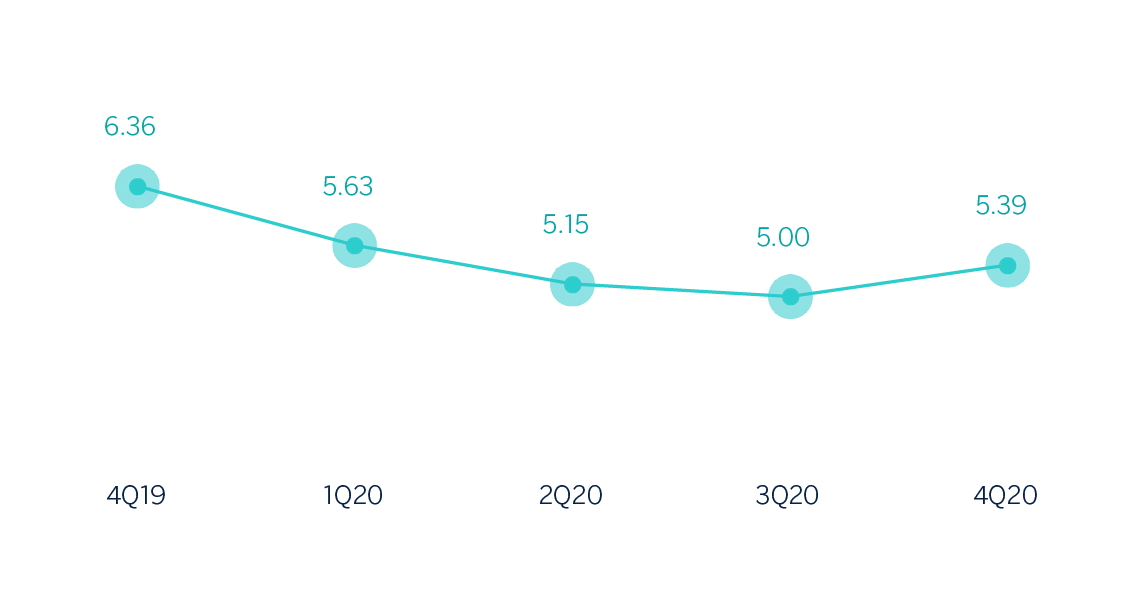
NET INTEREST INCOME/ATAS (PERCENTAGE)
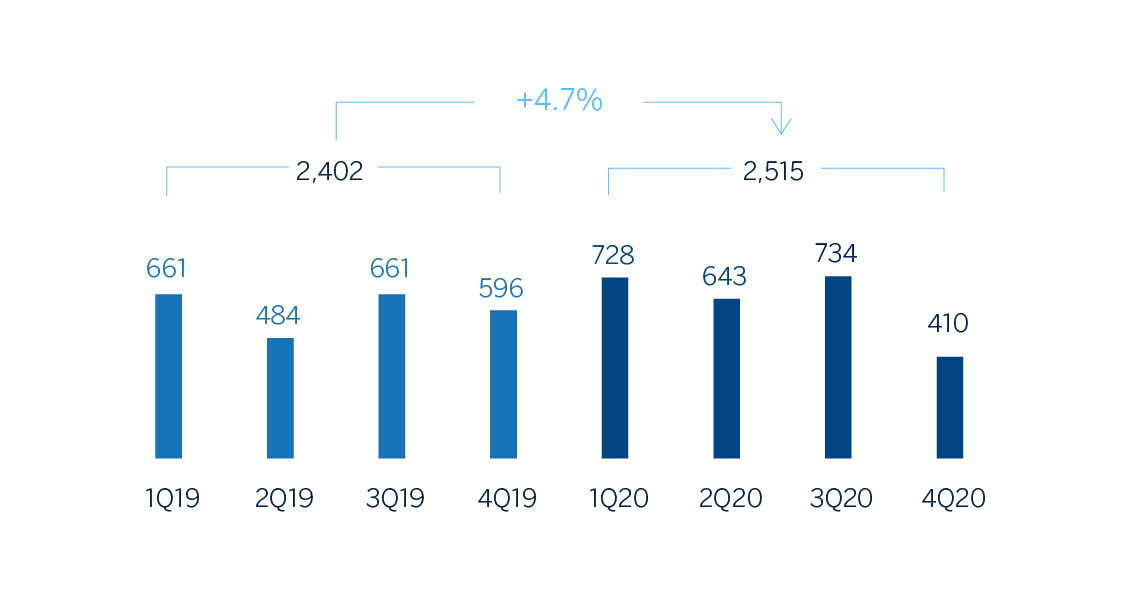
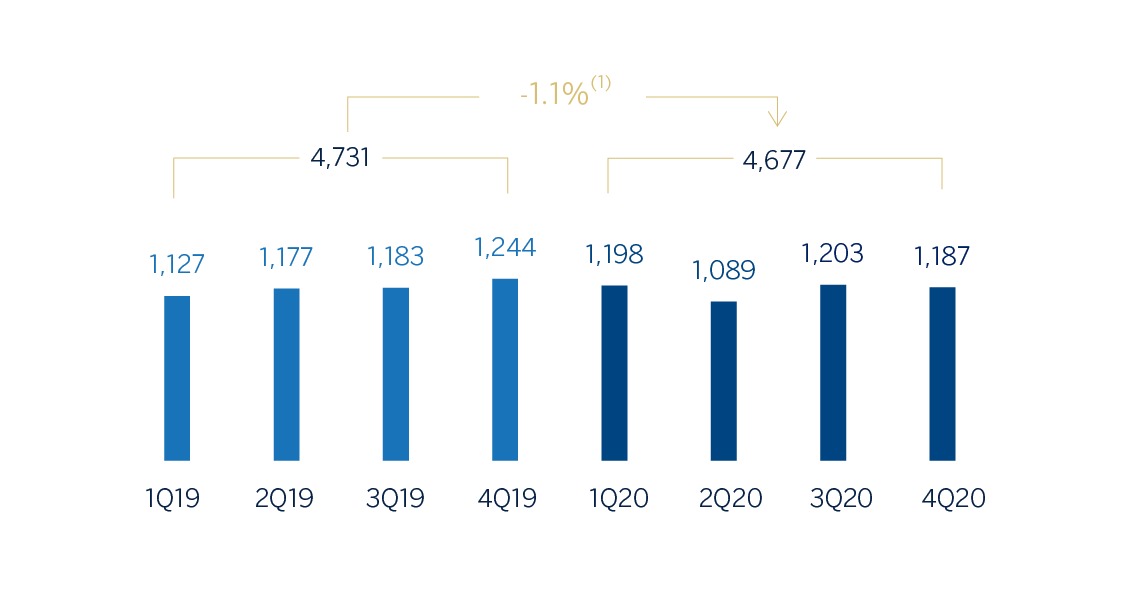
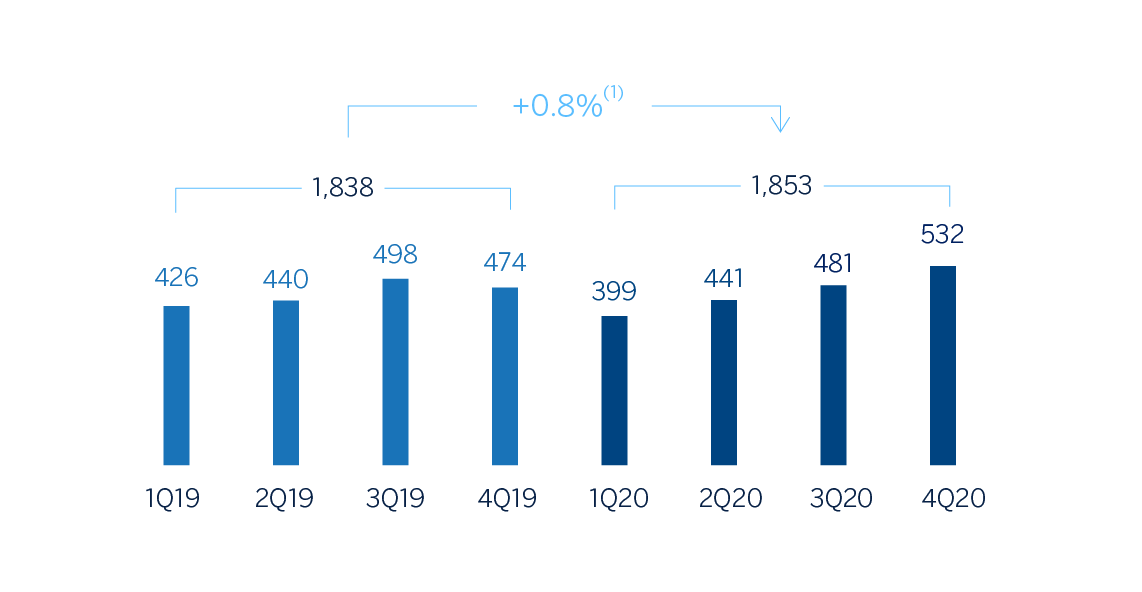
OPERATING INCOME (MILLIONS OF EUROS)
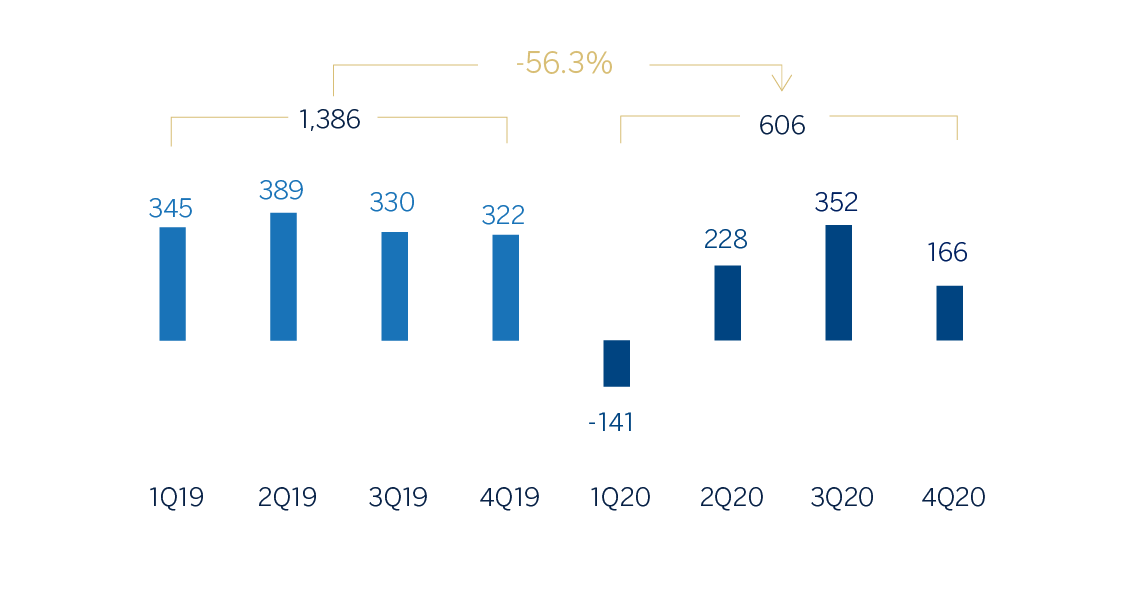
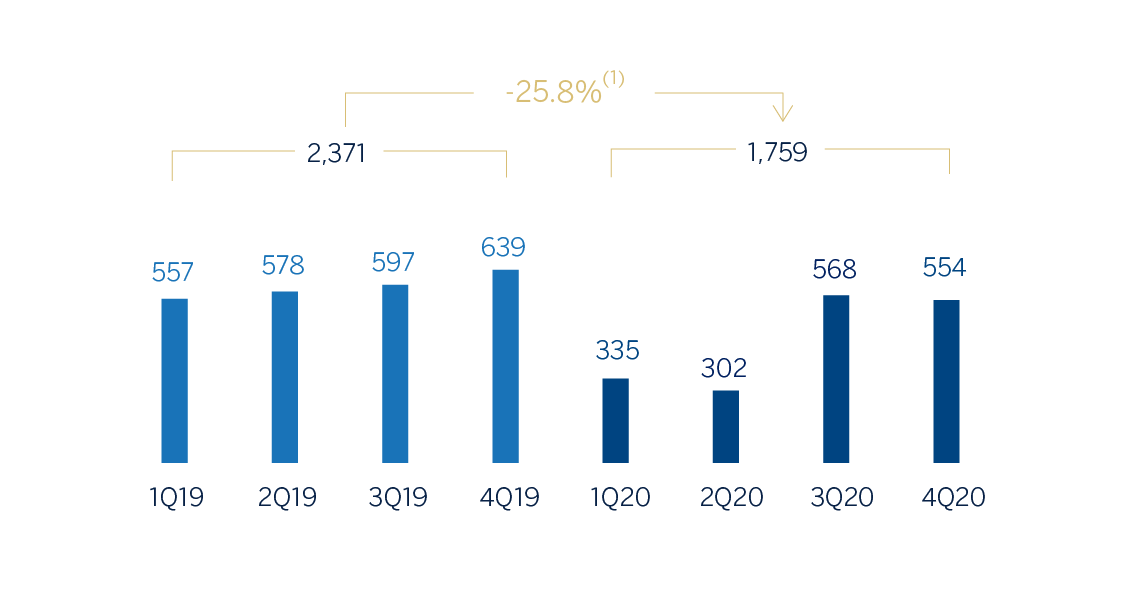
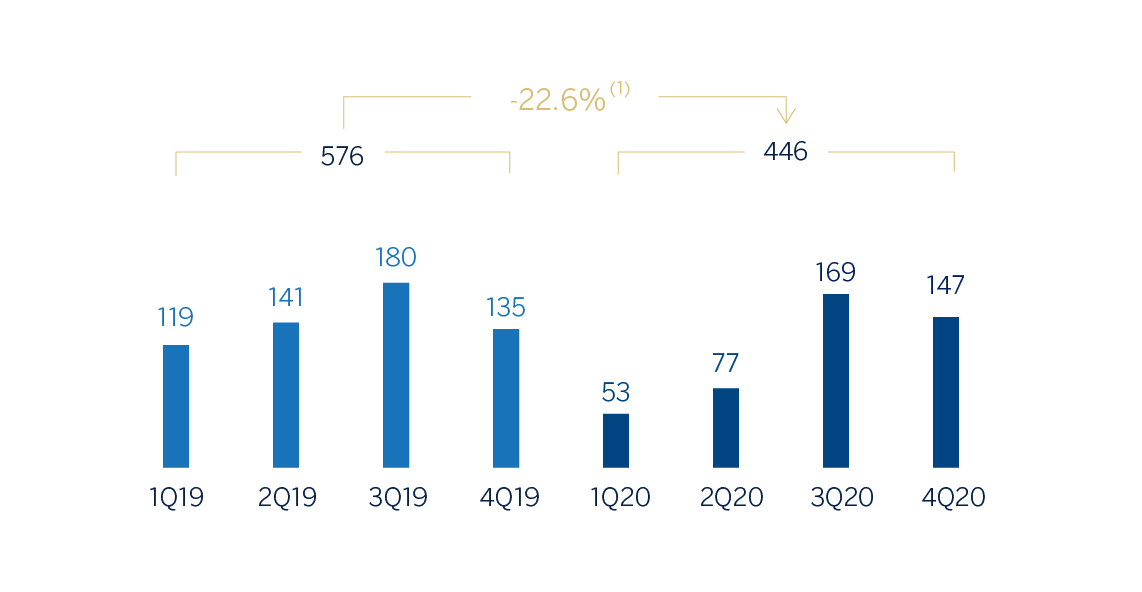
NET ATTRIBUTABLE PROFIT (MILLIONS OF EUROS)
FINANCIAL STATEMENTS AND RELEVANT BUSINESS INDICATORS (MILLIONS OF EUROS AND PERCENTAGE)
| Income statement | 2020 | ∆% | 2019 |
|---|---|---|---|
| Net interest income | 3,553 | (0.4) | 3,567 |
| Net fees and commissions | 1,802 | 2.9 | 1,751 |
| Net trading income | 174 | (27.2) | 239 |
| Other operating income and expenses | 25 | (74.2) | 98 |
| Of which: Insurance activities(1) | 465 | (10.1) | 518 |
| Gross income | 5,554 | (1.8) | 5,656 |
| Operating expenses | (3,039) | (6.6) | (3,253) |
| Personnel expenses | (1,738) | (7.7) | (1,883) |
| Other administrative expenses | (841) | (5.9) | (895) |
| Depreciation | (460) | (3.4) | (476) |
| Operating income | 2,515 | 4.7 | 2,402 |
| Impairment on financial assets not measured at fair value through profit or loss | (1,167) | n.s. | (138) |
| Provisions or reversal of provisions and other results | (538) | 39.3 | (386) |
| Profit/(loss) before tax | 809 | (56.9) | 1,878 |
| Income tax | (200) | (59.1) | (489) |
| Profit/(loss) for the year | 610 | (56.1) | 1,389 |
| Non-controlling interests | (3) | 36.5 | (3) |
| Net attributable profit/(loss) | 606 | (56.3) | 1,386 |
- (1) Includes premiums received net of estimated technical insurance reserves.
| Balance sheets | 31-12-20 | ∆% | 31-12-19 |
|---|---|---|---|
| Cash, cash balances at central banks and other demand deposits | 38,360 | 141.2 | 15,903 |
| Financial assets designated at fair value | 137,969 | 13.2 | 121,890 |
| Of which: Loans and advances | 30,680 | (10.2) | 34,175 |
| Financial assets at amortized cost | 198,173 | 1.5 | 195,260 |
| Of which: Loans and advances to customers | 167,998 | 0.4 | 167,332 |
| Inter-area positions | 21,940 | 1.4 | 21,637 |
| Tangible assets | 2,902 | (12.1) | 3,302 |
| Other assets | 6,535 | 1.5 | 6,436 |
| Total assets/liabilities and equity | 405,878 | 11.4 | 364,427 |
| Financial liabilities held for trading and designated at fair value through profit or loss | 73,921 | (4.9) | 77,731 |
| Deposits from central banks and credit institutions | 58,783 | 43.1 | 41,092 |
| Deposits from customers | 206,428 | 13.2 | 182,370 |
| Debt certificates | 39,326 | 10.7 | 35,520 |
| Inter-area positions | - | - | - |
| Other liabilities | 16,964 | (8.2) | 18,484 |
| Economic capital allocated | 10,457 | 13.3 | 9,229 |
| Relevant business indicators | 31-12-20 | ∆% | 31-12-19 |
|---|---|---|---|
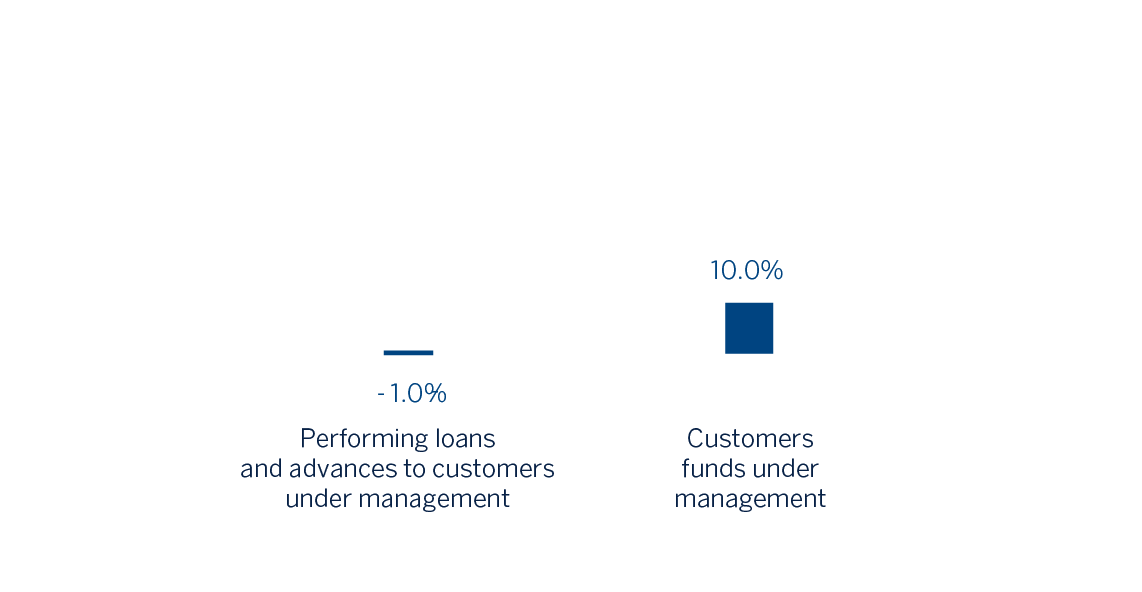
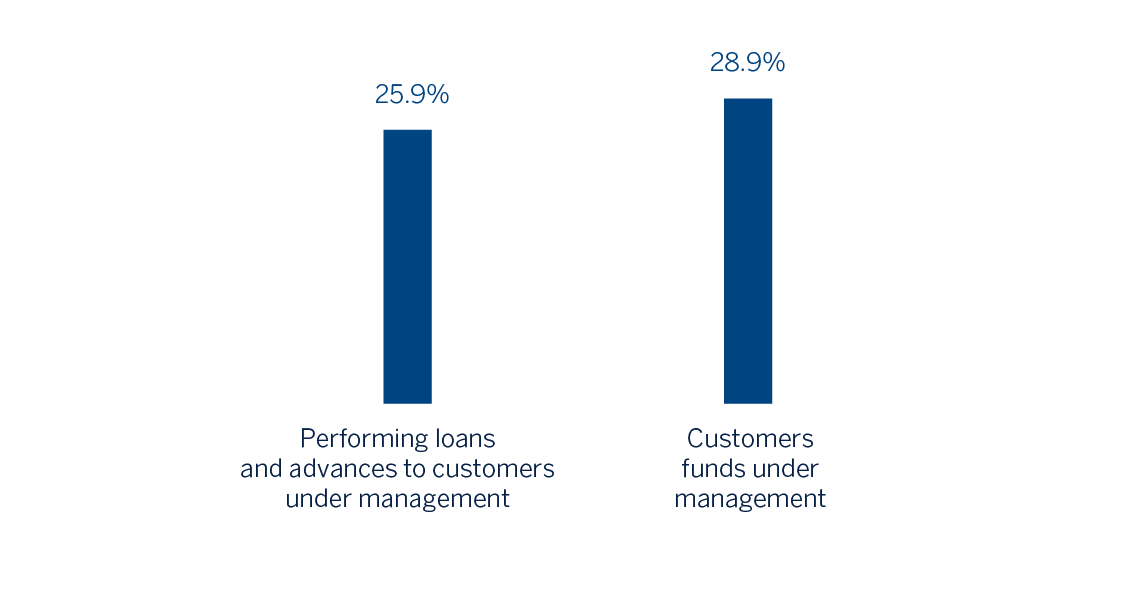
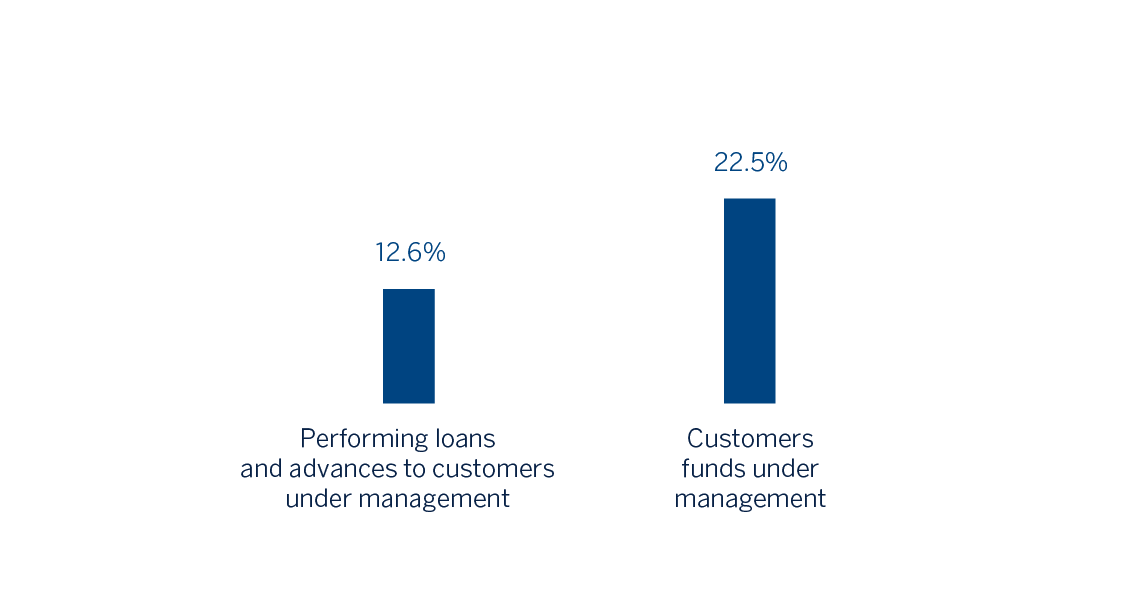
| Performing loans and advances to customers under management (1) | 165,511 | 0.8 | 164,140 |
| Non-performing loans | 8,340 | (3.4) | 8,635 |
| Customer deposits under management(1) | 205,809 | 12.9 | 182,370 |
| Off-balance sheet funds (2) | 62,707 | (5.1) | 66,068 |
| Risk-weighted assets | 104,388 | (0.5) | 104,911 |
| Efficiency ratio (%) | 54.7 | 57.5 | |
| NPL ratio (%) | 4.3 | 4.4 | |
| NPL coverage ratio (%) | 67 | 60 | |
| Cost of risk (%) | 0.67 | 0.08 |
- (1) Excluding repos.
- (2) Includes mutual funds, pension funds and other off-balance sheet funds.
Activity
The most relevant aspects related to the area's activity throughout 2020 were:
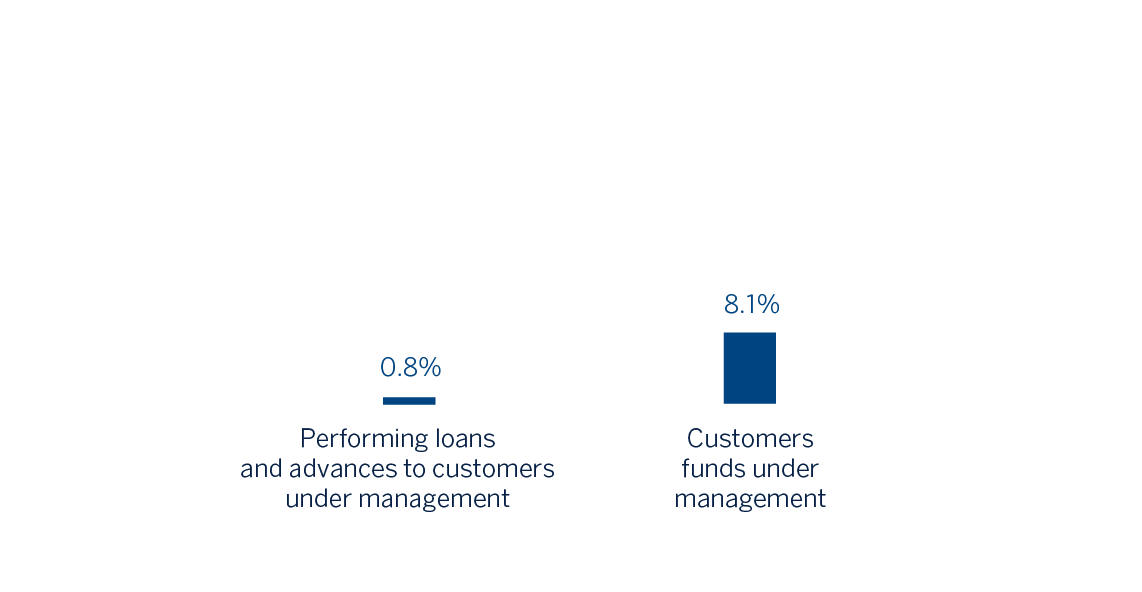
- Lending activity performing loans under management) stood higher than at the end of 2019 (up 0.8%). The reduction in mortgage lending and lending to public institutions (down 4.2%) was offset, among others, by higher balances in retail banking (up 11.2%), in SMEs (up 6.5%) and in corporate and investment banking (up 3.3%), which benefited from the facilities guaranteed by the Spanish Instituto de Crédito Oficial (hereinafter ICO).
- With regard to asset quality, the indicators remained stable compared to the previous quarter. As a result, the NPL ratio remained at 4.3% and the coverage ratio at 67%.
- Total customer funds grew by 8.1% compared to the close of 2019, partly due to the trend for greater saving, both by companies and by individual customers. This has resulted in an increase in customer deposits under management (up 12.9%), which managed to offset the negative evolution of off-balance sheet funds (down 5.1%) resulting from the unfavorable performance of the markets in 2020.
Results
Spain generated a cumulative net attributable profit of €606m in 2020, 56.3% lower than in 2019, mainly due to the increase in impairment on financial assets as a result of the pandemic, meanwhile, operating income increased by 4.7% compared to the previous year.
The main highlights of the area's income statement are:
- Net interest income was slightly lower than at the close of 2019 (down 0.4%), affected by the falling rate environment and the change in the financing mix of the companies from long- to short-term.
- Net fees and commissions performed well (up 2.9% year-on-year), widely as a result of asset management fees and fees generated by corporate banking operations, which offset exemptions on some products at the worst moments of the pandemic.
- NTI decreased (down 27.2% year-on-year), mainly due to performance of the Global Markets area in the last quarter of the year, which offsets the higher gains from ALCO portfolio sales in 2020.
- The other operating income and expenses line compares negatively to the previous year (down 74.2%), due to increased contributions to both the Single Resolution Fund and the Deposit Guarantee Fund and the lower contribution of the insurance business. It should also be noted that, once authorization was received from the competent regulators, on December 14, BBVA Seguros transferred to Allianz half plus one share of the company created to jointly develop non-life insurance business, excluding health insurance line.
- There was a reduction in operating expenses (down 6.6% year-on-year), mainly as a result of the cost-containment plans and supported by the reduction in discretionary expenses as a result of the pandemic. Therefore, the efficiency ratio stood at 54.7% compared to 57.5% in 2019.
- Impairment on financial assets increased by €1,029m compared to the previous year, mainly due to the negative impact recorded mainly in the first quarter of 2020, as a result of deterioration in the macroeconomic scenario due to COVID-19, which includes credit provisions for those sectors most affected, in a comparison that is further impacted by portfolio sales made in 2019. In quarterly terms, this line item stood at similar levels prior to the pandemic, which meant that the cumulative cost of risk stood at 0.67% at the close of December.
- Finally, provisions and other results generated a more negative result compared to the previous year, mainly due to provisions for potential claims.
The United States
Highlights
- Flat lending activity and strong increase in customer deposits in the year.
- The cost of risk favorable evolution continues, with a significant improvement in the quarter.
- Positive evolution of fees and commissions and NTI.
- Net attributable profit impacted by the Fed rate reduction and the significant increase in the impairment on financial assets line.
BUSINESS ACTIVITY (1)
(YEAR-ON-YEAR CHANGE AT CONSTANT EXCHANGE RATE. DATA AS OF 31-12-20)
(1) Excluding repos.
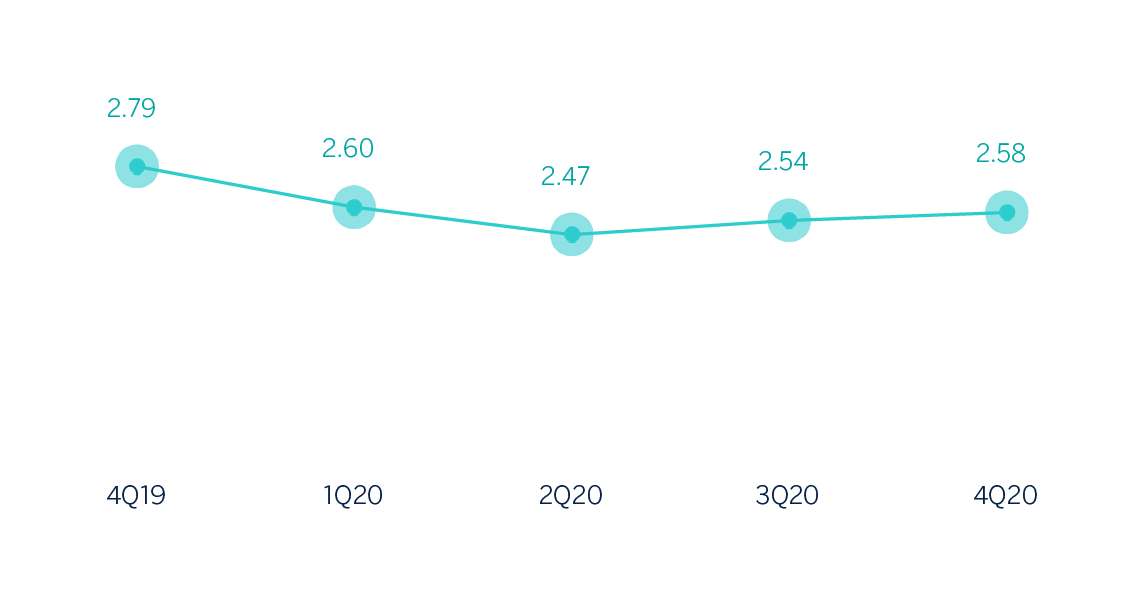
NET INTEREST INCOME/ATAS
(PERCENTAGE. CONSTANT EXCHANGE RATE)
OPERATING INCOME
(MILLIONS OF EUROS AT CONSTANT EXCHANGE RATE)
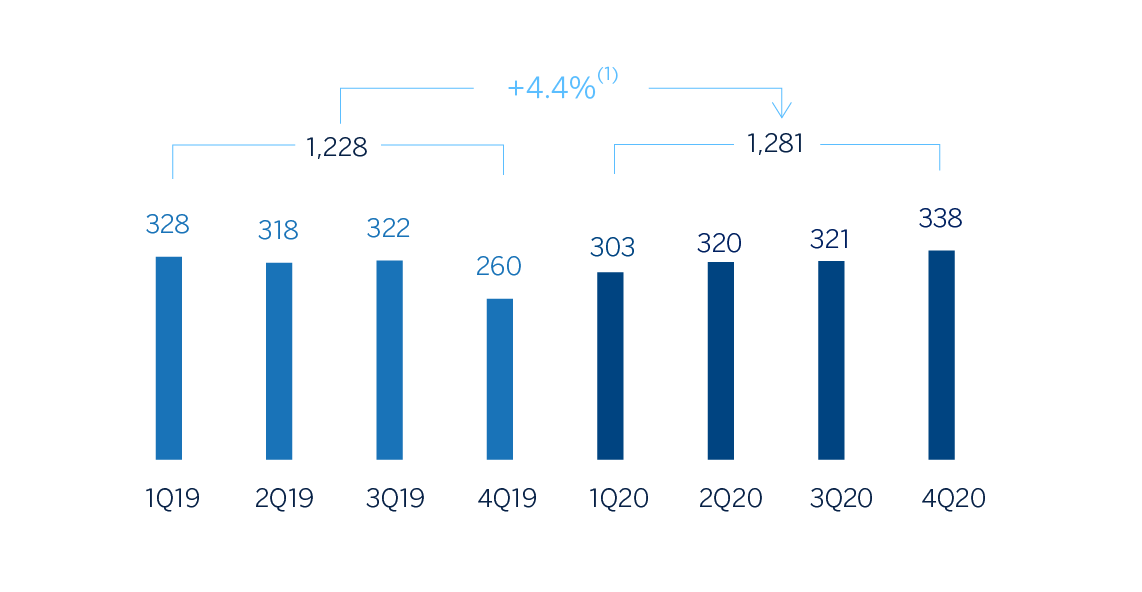
(1) At current exchange rate: +1.9%.
NET ATTRIBUTABLE PROFIT
(MILLIONS OF EUROS AT CONSTANT EXCHANGE RATE)
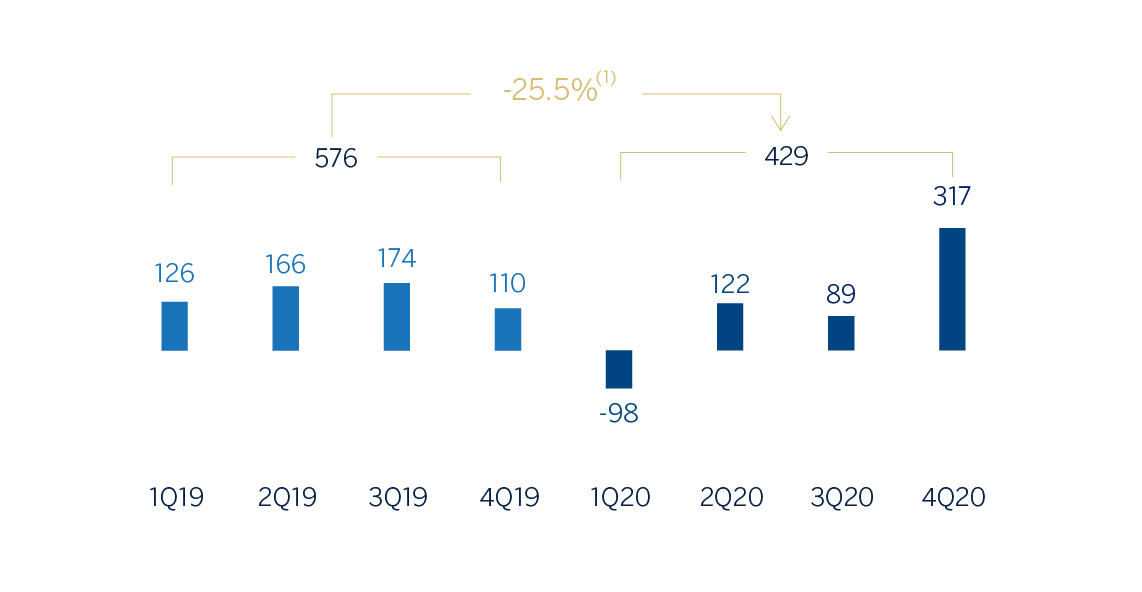
(1) At current exchange rate: -27.2%.
FINANCIAL STATEMENTS AND RELEVANT BUSINESS INDICATORS (MILLIONS OF EUROS AND PERCENTAGE)
| Income statement | 2020 | ∆% | ∆%(1) | 2019 |
|---|---|---|---|---|
| Net interest income | 2,284 | (4.6) | (2.6) | 2,395 |
| Net fees and commissions | 665 | 3.2 | 5.5 | 644 |
| Net trading income | 220 | 27.4 | 31.8 | 173 |
| Other operating income and expenses | (17) | n.s. | n.s. | 12 |
| Gross income | 3,152 | (2.2) | (0.0) | 3,223 |
| Operating expenses | (1,870) | (4.9) | (2.8) | (1,966) |
| Personnel expenses | (1,085) | (3.7) | (1.6) | (1,126) |
| Other administrative expenses | (577) | (7.1) | (5.1) | (621) |
| Depreciation | (209) | (4.7) | (2.7) | (219) |
| Operating income | 1,281 | 1.9 | 4.4 | 1,257 |
| Impairment on financial assets not measured at fair value through profit or loss | (776) | 41.0 | 44.3 | (550) |
| Provisions or reversal of provisions and other results | (4) | 70.8 | 72.5 | (2) |
| Profit/(loss) before tax | 502 | (28.8) | (27.1) | 705 |
| Income tax | (73) | (36.8) | (35.4) | (115) |
| Profit/(loss) for the year | 429 | (27.2) | (25.5) | 590 |
| Non-controlling interests | - | - | - | - |
| Net attributable profit/(loss) | 429 | (27.2) | (25.5) | 590 |
| Balance sheets | 31-12-20 | ∆% | ∆% (1) | 31-12-19 |
|---|---|---|---|---|
| Cash, cash balances at central banks and other demand deposits | 17,260 | 108.1 | 127.3 | 8.293 |
| Financial assets designated at fair value | 6,792 | (11.3) | (3.1) | 7,659 |
| Of which: Loans and advances | 349 | 33.8 | 46.2 | 261 |
| Financial assets at amortized cost | 66,933 | (3.7) | 5.2 | 69,510 |
| Of which: Loans and advances to customers | 57,983 | (8.2) | 0.3 | 63,162 |
| Inter-area positions | - | - | - | - |
| Tangible assets | 810 | (11.4) | (3.2) | 914 |
| Other assets | 2,158 | 0.2 | 9.5 | 2,153 |
| Total assets/liabilities and equity | 93,953 | 6.1 | 15.9 | 88,529 |
| Financial liabilities held for trading and designated at fair value through profit or loss | 952 | 237.9 | 269.0 | 282 |
| Deposits from central banks and credit institutions | 5,570 | 36.5 | 49.1 | 4,081 |
| Deposits from customers | 69,923 | 3.6 | 13.1 | 67,525 |
| Debt certificates | 2,879 | (18.9) | (11.4) | 3,551 |
| Inter-area positions | 4,869 | 42.5 | 55.7 | 3,416 |
| Other liabilities | 6,124 | 5.0 | 14.7 | 5,831 |
| Economic capital allocated | 3,636 | (5.4) | 3.3 | 3,843 |
| Relevant business indicators | 31-12-20 | ∆% | ∆% (1) | 31-12-19 |
|---|---|---|---|---|
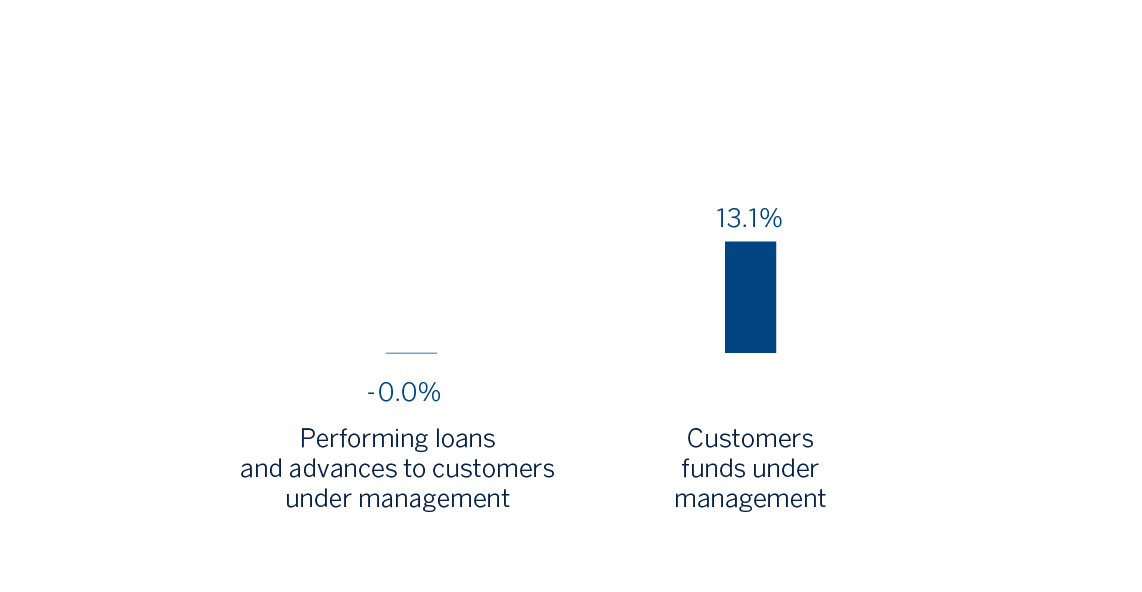
| Performing loans and advances to customers under management (2) | 57,887 | (8.5) | (0.0) | 63,241 |
| Non-performing loans | 1,258 | 72.3 | 88.2 | 730 |
| Customer deposits under management (2) | 69,926 | 3.5 | 13.1 | 67,528 |
| Off-balance sheet funds (3) | - | - | - | - |
| Risk-weighted assets | 60,365 | (7.4) | 1.2 | 65,170 |
| Efficiency ratio (%) | 59.3 | 61.0 | ||
| NPL ratio (%) | 2.1 | 1.1 | ||
| NPL coverage ratio (%) | 84 | 101 | ||
| Cost of risk (%) | 1.18 | 0.88 |
- (1) Figures at constant exchange rate.
- (2) Excluding repos.
- (3) Includes mutual funds and other off-balance sheet funds.
Unless expressly stated otherwise, all the comments below on rates of change, for both activity and earnings, will be given at constant exchange rate. These rates, together with changes at current exchange rates, can be found in the attached tables of financial statements and relevant business indicators. In relation to the sale agreement reached by the BBVA Group with PNC (For more information see “Highlights” section of this report), which includes certain companies of the Group in the United States, the figures and comments of this business area are presented incorporating the companies mentioned at the end of December 2020.
Activity
The most relevant aspects related to the area's activity during 2020 were:
- Thw lending activity (performing loans under management) showed lower dynamism between October and December (down 3.2%), due to the combined effect of several factors, including the volume of liquidity injected into the system and the use by companies of credit facilities provided during the first and second quarters of the year. In comparison to December 2019, the loan portfolio remains flat, mainly due to the performance of the Corporate and Business Banking segment, which was driven by the Paycheck Protection Program. The rest of the retail portfolio showed reductions in rates of change with respect to the end of 2019, due to the unfavorable impact of the pandemic.
- In terms of risk indicators, the NPL ratio showed an upward trend during the year, focused on the most sensitive sectors in the COVID-19 environment and closed at 2.1%. For its part, the NPL coverage ratio stood at 84%, compared to 101% at the end of December 2019.
- Customer deposits under management increased by 13.1% in the year, due to the placement of the increased liquidity made available to customers in demand deposits. This line showed a flat performance in the quarter.
Results
The United States generated a net attributable profit of €429m during 2020, 25.5% less than in the same period of the previous year. The most relevant aspects related to the income statement are summarized below:
- Net interest income fell by 2.6% year-on-year, affected by the Fed's interest rate cuts, for a total of 225 basis points since the first quarter of 2019, partially offset by the lower financing costs due to the excellent cost of deposits management. This line increased by 2.3% in the quarter, mainly by both the lower expenses and the funding mix improvement.
- Net fees and commissions closed with an increase of 5.5% compared to the same period last year, mainly due to commissions generated by the New York branch.
- NTI contribution increased (up 31.8% year-on-year) with a favorable evolution in the quarter (up 54.8%), due to the higher results from the Global Markets unit and the stake in Propel.
- Operating expenses fell compared to the previous year (down 2.8%), as a result of both the decrease in some discretionary expenses due to the pandemic and the containment plans implemented.
- Increase in the impairment of financial assets (up 44.3% year-on-year), explained mainly by the adjustment in the macroeconomic scenario due to the negative effects of COVID-19, mainly registered in the first quarter of 2020, and to higher loan-loss provisions to cover specific customers in the Oil & Gas sector. It should be noted that in the last quarter of 2020, this line closed with a release of €58m, which explains the improvement of the cumulative cost of risk, which stood at 1.18% at the end of December 2020 compared to 1.69 at the end of September.
Mexico
Highlights
- Slight deceleration of activity, impacted by the macroeconomic environment.
- Solid liquidity position.
- Controlled expenses growing significatively under the inflation and the strength of the gross income.
- Net attributable profit affected by the significant increase in the impairment on financial assets line.
BUSINESS ACTIVITY (1)
(YEAR-ON-YEAR CHANGE AT CONSTANT EXCHANGE RATE. DATA AS OF 31-12-20)
(1) Excluding repos.
NET INTEREST INCOME/ATAS
(PERCENTAGE. CONSTANT EXCHANGE RATE)
OPERATING INCOME
(MILLIONS OF EUROS AT CONSTANT EXCHANGE RATE)
NET ATTRIBUTABLE PROFIT
(MILLIONS OF EUROS AT CONSTANT EXCHANGE RATE)
(1) At current exchange rate: +13.1%.
(1) At current exchange rate: -34.8%.
FINANCIAL STATEMENTS AND RELEVANT BUSINESS INDICATORS (MILLIONS OF EUROS AND PERCENTAGE)
| Income statement | 2020 | ∆% | ∆%(1) | 2019 |
|---|---|---|---|---|
| Net interest income | 5,415 | (12.8) | (0.7) | 6,209 |
| Net fees and commissions | 1,065 | (17.9) | (6.6) | 1,298 |
| Net trading income | 423 | 36.4 | 55.3 | 310 |
| Other operating income and expenses | 114 | (46.2) | (38.8) | 212 |
| Gross income | 7,017 | (12.6) | (0.5) | 8,029 |
| Operating expenses | (2,340) | (11.5) | 0.7 | (2,645) |
| Personnel expenses | (967) | (14.0) | (2.1) | (1,124) |
| Other administrative expenses | (1,061) | (9.7) | 2.8 | (1,175) |
| Depreciation | (311) | (9.9) | 2.5 | (346) |
| Operating income | 4,677 | (13.1) | (1.1) | 5,384 |
| Impairment on financial assets not measured at fair value through profit or loss | (2,172) | 28.0 | 45.6 | (1,698) |
| Provisions or reversal of provisions and other results | (33) | n.s. | n.s. | 5 |
| Profit/(loss) before tax | 2,472 | (33.0) | (23.8) | 3,691 |
| Income tax | (713) | (28.1) | (18.2) | (992) |
| Profit/(loss) for the year | 1,759 | (34.8) | (25.8) | 2,699 |
| Non-controlling interests | (0) | (32.6) | (23.3) | (0) |
| Net attributable profit/(loss) | 1,759 | (34.8) | (25.8) | 2,699 |
| Balance sheets | 31-12-20 | ∆% | ∆% (1) | 31-12-19 |
|---|---|---|---|---|
| Cash, cash balances at central banks and other demand deposits | 9,159 | 41.2 | 62.4 | 6,489 |
| Financial assets designated at fair value | 36,360 | 15.8 | 33.2 | 31,402 |
| Of which: Loans and advances | 2,589 | 233.2 | 283.4 | 777 |
| Financial assets at amortized cost | 59,814 | (9.6) | 4.0 | 66,180 |
| Of which: Loans and advances to customers | 50,002 | (13.9) | (0.9) | 58,081 |
| Tangible assets | 1,647 | (18.5) | (6.3) | 2,022 |
| Other assets | 3,244 | 8.7 | 25.0 | 2,985 |
| Total assets/liabilities and equity | 110,224 | 1.0 | 16.3 | 109,079 |
| Financial liabilities held for trading and designated at fair value through profit or loss | 23,801 | 9.3 | 25.7 | 21,784 |
| Deposits from central banks and credit institutions | 5,122 | 141.9 | 178.3 | 2,117 |
| Deposits from customers | 54,052 | (3.4) | 11.2 | 55,934 |
| Debt certificates | 7,387 | (16.4) | (3.8) | 8,840 |
| Other liabilities | 14,526 | (6.4) | 7.7 | 15,514 |
| Economic capital allocated | 5,336 | 9.1 | 25.6 | 4,889 |
| Relevant business indicators | 31-12-20 | ∆% | ∆% (1) | 31-12-19 |
|---|---|---|---|---|
| Performing loans and advances to customers under management (2) | 50,446 | (13.9) | (1.0) | 58,617 |
| Non-performing loans | 1,818 | 23.0 | 41.6 | 1,478 |
| Customer deposits under management (2) | 53,775 | (2.8) | 11.8 | 55,331 |
| Off-balance sheet funds (3) | 22,524 | (7.9) | 5.9 | 24,464 |
| Risk-weighted assets | 60,797 | 2.5 | 18.0 | 59,299 |
| Efficiency ratio (%) | 33.3 | 32.9 | ||
| NPL ratio (%) | 3.3 | 2.4 | ||
| NPL coverage ratio (%) | 122 | 136 | ||
| Cost of risk (%) | 4.02 | 3.01 |
(1) Figures at constant exchange rate.
(2) Excluding repos.
(3) Includes mutual funds, pension funds and other off-balance sheet funds.
Unless expressly stated otherwise, all the comments below on rates of change, for both activity and results, will be given at constant exchange rates. These rates, together with changes at current exchange rates, can be found in the attached tables of financial statements and relevant business indicators.
Activity
The most relevant aspects related to the area's activity during the year 2020 were:
- Lending activity (performing loans under management) decreased slightly (down 1.0% year-on-year), due to the economic weakness resulting from the closure of non-essential activities related to the pandemic. The wholesale portfolio fell slightly in 2020 (down 0.7% year-on-year) due to the amortizations related to the credit facilities registered in the first quarter of the year. On the other hand, the retail portfolio registered a decrease compared to December 2019 (down 0.5%), mainly due to the fact that the consumer and credit card portfolios recorded lower balances, affected by the lower economic activity resulting from the pandemic. This was partially offset by a year-on-year increase in the mortgage portfolio (up 7.4%).
- As for the asset quality indicators, the NPL ratio stood above the figure at the end of 2019 (up 3.3%), with an increase in the balance of non-performing loans in the consumer, credit cards and mortgage portfolios, mainly related to portfolios that participated in the support programs. For its part, the coverage ratio stood below December 2019 level, at 122%.
- Customer deposits under management increased by 11.8%, supported by the growth of demand deposits that offset the decrease of time deposits, due to the preference of customers to have their balance liquid in an environment of lower interest rates and uncertainty due to the pandemic. Off-balance sheet funds also performed well in 2020 (up 5.9%).
Results
BBVA Mexico achieved a net attributable profit of €1,759m in 2020, which is a 25.8% reduction compared to the previous year. This was due to the increase in the impairment on financial assets, generated by additional provisions made during the first half of the 2020, derived from COVID-19. The most relevant aspects related to the income statement are summarized below:
- Net interest income closed almost in line with the end of 2019 (down 0.7%). The appropriate management and optimization of the net interest income has managed to offset the lower dynamism of the retail portfolio and a reduction of 300 basis points in the benchmark rates throughout 2020. Additionally, this reflects the application of customer support programs during the first half and a change in the portfolio mix, with a higher percentage of wholesale customers for most of 2020 and stood at the end of December at pre-pandemic levels.
- Net fees and commissions fell (down 6.6%), mainly as a result of the closure of non-essential activities in Mexico, which caused a lower transactionality with credit cards. Likewise, the lower activity in investment banking and the increase in transactions made through digital channels, which do not generate fees and commissions for individual customers, also influenced this decrease.
- NTI continued to perform well, with a 55.3% year-on-year growth, mainly derived from the result of the Global Markets unit, as well as greater earnings from foreign exchange operations and capital gains from the ALCO portfolio sales.
- The other operating income and expenses line registered a year-on-year decrease of 38.8%, as a result of a greater contribution to the Deposit Guarantee Fund due to the higher volume deposited by customers and a lower performance of the insurance business, as a result of an increase in claims.
- Operating expenses closed at similar levels to the previous year (up 0.7%), with a growth that is below the average inflation levels for the year (up 3.4%) reflecting the effort to maintain strict control, despite additional expenses in medical supplies to ensure the health and safety of the employees and customers.
- The impairment on financial assets line increased by 45.6%, fundamentally due to the additional provisions caused by COVID-19, mainly registered in the first half of 2020, which include the deterioration in the macroeconomic scenario compared to the one originally forecasted in early 2020. With regard to the cumulative cost of risk as of December 2020, it stood at 4.02% following the upturn in March.
- The provisions and other results line showed an unfavorable comparison at €-33m compared with a positive result of €5m in the previous year, and mainly includes higher provisions for contingent liabilities arising from COVID-19.
Turkey
Highlights
- Significant credit growth driven by Turkish lira loans. Strong growth in foreign currency deposits.
- Outstanding performance of recurring revenue and efficiency ratio improvement.
- Reduction in the NPL ratio year-to date.
- Double digit growth in the main income statement margins.
BUSINESS ACTIVITY (1)
(YEAR-ON-YEAR CHANGE AT CONSTANT EXCHANGE RATE. DATA AS OF 31-12-20)
(1) Excluding repos.
NET INTEREST INCOME/ATAS
(PERCENTAGE. CONSTANT EXCHANGE RATE)
OPERATING INCOME
(MILLIONS OF EUROS AT CONSTANT EXCHANGE RATE)
NET ATTRIBUTABLE PROFIT
(MILLIONS OF EUROS AT CONSTANT EXCHANGE RATE)
(1) At current exchange rate +7.1%.
(1) At current exchange rate +11.4%.
FINANCIAL STATEMENTS AND RELEVANT BUSINESS INDICATORS (MILLIONS OF EUROS AND PERCENTAGE)
| Income statement | 2020 | ∆% | ∆%(1) | 2019 |
|---|---|---|---|---|
| Net interest income | 2,783 | (1.1) | 25.2 | 2,814 |
| Net fees and commissions | 510 | (28.8) | (9.9) | 717 |
| Net trading income | 227 | n.s. | n.s. | 10 |
| Other operating income and expenses | 53 | 7.3 | 35.8 | 50 |
| Gross income | 3,573 | (0.5) | 26.0 | 3,590 |
| Operating expenses | (1,029) | (15.3) | 7.3 | (1,215) |
| Personnel expenses | (561) | (17.2) | 4.8 | (678) |
| Other administrative expenses | (319) | (11.1) | 12.6 | (359) |
| Depreciation | (150) | (16.4) | 5.9 | (179) |
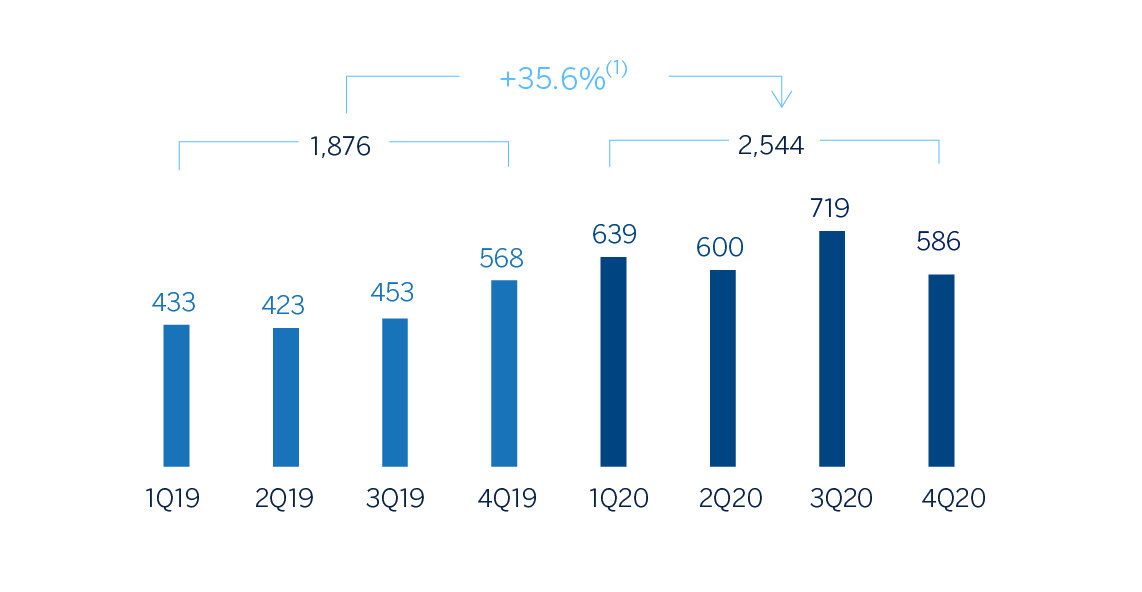
| Operating income | 2,544 | 7.1 | 35.6 | 2,375 |
| Impairment on financial assets not measured at fair value through profit or loss | (895) | (1.2) | 25.0 | (906) |
| Provisions or reversal of provisions and other results | (127) | (1.0) | 25.3 | (128) |
| Profit/(loss) before tax | 1,522 | 13.5 | 43.7 | 1,341 |
| Income tax | (380) | 21.7 | 54.1 | (312) |
| Profit/(loss) for the year | 1,142 | 11.0 | 40.5 | 1,029 |
| Non-controlling interests | (579) | 10.6 | 40.0 | (524) |
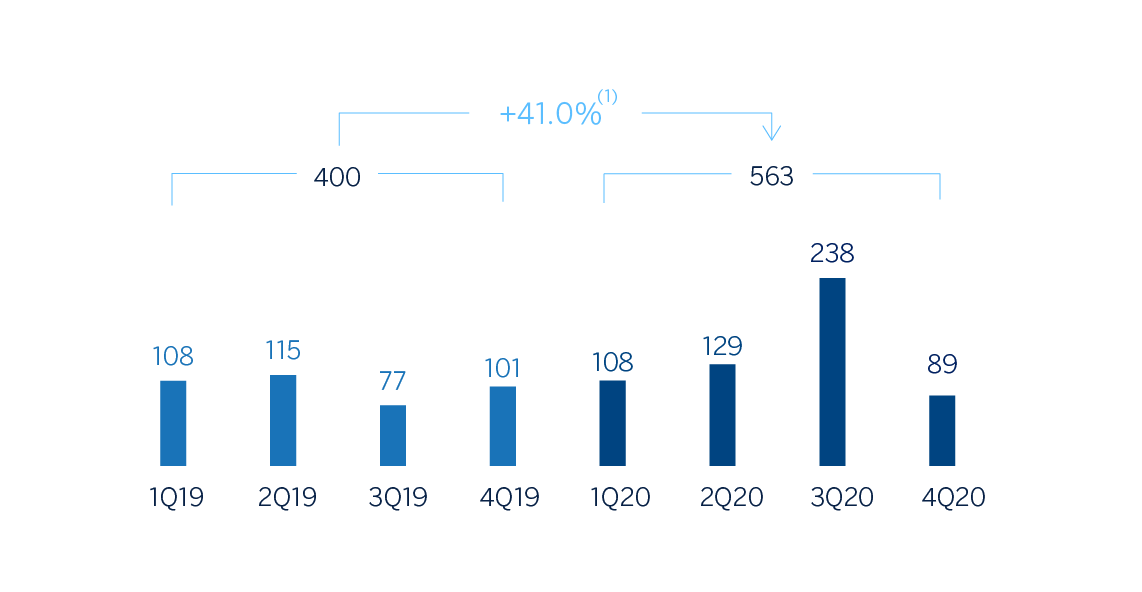
| Net attributable profit/(loss) | 563 | 11.4 | 41.0 | 506 |
| Balance sheets | 31-12-20 | ∆% | ∆% (1) | 31-12-19 |
|---|---|---|---|---|
| Cash, cash balances at central banks and other demand deposits | 5,477 | (0.2) | 36.1 | 5,486 |
| Financial assets designated at fair value | 5,332 | 1.2 | 38.0 | 5,268 |
| Of which: Loans and advances | 415 | (6.6) | 27.3 | 444 |
| Financial assets at amortized cost | 46,705 | (8.9) | 24.2 | 51,285 |
| Of which: Loans and advances to customers | 37,295 | (7.9) | 25.5 | 40,500 |
| Tangible assets | 901 | (19.4) | 9.9 | 1,117 |
| Other assets | 1,170 | (7.1) | 26.7 | 1,260 |
| Total assets/liabilities and equity | 59,585 | (7.5) | 26.1 | 64,416 |
| Financial liabilities held for trading and designated at fair value through profit or loss | 2,336 | 7.0 | 45.8 | 2,184 |
| Deposits from central banks and credit institutions | 3,381 | (24.4) | 3.0 | 4,473 |
| Deposits from customers | 39,353 | (4.8) | 29.8 | 41,335 |
| Debt certificates | 3,503 | (18.0) | 11.8 | 4,271 |
| Other liabilities | 8,476 | (10.6) | 21.9 | 9,481 |
| Economic capital allocated | 2,535 | (5.1) | 29.3 | 2,672 |
| Relevant business indicators | 31-12-20 | ∆% | ∆% (1) | 31-12-19 |
|---|---|---|---|---|
| Performing loans and advances to customers under management (2) | 36,638 | (7.6) | 25.9 | 39,662 |
| Non-performing loans | 3,183 | (13.1) | 18.5 | 3,663 |
| Customer deposits under management (2) | 39,346 | (4.8) | 29.8 | 41,324 |
| Off-balance sheet funds (3) | 3,425 | (12.3) | 19.5 | 3,906 |
| Risk-weighted assets | 53,021 | (6.4) | 27.6 | 56,642 |
| Efficiency ratio (%) | 28.8 | 33.8 | ||
| NPL ratio (%) | 6.6 | 7.0 | ||
| NPL coverage ratio (%) | 80 | 75 | ||
| Cost of risk (%) | 2.13 | 2.07 |
(1) Figures at constant exchange rate.
(2) Excluding repos.
(3) Includes mutual funds and other off-balance sheet funds.
Unless expressly stated otherwise, all comments below on rates of changes for both activity and income, will be presented at constant exchange rates. These rates, together with changes at current exchange rates, can be observed in the attached tables of the financial statements and relevant business indicators.
Activity
The most relevant aspects related to the area’s activity during 2020 were:
- Lending activity (performing loans under management) increased by 25.9% year-to-date mainly driven by a growth in Turkish lira loans (up 33.6%) which was supported by commercial and consumer loans. Foreign-currency loans (in U.S. dollars) fell during 2020 (down 5.4%).
- Lending growth was accelerated in the first half the year favored by the low interest rate environment, yet as the interest rates started to increase its loan growth moderated in the second half of the year. By segments;
- Turkish lira commercial loans performed remarkably well year-on-year (up 51.6%) mainly thanks to the Credit Guarantee Fund utilizations and short term commercial lending.
- Additionally, retail loans increased (up 22.3%) driven by both consumer loans including mortgages (up 22.6%) and credit cards (up 21.5%), thanks to the recovering economic activity with the steps taken towards new normal in the COVID-19 environment.
- In terms of asset quality, the NPL ratio decreased from December 2019 and stood at 6.6%. The NPL coverage ratio increased to 80% as of December 31, 2020 compared to the previous year.
- Customer deposits under management (66% of total liabilities in the area as of December 31, 2020) remained the main source of funding for the balance sheet and increased by 29.8% year-to-date. It is worth mentioning the positive performance of demand deposits which increased by 73.9% year-to-date and now represent 51% of total customer deposits, as well as the off-balance sheet funds which grew by 19.5% during the same period. Foreign currency demand deposit grew by 84.6% year-to-date, with remarkable increases in second and third quarters, mainly due to the dollarization impact and increasing demand towards gold deposits.
Results
Turkey generated a net attributable profit of €563m in 2020, 41.0% higher than the same period of the previous year, despite a decrease in the quarter (down -62.6%). The most significant aspects of the year-on-year evolution in the income statement are the following:
- Net interest income grew (up 25.2%) mainly thanks to good management of customer spreads, higher activity volume and remarkable contribution from inflation-linked bonds.
- Net fees and commissions contracted by -9.9% on a year-on-year basis, mainly due to the changes in fees regulation that came into force in March 2020 and lower activity levels due to the impact of COVID-19. With the beginning of the third quarter, this line started to record growth thanks to the recovery of the economic activity with the gradual steps taken towards normalization.
- Good performance of the NTI, which contributed €227m in 2020 compared to €10m in 2019. This is mainly the result of the good performance of foreign currency positions and trading operations.
- Other operating income and expenses increased by 35.8% year-on-year, mainly due to the positive contribution of non-financial activities (renting activity) and higher insurance activity net results.
- Operating expenses increased by 7.3%, significantly below the average inflation rate (12.28%), which is also supported by the reduction in some discretionary expenses due to COVID-19. As a result of the growth of the gross income well above the growth of expenses, the efficiency ratio improved 5 percentage points during the year to 28.8%.
- Impairment losses on financial assets increased by 25.0% primarily due to higher provisions for specific clients in the commercial portfolio. As a result, the cumulative cost of risk at the end of December stood at 2.13%.
- The line provisions and other results closed in 2020 with a loss of €127m, which is a similar level to the one registered in the previous year, mainly due to provisions for special funds and for contingent liabilities and commitments.
South America
Highlights
- Activity growth impacted by the support measures from the different governments.
- Year-on-year growth in recurring revenues and year-on-year decline in NTI due to the sale of the stake in Prisma in 2019.
- Contained growth in expenditure, well below the area's average inflation.
- Net attributable profit affected by the increase in the impairment on financial assets line.
BUSINESS ACTIVITY (1)
(YEAR-ON-YEAR CHANGE AT CONSTANT EXCHANGE RATES. DATA AS OF 31-12-20)
(1) Excluding repos.
NET INTEREST INCOME/ATAS
(PERCENTAGE. CONSTANT EXCHANGE RATES)
OPERATING INCOME
(MILLIONS OF EUROS AT CONSTANT EXCHANGE RATES)
(1) At current exchange rate: -18.6%.
NET ATTRIBUTABLE PROFIT
(MILLIONS OF EUROS AT CONSTANT EXCHANGE RATES)
(1) At current exchange rate: -38.2%.
FINANCIAL STATEMENTS AND RELEVANT BUSINESS INDICATORS (MILLIONS OF EUROS AND PERCENTAGE)
| Income statement | 2020 | ∆% | ∆% (1) | 2019 |
|---|---|---|---|---|
| Net interest income | 2,701 | (15.5) | 0.9 | 3,196 |
| Net fees and commissions | 484 | (13.1) | 0.6 | 557 |
| Net trading income | 407 | (29.3) | (12.8) | 576 |
| Other operating income and expenses | (367) | (23.4) | (18.9) | (479) |
| Gross income | 3,225 | (16.2) | 1.7 | 3,850 |
| Operating expenses | (1,372) | (12.8) | 2.8 | (1,574) |
| Personnel expenses | (669) | (15.7) | 0.2 | (794) |
| Other administrative expenses | (549) | (9.8) | 6.5 | (609) |
| Depreciation | (154) | (10.3) | 1.9 | (171) |
| Operating income | 1,853 | (18.6) | 0.8 | 2,276 |
| Impairment on financial assets not measured at fair value through profit or loss | (864) | 11.3 | 34.0 | (777) |
| Provisions or reversal of provisions and other results | (93) | (10.2) | 24.5 | (103) |
| Profit/(loss) before tax | 896 | (35.8) | (19.9) | 1,396 |
| Income tax | (277) | (24.5) | (4.5) | (368) |
| Profit/(loss) for the year | 619 | (39.8) | (25.3) | 1,028 |
| Non-controlling interests | (173) | (43.7) | (31.6) | (307) |
| Net attributable profit/(loss) | 446 | (38.2) | (22.6) | 721 |
| Balance sheets | 31-12-20 | ∆% | ∆% (1) | 31-12-19 |
|---|---|---|---|---|
| Cash, cash balances at central banks and other demand deposits | 7,126 | (17.1) | 4.1 | 8,601 |
| Financial assets designated at fair value | 7,329 | 19.7 | 44.3 | 6,120 |
| Of which: Loans and advances | 108 | (5.2) | 8.4 | 114 |
| Financial assets at amortized cost | 38,549 | 1.8 | 20.7 | 37,869 |
| Of which: Loans and advances to customers | 33,615 | (5.8) | 11.8 | 35,701 |
| Tangible assets | 808 | (16.5) | (4.7) | 968 |
| Other assets | 1,624 | 12.9 | 32.5 | 1,438 |
| Total assets/liabilities and equity | 55,435 | 0.8 | 20.7 | 54,996 |
| Financial liabilities held for trading and designated at fair value through profit or loss | 1,326 | (28.7) | (17.6) | 1,860 |
| Deposits from central banks and credit institutions | 5,378 | 47.1 | 72.0 | 3,656 |
| Deposits from customers | 36,874 | 2.1 | 23.4 | 36,104 |
| Debt certificates | 2,612 | (18.9) | (7.5) | 3,220 |
| Other liabilities | 7,093 | (7.5) | 10.4 | 7,664 |
| Economic capital allocated | 2,152 | (13.6) | 4.7 | 2,492 |
| Relevant business indicators | 31-12-20 | ∆% | ∆% (1) | 31-12-19 |
|---|---|---|---|---|
| Performing loans and advances to customers under management (2) | 33,719 | (5.3) | 12.6 | 35,598 |
| Non-performing loans | 1,780 | (3.9) | 13.6 | 1,853 |
| Customer deposits under management (3) | 36,886 | 2.1 | 23.3 | 36,123 |
| Off-balance sheet funds (4) | 13,722 | 6.7 | 20.3 | 12,864 |
| Risk-weighted assets | 39,804 | (12.4) | 5.2 | 45,413 |
| Efficiency ratio (%) | 42.5 | 40.9 | ||
| NPL ratio (%) | 4.4 | 4.4 | ||
| NPL coverage ratio (%) | 110 | 100 | ||
| Cost of risk (%) | 2.36 | 1.88 |
- (1) Figures at constant exchange rates.
- (2) Excluding repos.
- (3) Excluding repos and including specific marketable debt securities.
- (4)Includes mutual funds, pension funds and other off-balance sheet funds.
SOUTH AMERICA. DATA PER COUNTRY (MILLIONS OF EUROS)
| Operating income | Net attributable profit/(loss) | |||||||
|---|---|---|---|---|---|---|---|---|
| Country | 2020 | ∆% | ∆% (1) | 2019 | 2020 | ∆% | ∆% (1) | 2019 |
| Argentina | 343 | (37.3) | n.s. | 548 | 89 | (33.0) | n.s. | 133 |
| Colombia | 591 | (7.4) | 6.2 | 639 | 165 | (38.0) | (28.9) | 267 |
| Peru | 718 | (13.2) | (7.2) | 827 | 110 | (45.6) | (41.8) | 202 |
| Other countries (2) | 200 | (23.4) | (11.4) | 261 | 82 | (31.7) | (20.2) | 120 |
| Total | 1,853 | (18.6) | 0.8 | 2,276 | 446 | (38.2) | (22.6) | 721 |
- (1) Figures at constant exchange rates.
- (2)Bolivia, Chile (Forum), Paraguay, Uruguay and Venezuela. Additionally, it includes eliminations and other charges.
SOUTH AMERICA. RELEVANT BUSINESS INDICATORS PER COUNTRY (MILLIONS OF EUROS)
| Argentina | Colombia | Peru | ||||
|---|---|---|---|---|---|---|
| 31-12-20 | 31-12-19 | 31-12-20 | 31-12-19 | 31-12-20 | 31-12-19 | |
| Performing loans and advances to customers under management (1) (2) | 2,812 | 1,909 | 11,682 | 11,234 | 15,106 | 12,575 |
| Non-performing loans and guarantees given (1) | 52 | 68 | 677 | 648 | 904 | 675 |
| Customer deposits under management (1) (3) | 4,622 | 2,845 | 12,129 | 11,097 | 15,850 | 12,250 |
| Off-balance sheet funds (1) (4) | 969 | 420 | 1,567 | 1,214 | 2,146 | 1,523 |
| Risk-weighted assets | 5,685 | 6,093 | 13,095 | 14,172 | 15,845 | 19,293 |
| Efficiency ratio (%) | 53.6 | 46.9 | 35.2 | 36.2 | 37.7 | 35.8 |
| NPL ratio (%) | 1.8 | 3.4 | 5.2 | 5.3 | 4.5 | 4.1 |
| NPL coverage ratio (%) | 241 | 161 | 113 | 98 | 101 | 96 |
| Cost of risk (%) | 3.24 | 4.22 | 2.64 | 1.67 | 2.13 | 1.45 |
- (1) Figures at constant exchange rates.
- (2) Excluding repos.
- (3) Excluding repos and including specific marketable debt securities.
- (4) Includes mutual funds and other off-balance sheet funds.
Unless expressly stated otherwise, all the comments below on rates of change, for both activity and results, will be given at constant exchange rates. These rates, together with the changes at current exchange rates, can be found in the attached tables of the financial statements and relevant business indicators.
Activity and results
The most relevant aspects related to the area's activity in 2020 were:
- Lending activity(performing loans under management) was 12.6% higher as of December 31, 2020 compared to the close of the previous year. The performance of the wholesale portfolio stands out (up 20.3% year-on-year), due to the greater drawdown of credit facilities by companies in response to the situation generated by the COVID-19 pandemic. The retail portfolio closed up compared to the end of 2019 (up 5.1%) following the upturn in the quarter (up 1.9%), mainly due to the evolution of credit cards and consumer loans (up 4.3% collectively). In terms of asset quality, the non-performing loan ratio stood at 4.4% while the NPL coverage ratio stood at 110%.
- On the funding side, the performance has been boosted by the measures taken by the different central banks to ensure liquidity in the respective financial systems in the region. As a result, deposits from customers under management increased by 23.3% throughout the year, mainly due to the evolution of demand deposits. Likewise, off-balance sheet funds grew by 20.3% throughout the year.
South America generated a cumulative net attributable profit of €446m in 2020, representing a year-on-year decline of 22.6% (down 38.2% at current exchange rates), mainly due to the increase in the impairment on financial assets in the first half of 2020 caused by the COVID-19 crisis. The cumulative impact of inflation in Argentina on the area's net attributable profit in 2020 stood at a loss of around €104m, compared to a cumulative loss of €98m at the end of December 2019.
The most notable aspects of the cumulative evolution of the income statement as of December 2020 are summarized below:
- Net interest income continued to grow at constant exchange rates (up 0.9%). At current exchange rates, the devaluation of the main currencies in the region weakened this positive performance.
- Decreased contribution from NTI (down 12.8% at constant exchange rates, down 29.3% at current exchange rates). This line includes the annual valuation in the last quarter of 2020 of the Bank's stake in Prisma Medios de Pago S.A. (hereinafter Prisma), the outcome of which was more positive than the 2019 annual valuation, in a comparison that also includes the capital gains in the first quarter of 2019.
- Operating expenses (up 2.8%) increased significantly below the inflation rate in the region.
- Increased requirements for impairment on financial assets (up 34.0%, up 11.3% at current exchange rates) mainly due to the extraordinary deterioration in the macroeconomic scenario resulting from the impact of COVID-19 and largely recorded in the first half of the year.
The evolution throughout 2020 for the business area’s most representative countries, Argentina, Colombia and Peru,, is summarized below:
Argentina
- Lending activity grew by 47.3% since December 2019 due to growth in commercial and credit card segments. Throughout the quarter, retail portfolios showed higher growth than wholesale portfolios as a result of lower activity caused by the pandemic. Greater credit card and consumer finance dynamism was also observed. There was a decrease in the NPL ratio, which stood at 1.8% as of December 31, 2020, from 3.4% at the end of December 2019, due to the reduction in non-performing loans. The NPL coverage ratio increased to 241%.
- On the total customers funds side, available liquidity meant that deposits from customers under management increased by 62.5% in 2020, with growth in both demand deposits and time deposits, the latter was favored by minimum returns on deposits in pesos established by the Central Bank of the Republic of Argentina. Off-balance sheet funds also increased significantly.
- Net attributable profit stood at €89m, with recurrent revenues performing well (up 8.0%) and a greater contribution as a result of the annual valuation on the remaining stake in Prisma. The year-on-year comparison is affected by the positive effect of the sale of the stake in Prisma and the increased need for impairment on financial assets in 2019, due to the rating downgrade and the situation in the country at the time.
Colombia
- Lending activity grew by 4.0% in 2020 due to the performance of retail portfolios (up 5.1% year-on-year), particularly consumer and mortgages, the latter supported by government incentives for non-social housing. In terms of asset quality, the NPL ratio and NPL coverage ratio improved to 5.2% and 113% respectively at the close of December 2020.
- Deposits from customers under management increased by 9.3% in 2020, driven by growth in demand deposits. Off-balance sheet funds continued their recovery after the withdrawals seen at the end of the first quarter of the year and closed 29.0% higher than the one reached at the end of December 2019. In the quarter, the search for more profitable investment alternatives by customers, in line with the bank's strategy of reducing financial costs, meant a reduction in deposits from customers (down 0.9%).
- The net attributable profit stood at €165m, with a year-on-year decrease of 28.9%. The strength of operating income is notable, which increased by 6.2% in 2020 thanks to higher income generation from net interest income and NTI, although there was a negative impact from the higher loan-loss provisioning due to the COVID-19 crisis.
Peru
- Lending activity was 20.1% higher than at the end of the 2019 financial year, mainly driven by the wholesale portfolio, as a result of the distribution of funds from the Plan Reactiva, which more than offset the decline still seen in credit cards as a result of the lower activity due to the pandemic. In terms of asset quality, as of December 31, 2020, an increase was recorded in the NPL ratio, which stood at 4.5%, due to the deterioration of certain refinanced loans, as well as other assets in the commercial, SMEs and retail portfolio segments. For its part, the NPL coverage ratio stood at 101%, higher than at the end of December 2019.
- Customer deposits under management increased by 29.4% during 2020, mainly due to the 53.4% growth in demand deposits driven by legislative measures that allowed pension plan participants to withdraw part of their funds as a relief measure to cope with the pandemic. Off-balance sheet funds increased by 40.9%.
- Net interest income fell compared to the previous year, due to the pressure on interest rates caused by the drop in official rates and government-backed loans at preferential rates, which are in addition to other customer relief measures such as interest-free deferral of repayments on credit cards. Net fees and commissions grew slightly (up 0.5%), influenced by reduced activity as a result of the pandemic, the temporary elimination of certain fees and commissions as a measure to support customers, and the increased use of digital channels. The upturn in operating expenses in the last quarter caused a growth in this line (up 1.1%) in the year, but below the inflation growth (up 2%). Greater impairment on financial assets was observed in the quarter as a result of rating adjustments, which were combined with provisions made mainly in the first half of the year as a result of the COVID-19 crisis and resulted in this line increasing by 70.2%. As a result, net attributable profit stood at €110m, 41.8% lower than in 2019.
Rest of Eurasia
Highlights
- Activity mainly affected by the loans amortizations made during the second half of the year.
- Contained risk indicators.
- Increased recurring income and good performance of NTI.
- Reduction of operating expenses.
FINANCIAL STATEMENTS AND RELEVANT BUSINESS INDICATORS (MILLIONS OF EUROS AND PERCENTAGE)
| Income statement | 2020 | ∆% | 2019 |
|---|---|---|---|
| Net interest income | 214 | 22.4 | 175 |
| Net fees and commissions | 150 | 8.2 | 139 |
| Net trading income | 137 | 4.4 | 131 |
| Other operating income and expenses | 9 | (4.8) | 9 |
| Gross income | 510 | 12.3 | 454 |
| Operating expenses | (285) | (2.7) | (293) |
| Personnel expenses | (135) | (6.3) | (144) |
| Other administrative expenses | (133) | 1.6 | (131) |
| Depreciation | (17) | (5.5) | (18) |
| Operating income | 225 | 39.8 | 161 |
| Impairment on financial assets not measured at fair value through profit or loss | (38) | n.s. | (4) |
| Provisions or reversal of provisions and other results | (2) | n.s. | 6 |
| Profit/(loss) before tax | 184 | 13.3 | 163 |
| Income tax | (48) | 33.3 | (36) |
| Profit/(loss) for the year | 137 | 7.6 | 127 |
| Non-controlling interests | - | - | - |
| Net attributable profit/(loss) | 137 | 7.6 | 127 |
| Balance sheets | 31-12-20 | ∆% | 31-12-19 |
|---|---|---|---|
| Cash, cash balances at central banks and other demand deposits | 285 | 15.3 | 247 |
| Financial assets designated at fair value | 492 | 3.0 | 477 |
| Of which: Loans and advances | - | - | - |
| Financial assets at amortized cost | 21,839 | (1.8) | 22,233 |
| Of which: Loans and advances to customers | 18,908 | (3.9) | 19,669 |
| Inter-area positions | - | - | - |
| Tangible assets | 65 | (9.5) | 72 |
| Other assets | 200 | (11.9) | 228 |
| Total assets/liabilities and equity | 22,881 | (1.6) | 23,257 |
| Financial liabilities held for trading and designated at fair value through profit or loss | 46 | (19.4) | 57 |
| Deposits from central banks and credit institutions | 858 | (17.4) | 1,039 |
| Deposits from customers | 4,578 | (2.8) | 4,708 |
| Debt certificates | 704 | (16.0) | 838 |
| Inter-area positions | 15,398 | 0.3 | 15,351 |
| Other liabilities | 419 | 4.9 | 399 |
| Economic capital allocated | 879 | 1.7 | 864 |
| Relevant business indicators | 31-12-20 | ∆% | 31-12-19 |
|---|---|---|---|
| Performing loans and advances to customers under management (1) | 18,906 | (3.8) | 19,663 |
| Non-performing loans | 296 | (15.3) | 350 |
| Customer deposits under management (1) | 4,578 | (2.8) | 4,708 |
| Off-balance sheet funds (2) | 569 | 13.8 | 500 |
| Risk-weighted assets | 18,249 | 1.4 | 17,989 |
| Efficiency ratio (%) | 56.0 | 64.6 | |
| NPL ratio (%) | 1.1 | 1.2 | |
| NPL coverage ratio (%) | 100 | 98 | |
| Cost of risk (%) | 0.18 | 0.02 |
(1) Excluding repos.
(2) Includes mutual funds, pension funds and other off-balance sheet funds.
Activity and results
The most relevant aspects of the activity and results in the area during 2020 were:
- Lending activity (performing loans under management) decreased in the last quarter of the year, mainly in the commercial segment in Europe (excluding Spain), which together with that of the previous quarter caused the 2020 balances in this business area to close below those recorded in the previous year (down 3.8%). The above is explained by both the amortizations made during the second half of the year, as customers did not have to use all the liquidity initially available to cope with the situation generated by COVID-19, and by the reopening of the wholesale funding markets in the third quarter of 2020, as a funding alternative.
- Credit risk indicators remained stable compared to the end of 2019: the NPL ratio and NPL coverage ratio closed at 1.1% and 100%, respectively, as of December 31, 2020.
- Customer deposits under management fell by 2.8%, due to the decrease in time deposits.
- In terms of results, double-digit increase of 16.1% year-on-year in the most recurring revenues due to the positive performance of both net interest income (up 22.4% year-on-year) and net fees and commissions (up 8.2% year-on-year), supported by CIB activity.
- The NTI line increased (up 4.4% year-on-year) due to the good performance of customer activity and favorable management of market volatility.
- Reduction of operating expenses (down 2.7% year-on-year).
- The line of impairment on financial assets registered a release of €10m in the last quarter of the year and closed the year at €-38m, well above the €-4m recorded 12 months earlier, mainly as a consequence of the deterioration of specific customers in the wholesale portfolio. As a result, the cumulative cost of risk of the area at the end of the year stood at 0.18%.
- As a result, the area's cumulative net attributable profit at the end of December 2020 was €137m (up 7.6% year-on-year).
Corporate Center
FINANCIAL STATEMENTS (MILLIONS OF EUROS AND PERCENTAGE)
| Income statement | 2020 | ∆% | 2019 |
|---|---|---|---|
| Net interest income | (149) | (36.0) | (233) |
| Net fees and commissions | (59) | (18.6) | (73) |
| Net trading income | 104 | n.s. | (54) |
| Other operating income and expenses | 47 | 119.8 | 21 |
| Gross income | (57) | (83.1) | (339) |
| Operating expenses | (819) | (14.3) | (955) |
| Personnel expenses | (494) | (16.4) | (591) |
| Other administrative expenses | (131) | (24.5) | (173) |
| Depreciation | (194) | 1.7 | (190) |
| Operating income | (876) | (32.3) | (1,294) |
| Impairment on financial assets not measured at fair value through profit or loss | 4 | n.s. | (0) |
| Provisions or reversal of provisions and other results | (289) | 77.1 | (163) |
| Profit/(loss) before tax | (1,160) | (20.4) | (1,457) |
| Income tax | 305 | 18.1 | 258 |
| Profit/(loss) after tax | (856) | (28.6) | (1,199) |
| Goodwill impairment in the United States and corporate operations (1) | (1,780) | 35.0 | (1,318) |
| Profit/(loss) for the year | (2,635) | 4.7 | (2,517) |
| Non-controlling interests | 0 | (61.3) | 0 |
| Net attributable profit/(loss) | (2,635) | 4.7 | (2,517) |
| Net attributable profit/(loss) excluding the goodwill impairment in the United States and corporate operations (1) | (856) | (28.6) | (1,199) |
- (1) Include the net capital gain from the sale to Allianz the half plus one share of the company created to jointly develop the non-life insurance business in Spain, excluding the health insurance line.
| Balance sheets | 31-12-20 | ∆% | 31-12-19 |
|---|---|---|---|
| Cash, cash balances at central banks and other demand deposits | 818 | (2.2) | 836 |
| Financial assets designated at fair value | 1,457 | (40.7) | 2,458 |
| Of which: Loans and advances | - | - | - |
| Financial assets at amortized cost | 2,095 | (15.5) | 2,480 |
| Of which: Loans and advances to customers | 503 | (38.1) | 813 |
| Inter-area positions | 17,536 | (18.4) | 21,477 |
| Tangible assets | 2,063 | (7.9) | 2,240 |
| Other assets | 17,705 | (13.2) | 20,394 |
| Total assets/liabilities and equity | 41,674 | (16.5) | 49,886 |
| Financial liabilities held for trading and designated at fair value through profit or loss | 20 | 48.3 | 14 |
| Deposits from central banks and credit institutions | 820 | 14.3 | 718 |
| Deposits from customers | 363 | 17.8 | 308 |
| Debt certificates | 8,179 | 5.4 | 7,764 |
| Inter-area positions | - | - | - |
| Other liabilities | 7,266 | (28.4) | 10,148 |
| Economic capital allocated | (24,995) | 4.2 | (23,989) |
| Total equity | 50,020 | (8.9) | 54,925 |
The Corporate Center registered a cumulative net attributable loss of €2,635m in 2020, due to the €2,084m goodwill impairment in the United States in the first quarter of 2020, which was fundamentally caused by the negative impact of the macroeconomic scenario adjustment due to the COVID-19 pandemic. This attributable loss also includes the result of corporate operations for the net capital gain, of €304m, recorded in the last quarter of 2020 due to the materialization of the agreement with Allianz. For its part, 2019 reflected the goodwill impairment in the United States that amounted to €-1,318m euros at the net attributable loss level, mainly due to the evolution of interest rates in the country and the slowdown in the economy in the fourth quarter of 2019. The Corporate Center’s net attributable loss, excluding the goodwill impairment in the United States and the result of corporate operations in 2020, stood at €-856m, 28.6% better than in 2019, equally excluding the goodwill impairment in the United States.
The most relevant aspects of the income statement evolution are:
- The net interest income increased by 36.0% due to the lower financing costs.
- The NTI recorded €104m, mainly from gains in foreign-exchange rate hedging, which compares very positively to the €-54m registered in 2019.
- Other operating income and expenses include mainly the dividends from Telefónica, S.A., as well as the income from the consolidated companies accounted for by the equity method.
- Containment of the operating expenses, which decreased by 14.3% year-on-year, both for personnel expenses (mainly variable remuneration) and for general expenses.