
Group financial information
BBVA Group main data
BBVA GROUP MAIN DATA (CONSOLIDATED FIGURES)
| 31-12-20 | ∆% | 31-12-19 | 31-12-18 | |
|---|---|---|---|---|
| Balance sheet (millions of euros) | ||||
| Total assets | 736,176 | 5.5 | 697,737 | 675,675 |
| Loans and advances to customers (gross) | 378,139 | (4.5) | 396,012 | 386,225 |
| Deposits from customers | 409,122 | 6.1 | 385,686 | 375,970 |
| Total customer funds | 512,068 | 3.8 | 493,488 | 474,085 |
| Total equity | 50,020 | (8.9) | 54,925 | 52,874 |
| Income statement (millions of euros) | ||||
| Net interest income | 16,801 | (7.3) | 18,124 | 17,511 |
| Gross income | 22,974 | (6.1) | 24,463 | 23,667 |
| Operating income | 12,219 | (2.7) | 12,561 | 11,965 |
| Net attributable profit/(loss) | 1,305 | (62.9) | 3,512 | 5,400 |
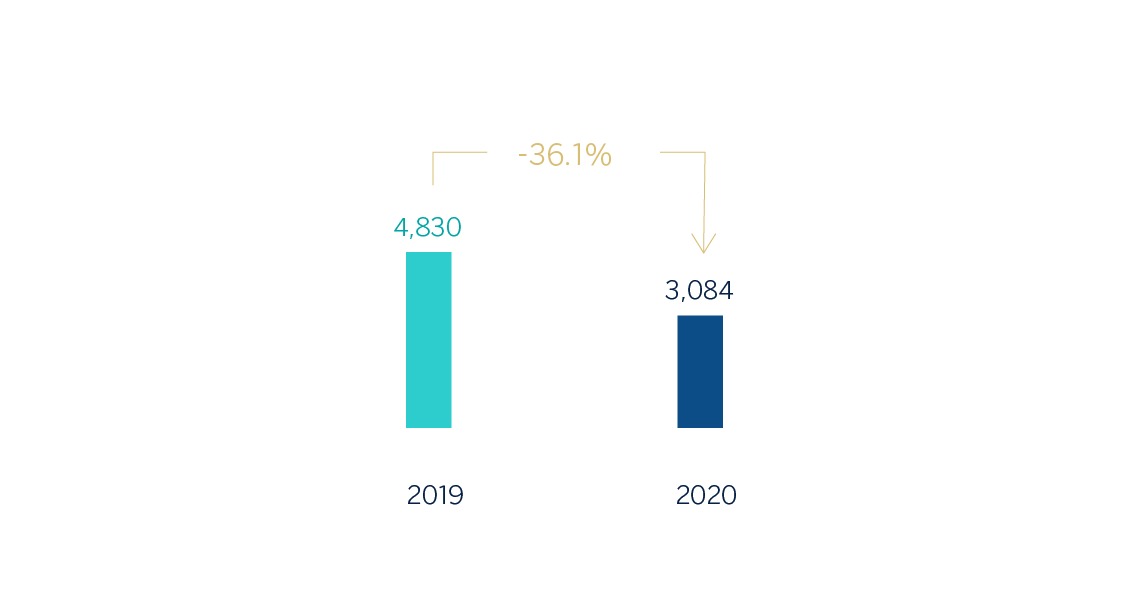
| Adjusted net attributable profit or (loss) (1) | 3,084 | (36.1) | 4,830 | 4,703 |
| The BBVA share and share performance ratios | ||||
| Number of shares (million) | 6,668 | - | 6,668 | 6,668 |
| Share price (euros) | 4.04 | (19.0) | 4.98 | 4.64 |
| Earning per share (euros) (2) | 0.14 | (70.4) | 0.47 | 0.75 |
| Adjusted earning per share (euros) (1) (2) | 0.41 | (38.9) | 0.66 | 0.64 |
| Book value per share (euros) | 6.70 | (8.5) | 7.32 | 7.12 |
| Tangible book value per share (euros) | 6.05 | (3.6) | 6.27 | 5.86 |
| Market capitalization (millions of euros) | 26,905 | (19.0) | 33,226 | 30,909 |
| Yield (dividend/price; %) (3) | 4.0 | 5.2 | 5.4 | |
| Significant ratios (%) | ||||
| ROE (net attributable profit or (loss)/average shareholders' funds +/- average accumulated other comprehensive income) (1) | 6.9 | 9.9 | 10.2 | |
| ROTE (net attributable profit or (loss)/average shareholders' funds excluding average intangible assets +/- average accumulated other comprehensive income) (1) | 7.8 | 11.9 | 12.5 | |
| ROA (Profit or (loss) for the year/average total assets) (1) | 0.53 | 0.82 | 0.81 | |
| RORWA (Profit or (loss) for the year/average risk-weighted assets - RWA) (1) | 1.07 | 1.57 | 1.56 | |
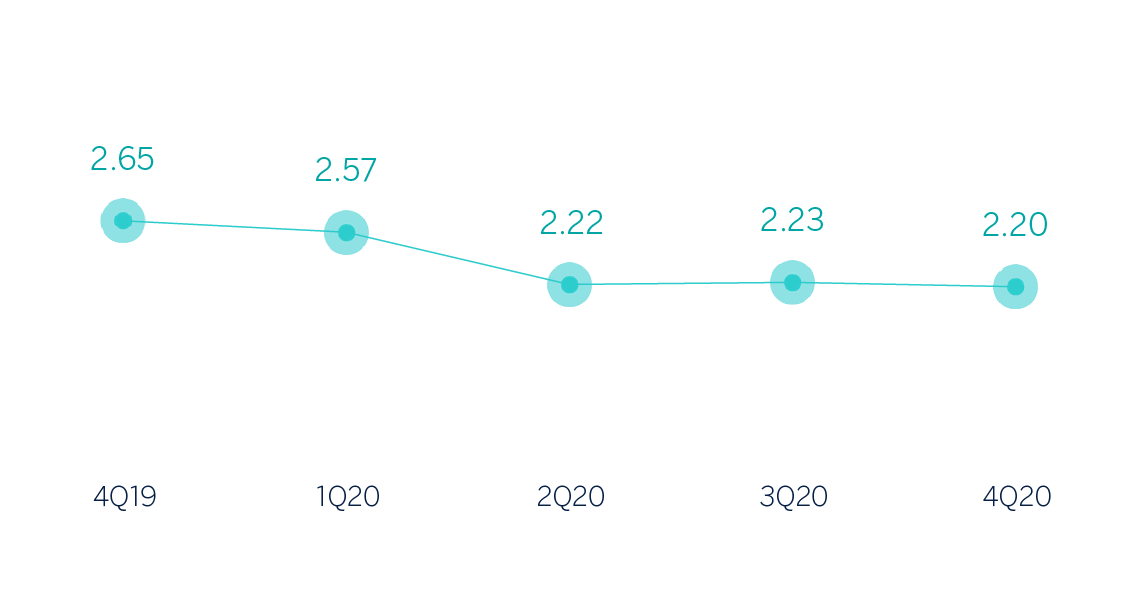
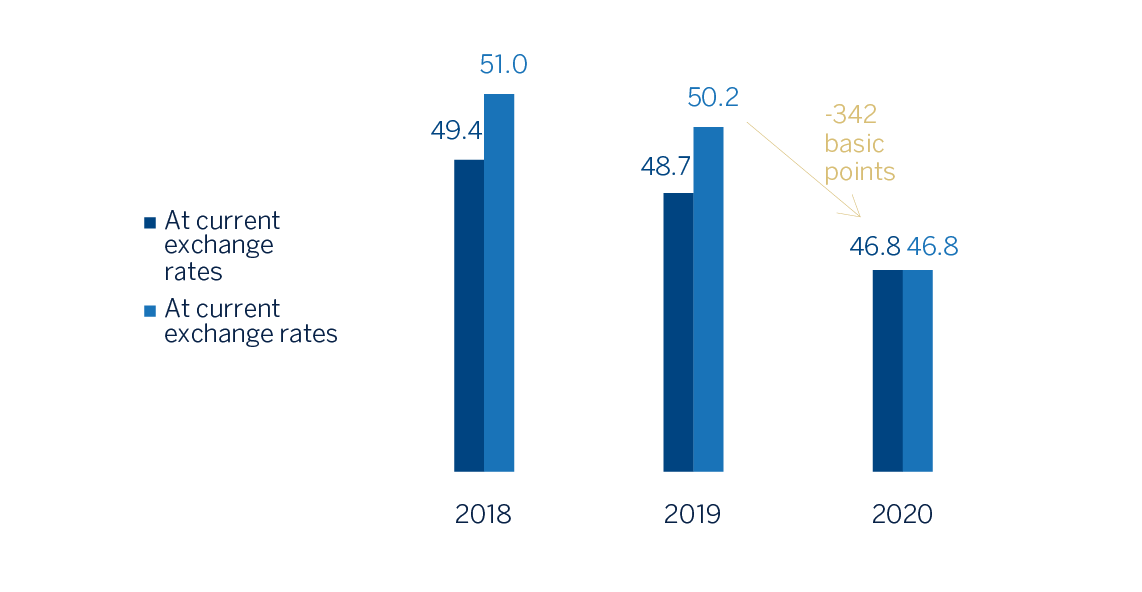
| Efficiency ratio | 46.8 | 48.7 | 49.4 | |
| Cost of risk | 1.51 | 1.02 | 0.99 | |
| NPL ratio | 4.0 | 3.8 | 3.9 | |
| NPL coverage ratio | 81 | 77 | 73 | |
| Capital adequacy ratios (%) | ||||
| CET1 fully-loaded | 11.73 | 11.74 | 11.34 | |
| CET1 phased-in (4) | 12.15 | 11.98 | 11.58 | |
| Total ratio phased-in (4) | 16.46 | 15.92 | 15.71 | |
| Other information | ||||
| Number of clients (million) | 80.7 | 3.6 | 77.9 | 74.6 |
| Number of shareholders | 879,226 | 0.6 | 874,148 | 902,708 |
| Number of employees | 123,174 | (3.0) | 126,973 | 125,627 |
| Number of branches | 7,432 | (4.0) | 7,744 | 7,963 |
| Number of ATMs | 31,000 | (5.1) | 32,658 | 32,502 |
- General note: as a result of the interpretation issued by the International Financial Reporting Standards Interpretations Committee (IFRIC) regarding the collecting of interests of written-off financial assets for the purpose of IFRS 9, those collections are presented as reduction of the credit allowances and not as a higher interest income, recognition method applied until December 2019. Therefore, and in order to make the information comparable, the information of the 2019 and 2018 income statements has been restated.
- (1) Excluding the net capital gain from the bancassurance transaction in 2020 and BBVA Chile in 2018 and the goodwill impairments in the United States registered in the first quarter of 2020 and the last quarter of 2019.
- (2) Adjusted by additional Tier 1 instrument remuneration.
- (3) Calculated by dividing shareholder remuneration over the last twelve months by the closing price of the period.
- (4) Phased-in ratios include the temporary treatment on the impact of IFRS 9, calculated in accordance with Article 473 bis amendments of the Capital Requirements Regulation (CRR), introduced by the Regulation (EU) 2020/873.
Highlights
Results
The BBVA Group generated a net attributable profit of €1,305m during 2020, in a year marked by several factors that influenced the income statement:
- First, the outbreak of the COVID-19 pandemic, the main impacts of which were increased impairment on financial assets and higher provisions.
- Secondly, the goodwill impairment in the United States in the first quarter of 2020, amounting to €2,084m, also as a result of the pandemic. In relation to this business area, the sale agreement reached by the Group is detailed later in this section. It should be noted that the Group's results in this report are shown from a management’s business perspective, that is, with the United States business area in continuity. Financial information is being presented to the senior management of the Group with this management’s business perspective, and this report includes a conciliation between the management’s business perspective and the Consolidated Financial Statements of the Group.
- Lastly, and to a lesser extent, the execution in the fourth quarter of 2020 of the bancassurance agreement reached with Allianz in Spain, once all required authorizations were received, which has represented a net capital gain of €304m, registered in the line of corporate operations of the Group.
Despite the complexity of the environment, the operating income registered an 11.7% year-on-year increase at constant exchange rates at the end of 2020, driven by the net trading income (NTI) and the operating expenses reduction.
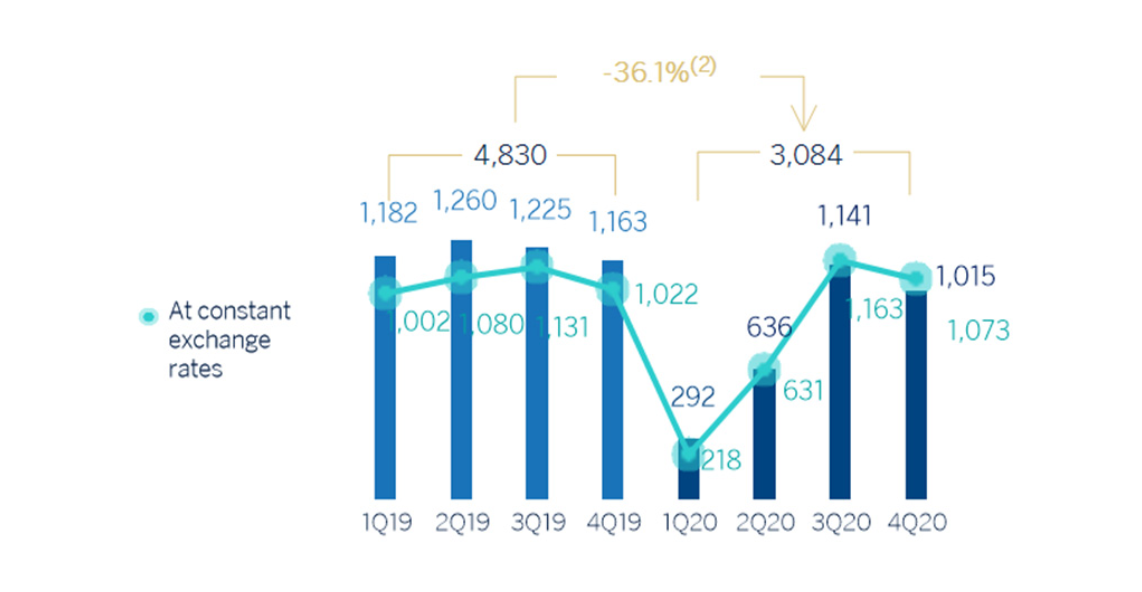
The Group’s adjusted net attributable profit, excluding the goodwill impairment in the United States and the results from corporate operations in 2020, stood at €3,084m, that is a 36.1% below the 2019 result, also excluding the goodwill impairment in the United States in the last quarter of 2019
NET ATTRIBUTABLE PROFIT (1)(MILLIONS OF EUROS)
(1) Excluding the goodwill impairment in the United States, registered in 2019 and 2020 and the net capital gain from the bancassurance operation in 2020.
NET ATTRIBUTABLE PROFIT BREAKDOWN (1) (PERCENTAGE. 2020)
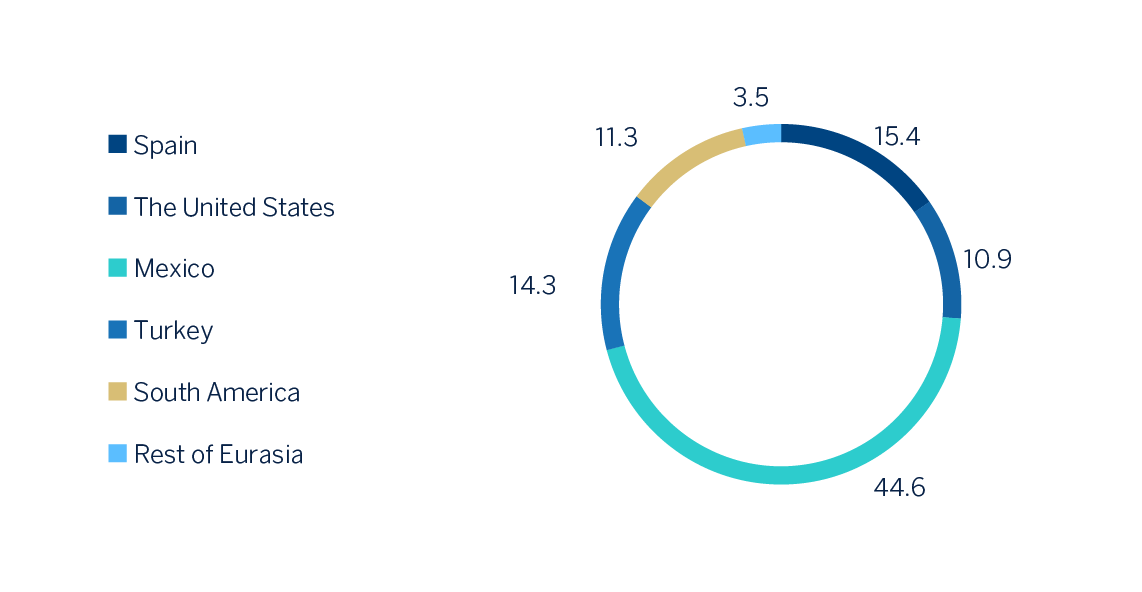
(1) Excludes the Corporate Center.
Balance sheet and business activity
- The figure for loans and advances to customers (gross) fell by 4.5% compared to the end of the previous year, with deleveraging in all portfolios in the last quarter of 2020, with the exception of consumer and credit cards.
- Customer funds grew by 3.8% during 2020, mainly as a result of customers placing larger liquidity in demand deposits.
Liquidity
- The availability of substantial liquidity buffers in each of the geographical areas in which the BBVA Group operates and their management, have allowed internal and regulatory ratios to be maintained well above the minimums required.
Solvency
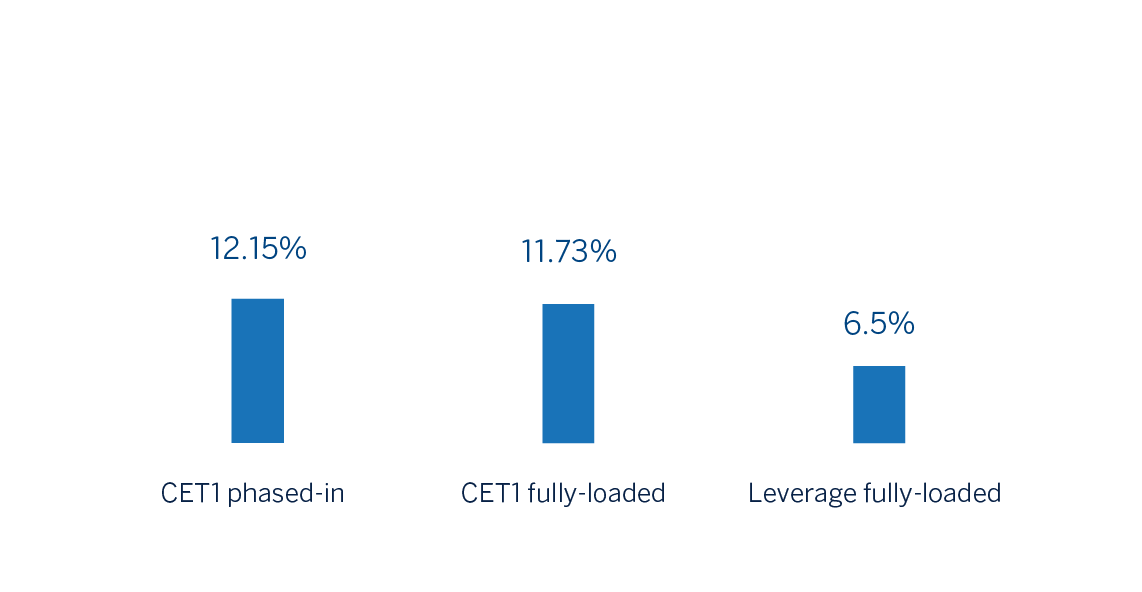
- From 2021 onwards the BBVA Group sets the target to keep the CET1 fully-loaded ratio between 11.5%-12.0%, increasing the distance to the minimum requirement (currently at 8.59%) to 291-341 basis points. As of December 31, 2020, the CET1 fully-loaded ratio stood at 11.73%, already within the target range. This ratio does not include the positive impact of the sale of BBVA USA and other companies in the United States with activities related to its banking business, which according to the current estimate and taking by reference the capital base in 2020, would place the CET1 fully-loaded ratio at 14.58%. Additionally, it does not include the effect of the closing of the sale of BBVA Paraguay, which would have a positive impact of approximately +6 basis points, which will be registered in the first quarter of 2021.
CAPITAL AND LEVERAGE RATIOS (PERCENTAGE AS OF 31-12-20)
Shareholder remuneration
- Regarding shareholder remuneration, the European Central Bank (hereinafter ECB) approved on December 15, 2020, given the persistent uncertainty about the economic impact of the COVID-19 pandemic, a new recommendation which will be maintained until the end of September 2021 and repeals the previous recommendation. The decision continues the line of recommending to the credit institutions exercise extreme prudence in the distribution of profits, either through the payment of dividends or through conducting share buy-backs, remaining this remuneration below 15% of the cumulative profit for 2019 and 2020 financial years, and in any case, not higher than 20 basis points of the Common Equity Tier 1 (CET1).
- Following the ECB recommendation, it is expected to be proposed for the consideration of the competent government bodies the intention to pay out €0.059 (gross) per share to its shareholders. The maximum amount distributed will be approximately €393m corresponding to the 15% consolidated profit for 2020 (excluding among others, the goodwill impairment in the United States, the capital gain from corporate operations and the remuneration of additional Tier 1 capital-AT1-), following the recommendation of the ECB.
Risk management
- The calculation of expected credit losses accumulated in 2020 incorporates:
- The update of the forward-looking information in the IFRS 9 models in order to reflect the circumstances created by the COVID-19 pandemic.
- The granting of relief measures in the form of temporary payment deferrals for customers affected by the pandemic, as well as the option to grant lending with a public guarantee facility. In relation to said payments deferrals and in order to mitigate as much as possible the impact of these measures for the Group, due to the high concentration in the time of their maturities, an anticipation plan has been worked out.
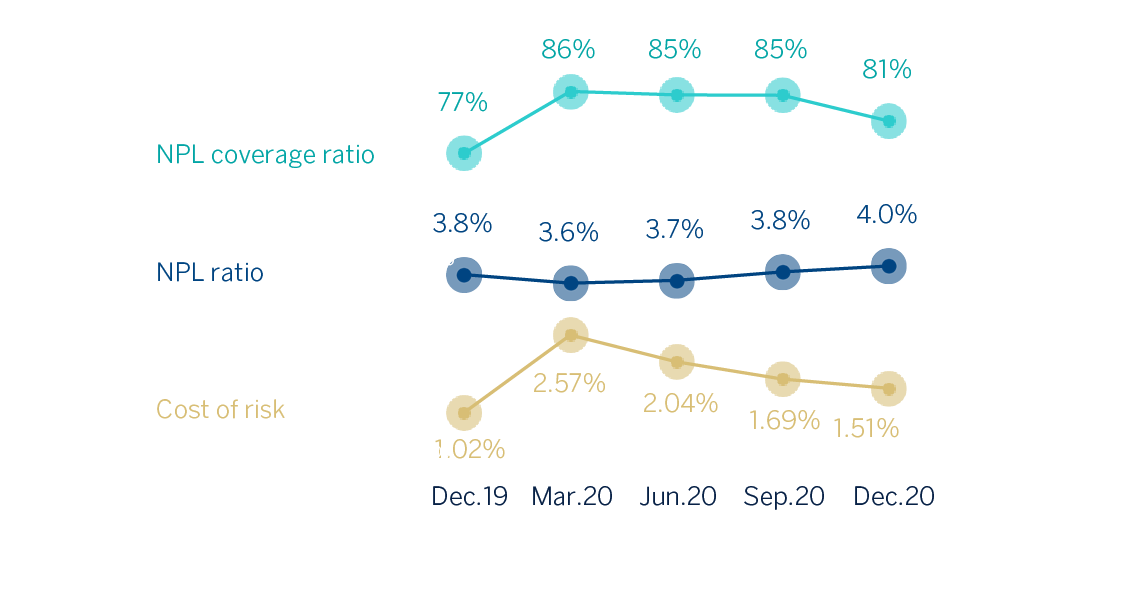
- The behaviour of the main credit risk indicators of the Group at the end of 2020 were:
- The NPL ratio stood at 4.0% at the end of December 2020, 17 basis points above the end of the previous year.
- The NPL coverage ratio closed at 81%, with a relevant improvement compared to the end of 2019.
- The cumulative cost of risk at the end of December stood at 1.51%, after the rebound experienced in the first quarter of 2020 and the subsequent correction throughout the year.
NPL AND NPL COVERAGE RATIOS AND COST OF RISK (PERCENTAGE)
Agreement for the sale of the United States
The BBVA Group announced, on November 16, 2020, that it has reached an agreement with The PNC Financial Services Group, Inc. (hereinafter PNC) for the sale of 100% of the shareholders' equity of its subsidiary BBVA USA Bancshares, Inc., which in turn owns, all of the shareholders' equity of the bank BBVA USA, as well as other companies of the BBVA Group in the United States with activities related to this banking business. The agreement reached does not include the sale of the institutional business of the BBVA Group developed through its broker dealer BBVA Securities Inc. or the participation in Propel Venture Partners US Fund I, L.P. Likewise, BBVA will continue to develop the wholesale business that it currently conducts through its New York branch. The price of the transaction amounts to aproximately USD 11,600m, which will be paid entirely in cash. It is estimated that the operation will generate a positive impact on the CET1 fully-loaded ratio of the BBVA Group of approximately 294 basis points and a net of taxes attributable profit of approximately €580m (calculated with a rate of 1.29 euros/U.S dollar) of which at the end of the financial year 2020, are already collected approximately €300m (corresponding to the results generated by the companies for sale from the signing of the transaction to the end of the year, and that there are recorded in the consolidated Financial Statements on 31 December, 2020) and approximately 9 basis points of positive impact in the CET1 fully-loaded ratio. As usual, the closing of the operation is subject to obtaining regulatory authorizations from the competent authorities and it is estimated that it will take place in mid-2021.
Sale of BBVA Paraguay
The BBVA Group announced on 22 January 2021 that, once the regulatory authorizations were obtained, it has completed the sale of its direct and indirect stake of 100% of the Shareholders' equity of the Banco Bilbao Vizcaya Argentaria Paraguay S.A. (hereinafter, BBVA Paraguay) to the Banco GNB Paraguay S.A. The total amount received after the closing of the operation amounts to approximately USD250m and has generated a capital loss, net of taxes, of approximately €9m. Likewise, this transaction will have a positive impact on BBVA Group’s Common Equity Tier 1 (fully-loaded) of approximately +6 basis points. This impact will be reflected in the first quarter of 2021’s capital base of BBVA Group.
Results
The BBVA Group generated a net attributable profit of €1,305m during 2020, in a year marked by several factors that influenced the income statement:
- First, the outbreak of the COVID-19 pandemic, the main impacts of which were the increased impairment on financial assets and higher provisions.
- Secondly, the goodwill impairment in the United States recorded in the first quarter of 2020, amounting to €2,084m, also as a result of the pandemic.
- Lastly, and to a lesser extent, the execution of the agreement reached with Allianz, once all required authorizations were received, which had a net capital gain of €304m.
CONSOLIDATED INCOME STATEMENT: QUARTERLY EVOLUTION (MILLIONS OF EUROS)
| 2020 | 2019 | |||||||
|---|---|---|---|---|---|---|---|---|
| 4Q | 3Q | 2Q | 1Q | 4Q | 3Q | 2Q | 1Q | |
| Net interest income | 4,038 | 4,109 | 4,097 | 4,556 | 4,709 | 4,473 | 4,544 | 4,398 |
| Net fees and commissions | 1,173 | 1,143 | 1,043 | 1,258 | 1,290 | 1,273 | 1,256 | 1,214 |
| Net trading income | 213 | 372 | 512 | 594 | 490 | 351 | 116 | 426 |
| Other operating income and expenses | (157) | 38 | (91) | 75 | (89) | 22 | (18) | 8 |
| Gross income | 5,266 | 5,663 | 5,561 | 6,484 | 6,400 | 6,120 | 5,897 | 6,046 |
| Operating expenses | (2,674) | (2,570) | (2,594) | (2,918) | (3,082) | (2,946) | (2,952) | (2,922) |
| Personnel expenses | (1,420) | (1,356) | (1,342) | (1,532) | (1,637) | (1,572) | (1,578) | (1,553) |
| Other administrative expenses | (892) | (848) | (884) | (988) | (1,039) | (971) | (976) | (977) |
| Depreciation | (362) | (366) | (369) | (397) | (406) | (403) | (398) | (392) |
| Operating income | 2,593 | 3,093 | 2,967 | 3,566 | 3,317 | 3,174 | 2,945 | 3,124 |
| Impairment on financial assets not measured at fair value through profit or loss | (834) | (928) | (1,571) | (2,575) | (1,169) | (1,172) | (731) | (1,001) |
| Provisions or reversal of provisions | (144) | (60) | (228) | (312) | (243) | (113) | (117) | (144) |
| Other gains (losses) | (83) | (128) | (101) | (29) | (126) | (4) | (3) | (22) |
| Profit/(loss) before tax | 1,532 | 1,978 | 1,066 | 649 | 1,778 | 1,886 | 2,095 | 1,957 |
| Income tax | (407) | (524) | (269) | (186) | (430) | (488) | (595) | (541) |
| Profit/(loss) after tax | 1,125 | 1,454 | 798 | 463 | 1,349 | 1,398 | 1,500 | 1,416 |
| Goodwill impairment in the United States and corporate operations (1) | 304 | - | - | (2,084) | (1,318) | - | - | - |
| Profit/(loss) for the year | 1,430 | 1,454 | 798 | (1,621) | 31 | 1,398 | 1,500 | 1,416 |
| Non-controlling interests | (110) | (312) | (162) | (172) | (186) | (173) | (241) | (234) |
| Net attributable profit/(loss) | 1,320 | 1,141 | 636 | (1,792) | (155) | 1,225 | 1,260 | 1,182 |
| Earning per share (euros) (2) | 0.18 | 0.16 | 0.08 | (0.29) | (0.04) | 0.17 | 0.17 | 0.16 |
| Net attributable profit/(loss) excluding the goodwill impairment in the United States and corporate operations (1) | 1,015 | 1,141 | 636 | 292 | 1,163 | 1,225 | 1,260 | 1,182 |
| Earning per share excluding the goodwill impairment in the United States and corporate operations (euros) (1) (2) | 0.14 | 0.16 | 0.08 | 0.03 | 0.16 | 0.17 | 0.17 | 0.16 |
- General note: as a result of the interpretation issued by the International Financial Reporting Standards Interpretations Committee (IFRIC) regarding the collecting of interests of written-off financial assets for the purpose of IFRS 9, those collections are presented as reduction of the credit allowances and not as a higher interest income, recognition method applied until December 2019. Therefore, and in order to make the information comparable, the quarterly information of the 2019 income statements has been restated.
- (1) Include the net capital gain from the sale to Allianz the half plus one share of the company created to jointly develop the non-life insurance business in Spain, excluding the health insurance line.
- (2) Adjusted by additional Tier 1 instrument remuneration.
CONSOLIDATED INCOME STATEMENT (MILLIONS OF EUROS)
| 2020 | ∆% | ∆ % at constant exchange rates |
2019 | |
|---|---|---|---|---|
| Net interest income | 16,801 | (7.3) | 3.6 | 18,124 |
| Net fees and commissions | 4,616 | (8.3) | (0.4) | 5,033 |
| Net trading income | 1,692 | 22.3 | 37.6 | 1,383 |
| Other operating income and expenses | (135) | 76.2 | 46.3 | (77) |
| Gross income | 22,974 | (6.1) | 4.5 | 24,463 |
| Operating expenses | (10,755) | (9.6) | (2.6) | (11,902) |
| Personnel expenses | (5,650) | (10.9) | (4.4) | (6,340) |
| Other administrative expenses | (3,612) | (8.9) | (0.8) | (3,963) |
| Depreciation | (1,494) | (6.6) | 0.0 | (1,599) |
| Operating income | 12,219 | (2.7) | 11.7 | 12,561 |
| Impairment on financial assets not measured at fair value through profit or loss | (5,908) | 45.1 | 67.3 | (4,073) |
| Provisions or reversal of provisions | (744) | 20.7 | 33.0 | (617) |
| Other gains (losses) | (341) | 119.4 | 117.0 | (155) |
| Profit/(loss) before tax | 5,225 | (32.3) | (21.9) | 7,716 |
| Income tax | (1,385) | (32.5) | (22.4) | (2,053) |
| Profit/(loss) after tax | 3,840 | (32.2) | (21.7) | 5,663 |
| Goodwill impairment in the United States and corporate operations (1) | (1,780) | 35.0 | 35.0 | (1,318) |
| Profit/(loss) for the year | 2,060 | (52.6) | (42.6) | 4,345 |
| Non-controlling interests | (756) | (9.3) | 13.0 | (833) |
| Net attributable profit/(loss) | 1,305 | (62.9) | (55.3) | 3,512 |
| Earning per share (euros) (2) | 0.14 | 0.47 | ||
| Net attributable profit/(loss) excluding the goodwill impairment in the United States and corporate operations (1) | 3,084 | (36.1) | (27.2) | 4,830 |
| Earning per share excluding the goodwill impairment in the United States and corporate operations (euros) (1) (2) | 0.41 | 0.66 |
- General note: as a result of the interpretation issued by the International Financial Reporting Standards Interpretations Committee (IFRIC) regarding the collecting of interests of written-off financial assets for the purpose of IFRS 9, those collections are presented as reduction of the credit allowances and not as a higher interest income, recognition method applied until December 2019. Therefore, and in order to make the information comparable, the information of the 2019 income statements has been restated.
- (1) Include the net capital gain from the sale to Allianz the half plus one share of the company created to jointly develop the non-life insurance business in Spain, excluding the health insurance line.
- (2) Adjusted by additional Tier 1 instrument remuneration.
Unless expressly indicated otherwise, to better understand the changes under the main headings of the Group's income statement, the year-on-year percentage changes provided below refer to constant exchange rates.
Gross income
Gross income grew 4.5% year-on-year, supported by the favorable evolution of net interest income and NTI, which offset the flat performance of fees and commissions and a greater negative impact of the other operating income and expenses line compared to 2019.
GROSS INCOME (MILLIONS OF EUROS)
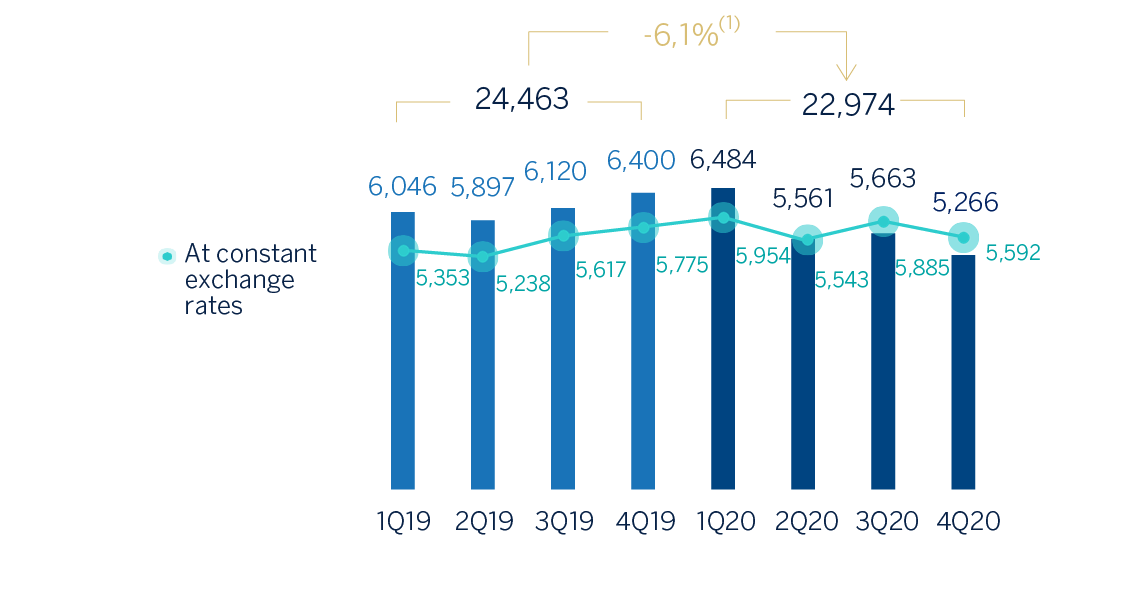
(1) At constant exchange rates: +4.5%.
Net interest income grew by 3.6% year-on-year, supported by the good performance, mainly, from Turkey and the Rest of Eurasia and, to a lesser extent, South America, which offset the smaller contribution from the United States and Mexico, as a result of the cuts in the benchmark interest rates by the banking authorities in these countries. Spain was also affected by an environment of falling rates and showed flat performance.
Net fees and commissions were affected by the lower activity as a result of the pandemic. The areas that showed year-on-year reductions were Mexico and Turkey; the latter was also affected by changes in regulations on fees and commissions charged, which have been in application since March 2020. In Spain, the United States, Rest of Eurasia and South America, the net fees and commissions showed year-on-year increase, despite not charging certain fees and commissions as a measure to support customers during the worst moments of the pandemic.
NET INTEREST INCOME/ATAS (PERCENTAGE)
NET INTEREST INCOME PLUS NET FEES AND COMMISSIONS (MILLIONS OF EUROS)
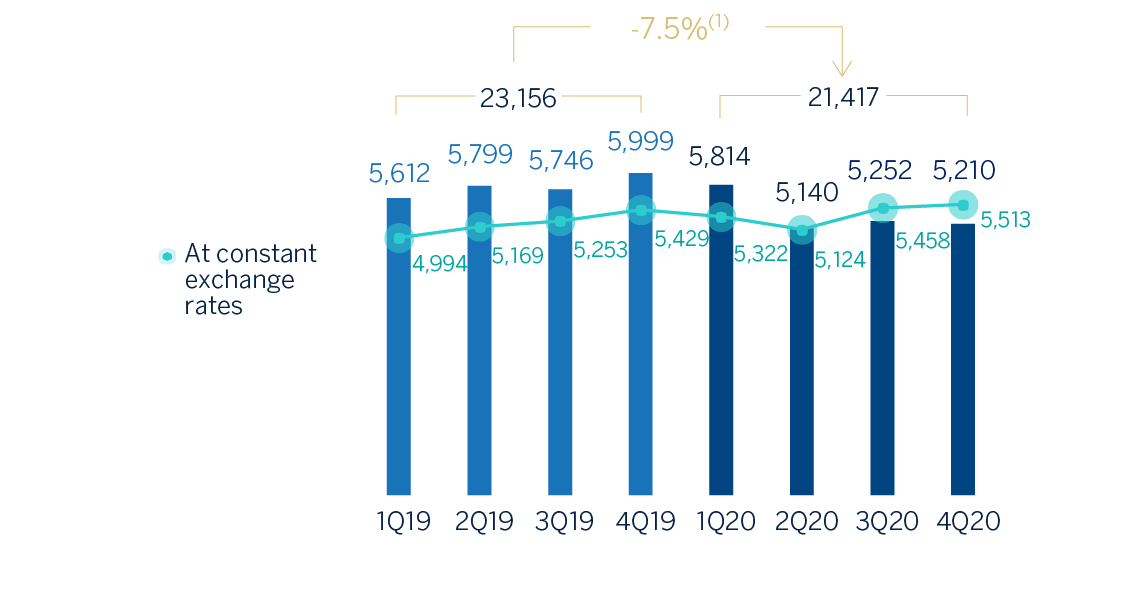
(1) At constant exchange rates: +2.7%.
The NTI was up 37.6% year-on-year, primarily due to the exchange rate hedging gains, recorded in the Corporate Center and the increase in the results generated throughout the year by all the business areas, except for South America, due to the positive effect from selling the stake in Prisma Medios de Pago S.A. on the results of the previous year, and except for Spain, where the negative results generated in the fourth quarter hindered positive evolution throughout the year.
The other operating income and expenses line posted €-135m in 2020 compared to the €-77m posted 12 months earlier. This unfavorable evolution is due to a lower contribution by the insurance business in Spain and Mexico, as well as BBVA's increased contributions to the public bank deposit protection schemes in said countries. Both effects offset the positive impact of Argentina's lower hyperinflation adjustment.
Operating income
Operating expenses fell by 2.6% year-on-year as a result of the containment plans implemented by all business areas and also due to the lesser execution of some discretionary expenses since the beginning of the pandemic. The expenses reduction is remarkable in Spain and the Corporate Center.
OPERATING EXPENSES (MILLIONS OF EUROS)
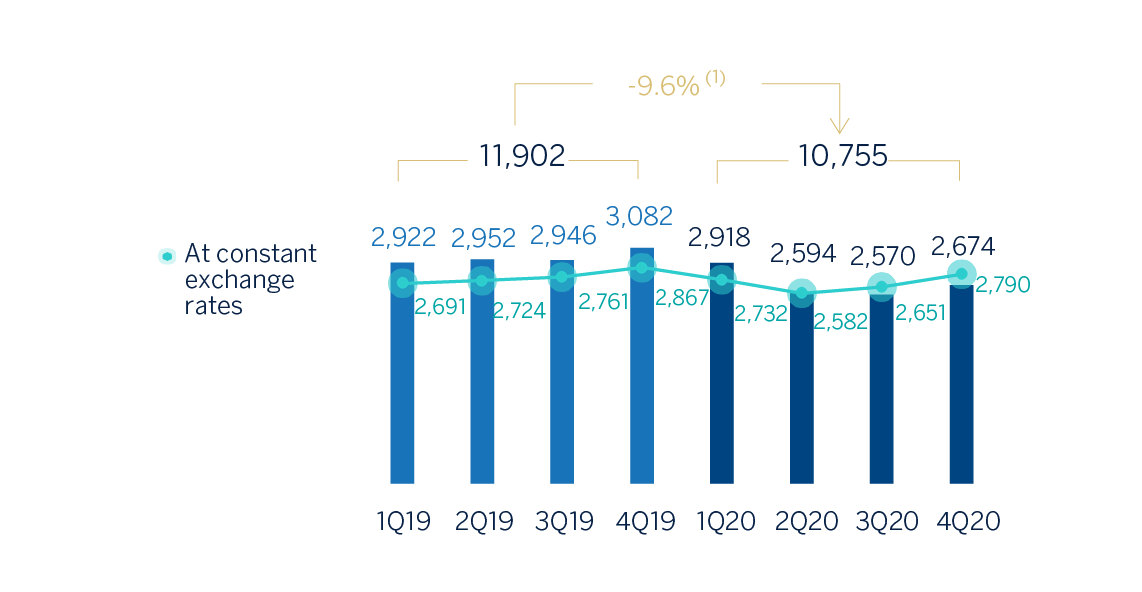
(1) At constant exchange rates: +2.6%.
As a result, the efficiency ratio stood at 46.8% as of December 31, 2020, significantly below the level recorded one year earlier (50.2%), and operating income recorded a year-on-year growth of 11.7%.
EFFICIENCY RATIO (PERCENTAGE)
OPERATING INCOME (MILLIONS OF EUROS)
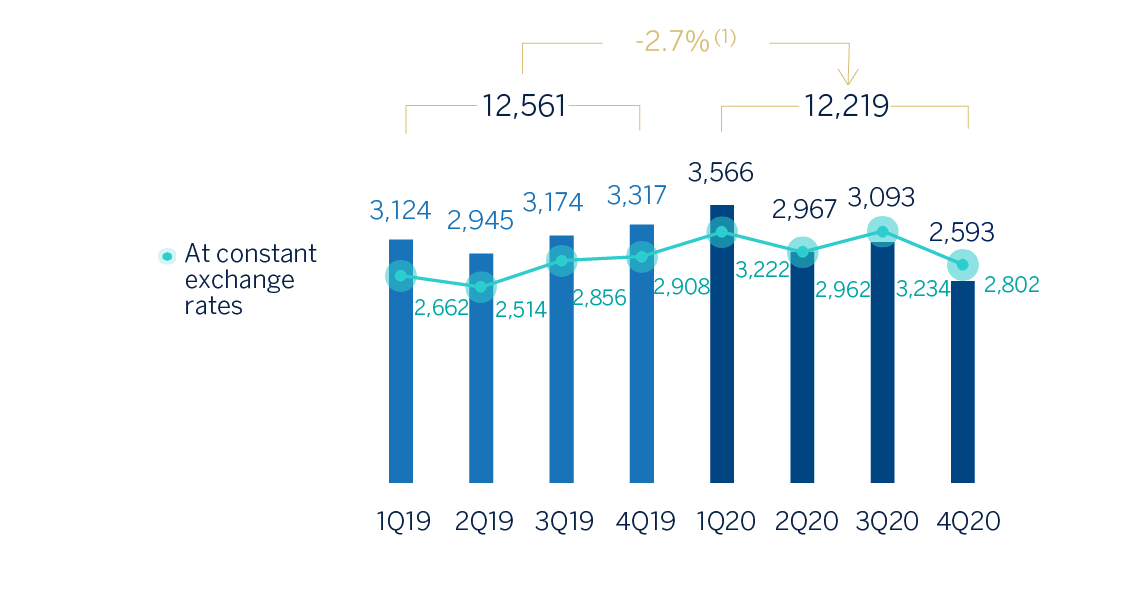
(1) At constant exchange rates: +11.7%.
Provisions and other
The impairment on financial assets not measured at fair value through profit and loss (impairment on financial assets) closed December 67.3% above the figure recorded in the previous year, as a result of the negative impacts of COVID-19, mainly due to the worsening macroeconomic scenario.
IMPAIRMENT ON FINANCIAL ASSETS (Millions of Euros)
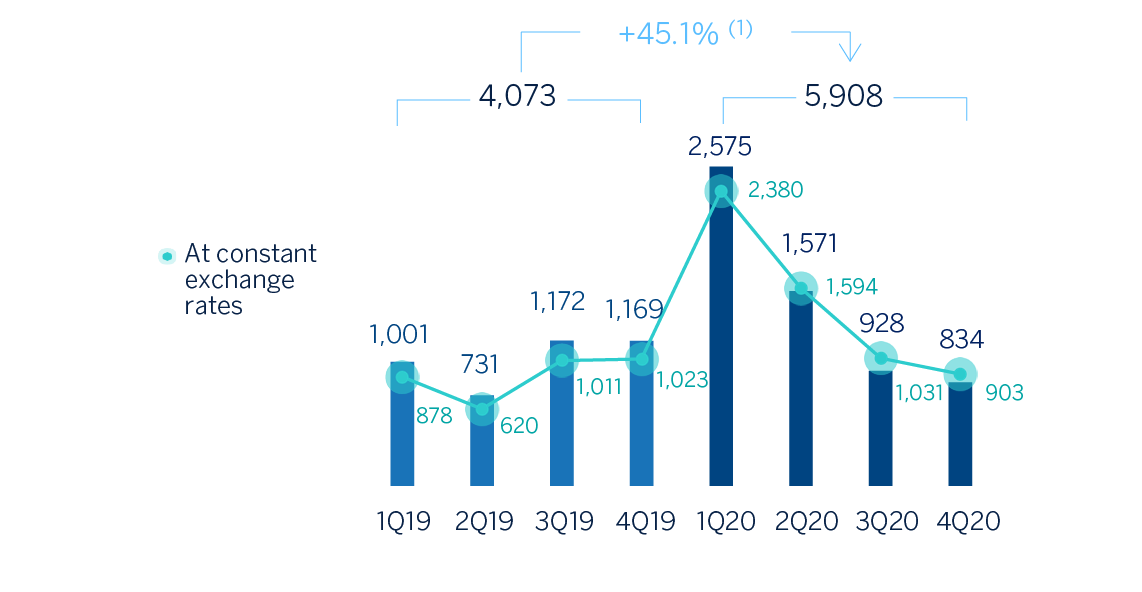
(1) At constant exchange rates: +67.3%.
Provisions or reversal of provisions (hereinafter provisions) closed December with a cumulative negative balance of €744m, 33.0% higher than the loss recorded in the previous year, mainly due to higher provisions in Spain.
The other gains (losses) line was 117.0% more negative compared to the previous year.
Results
As a result of the above, the cumulative net attributable profit of the BBVA Group in 2020 was €1,305m, which includes results from corporate operations derived from the net capital gain of €304m, generated by the transfer to Allianz of half plus one share of the company created to jointly develop the non-life insurance business in Spain, excluding the health insurance line, and the goodwill impairment in the United States of €2,084m. This result is 55.3% less than the €3,512m posted the previous year in a comparison also influenced by the goodwill impairment in the United States in 2019.
The Group's net attributable profit, when adjusted to exclude the goodwill impairment in the United States and the results from corporate operations in 2020, stood at €3,084m, which is 27.2% lower than the result in 2019, also excluding the goodwill impairment in the United States.
NET ATTRIBUTABLE PROFIT (Millones de euros)
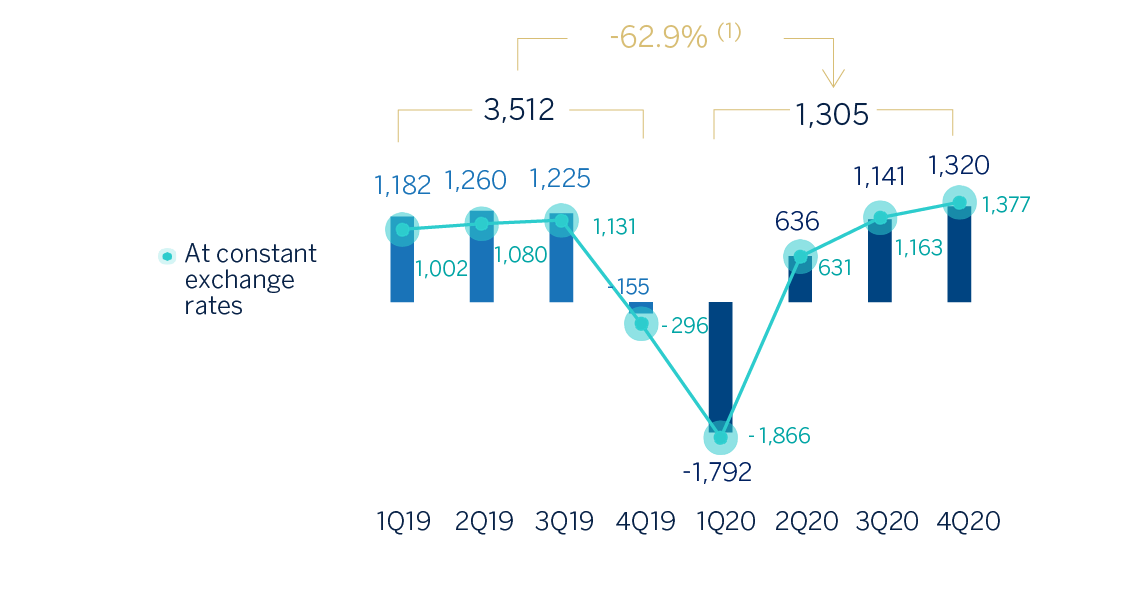
(1) At constant exchange rates: -55.3%.
NET ATTRIBUTABLE PROFIT EXCLUDING THE UNITED STATES GOODWILL IMPAIRMENT AND CORPORATE OPERATIONS(1) (MILLIONS OF EUROS)
(1) Net profit before tax because of the sale to Allianz of half plus one share of the company created to jointly promote non-life insurance business in Spain, excluding the health insurance line.
(2) At constant exchange rates: -27.2%.
The cumulative net attributable profits, in millions of euros at the close of December 2020 for the different business areas that make up the Group were: 606 in Spain, 429 in the United States, 1,759 in Mexico, 563 in Turkey, 446 in South America and 137 in the Rest of Eurasia.
TANGIBLE BOOK VALUE PER SHARE AND DIVIDENDS (1) (EUROS)
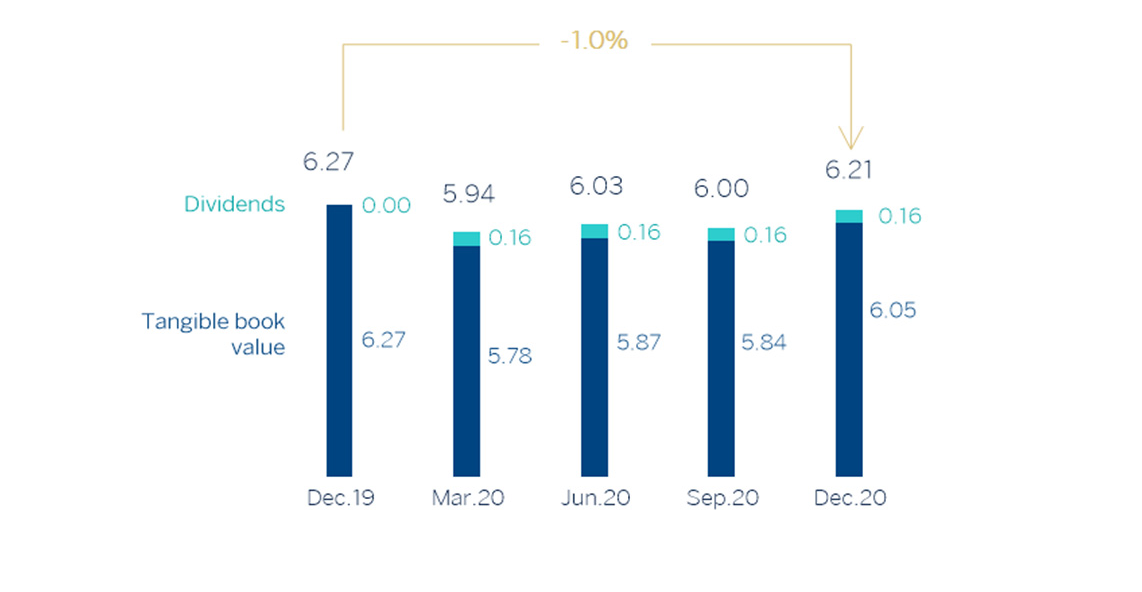
(1) Replenishing dividends paid in the period.
EARNING PER SHARE (1) (EUROS)
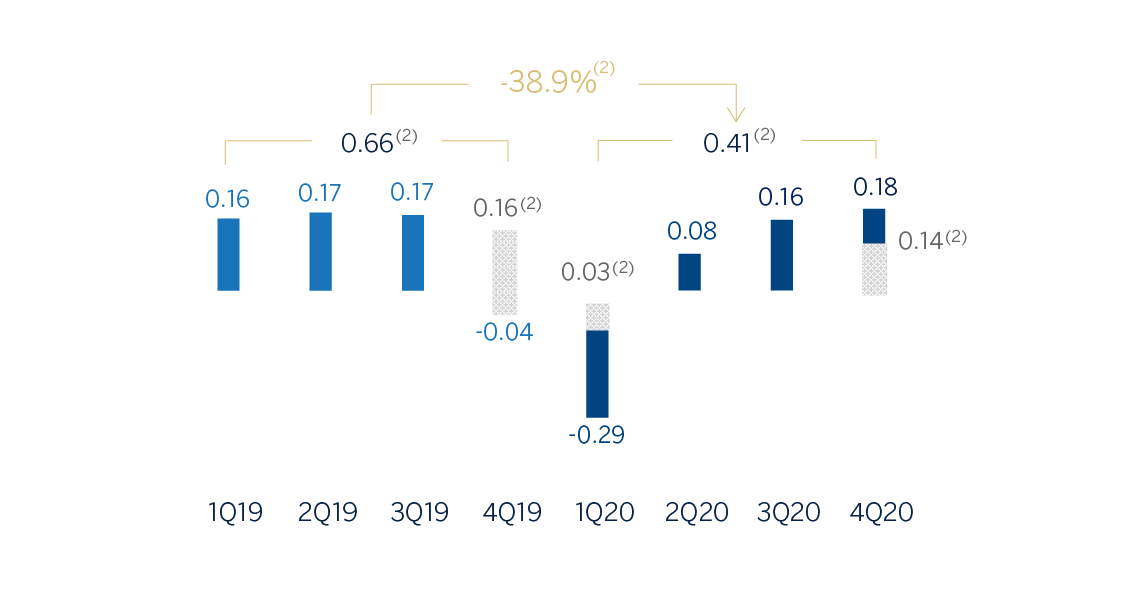
(1) Adjusted by additional Tier 1 instrument remuneration.
(2) Excluding the goodwill impairment in the United States in 4Q19 and 1Q20 and the net capital gain from the insurance operation in 4Q20.
ROE AND ROTE (1) (PERCENTAGE)
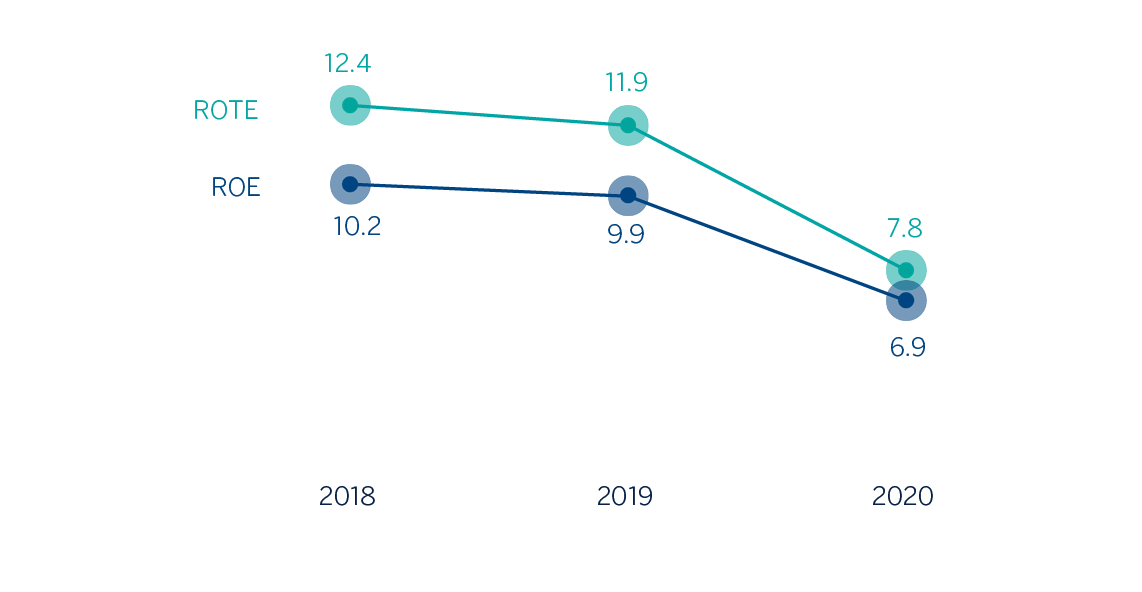
(1) Ratios excluding BBVA Chile in 2018, the goodwill impairment in the United States in 2019 and 2020 and the net capital gain from the bancassurance operation in 2020.
ROA AND RORWA (1) (PERCENTAGE)
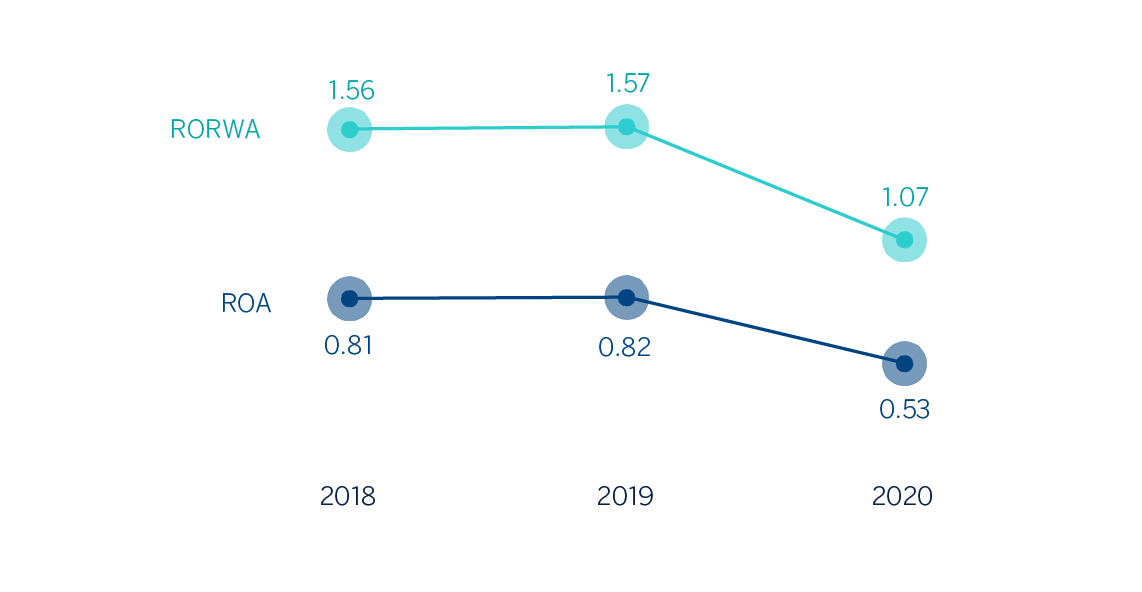
(1) Ratios excluding BBVA Chile in 2018, the goodwill impairment in the United States in 2019 and 2020 and the net capital gain from the bancassurance operation in 2020.
Balance sheet and business activity
The most relevant aspects related to the evolution of the Group's balance sheet and business activity in 2020, are summarized below:
- Loans and advances to customers (gross) decreased by 4.5% compared to the end of the previous year, with deleveraging in all the portfolios in the last quarter of 2020, with the exception of consumer and credit cards, which showed some dynamism thanks to the recovery of economic activity in the new normal environment. In the comparison with December 2019, the mortgage portfolio registered the greatest reduction in absolute terms, despite the good origination data in several geographical areas.
- Non-performing loans were lower than at the end of December of the previous year, despite the increase in the last quarter of the year, mainly due to the entries of non-performing loans in the retail portfolios in Mexico.
- Customer deposits closed December 2020 6.1% above December 2019 balances, strongly supported by the good performance of demand deposits (up 14.0%), where customers have deposited the available liquidity to face the pandemic and which more than offset the reduction in time deposits.
- Off-balance sheet funds recovered in the quarter (up 2.9%) although it continued to show a negative growth rate compared to December 2019 (down 4.5%), mainly due to the unfavorable evolution of the markets during the first quarter of the year.
- Regarding intangible assets, the balance sheet figures as of December 31, 2020 and December 31, 2019 include the goodwill impairments in the United States registered in the last quarter of 2019 and the first quarter of 2020, with no effect on the tangible net equity, solvency or liquidity of the BBVA Group.
CONSOLIDATED BALANCE SHEET(MILLIONS OF EUROS)
| 31-12-20 | ∆% | 31-12-19 | |
|---|---|---|---|
| Cash, cash balances at central banks and other demand deposits | 77,303 | 73.1 | 44,666 |
| Financial assets held for trading | 109,078 | 7.2 | 101,735 |
| Non-trading financial assets mandatorily at fair value through profit or loss | 5,211 | (6.2) | 5,557 |
| Financial assets designated at fair value through profit or loss | 1,117 | (8.0) | 1,214 |
| Financial assets at fair value through accumulated other comprehensive income | 74,416 | 21.6 | 61,186 |
| Financial assets at amortized cost | 430,260 | (2.3) | 440,430 |
| Loans and advances to central banks and credit institutions | 20,821 | 16.2 | 17,924 |
| Loans and advances to customers | 365,006 | (4.8) | 383,565 |
| Debt securities | 44,434 | 14.1 | 38,940 |
| Investments in subsidiaries, joint ventures and associates | 1,437 | (3.5) | 1,488 |
| Tangible assets | 8,629 | (14.4) | 10,077 |
| Intangible assets | 4,297 | (38.4) | 6,970 |
| Other assets | 24,428 | 0.1 | 24,413 |
| Total assets | 736,176 | 5.5 | 697,737 |
| Financial liabilities held for trading | 86,587 | (2.4) | 88,680 |
| Other financial liabilities designated at fair value through profit or loss | 10,050 | 0.4 | 10,010 |
| Financial liabilities at amortized cost | 565,085 | 9.1 | 518,182 |
| Deposits from central banks and credit institutions | 77,513 | 41.6 | 54,722 |
| Deposits from customers | 409,122 | 6.1 | 385,686 |
| Debt certificates | 64,591 | 0.9 | 64,004 |
| Other financial liabilities | 13,860 | 0.6 | 13,771 |
| Liabilities under insurance and reinsurance contracts | 9,951 | (6.2) | 10,606 |
| Other liabilities | 14,483 | (5.5) | 15,333 |
| Total liabilities | 686,156 | 6.7 | 642,812 |
| Non-controlling interests | 5,471 | (11.8) | 6,201 |
| Accumulated other comprehensive income | (14,356) | 40.4 | (10,226) |
| Shareholders’ funds | 58,904 | (0.1) | 58,950 |
| Total equity | 50,020 | (8.9) | 54,925 |
| Total liabilities and equity | 736,176 | 5.5 | 697,737 |
| Memorandum item: | |||
| Guarantees given | 43,294 | (5.8) | 45,952 |
- General note: figures without considering the classification of BBVA Paraguay as Non-current Assets and Liabilities Held for Sale as of 31-12-2020 and 31-12-2019 and BBVA USA and the rest of Group's companies in the United States included in the sale agreement signed with PNC as Non-current Assets and Liabilities Held For Sale as of 31-12-2020.
LOANS AND ADVANCES TO CUSTOMERS (MILLIONS OF EUROS)
| 31-12-20 | ∆% | 31-12-19 | |
|---|---|---|---|
| Public sector | 24,273 | (14.0) | 28,226 |
| Individuals | 163,460 | (6.5) | 174,867 |
| Mortgages | 103,922 | (6.0) | 110,534 |
| Consumer | 34,256 | (6.1) | 36,500 |
| Credit cards | 12,742 | (14.6) | 14,925 |
| Other loans | 12,540 | (2.8) | 12,907 |
| Business | 174,492 | (1.4) | 176,920 |
| Non-performing loans | 15,914 | (0.5) | 16,000 |
| Loans and advances to customers (gross) | 378,139 | (4.5) | 396,012 |
| Allowances (1) | (13,133) | 5.5 | (12,447) |
| Loans and advances to customers | 365,006 | (4.8) | 383,565 |
- General note: figures without considering the classification of BBVA Paraguay as Non-current Assets and Liabilities Held for Sale as of 31-12-2020 and 31-12-2019 and BBVA USA and the rest of Group's companies in the United States included in the sale agreement signed with PNC as Non-current Assets and Liabilities Held For Sale as of 31-12-2020.
- (1) Allowances include the valuation adjustments for credit risk during the expected residual life of those financial instruments which have been acquired (mainly originated from the acquisition of Catalunya Banc, S.A.). As of December 31, 2020 and December 31, 2019 the remaining amount was €363m and €433m, respectively.
LOANS AND ADVANCES TO CUSTOMERS
(GROSS. BILLIONS OF EUROS)
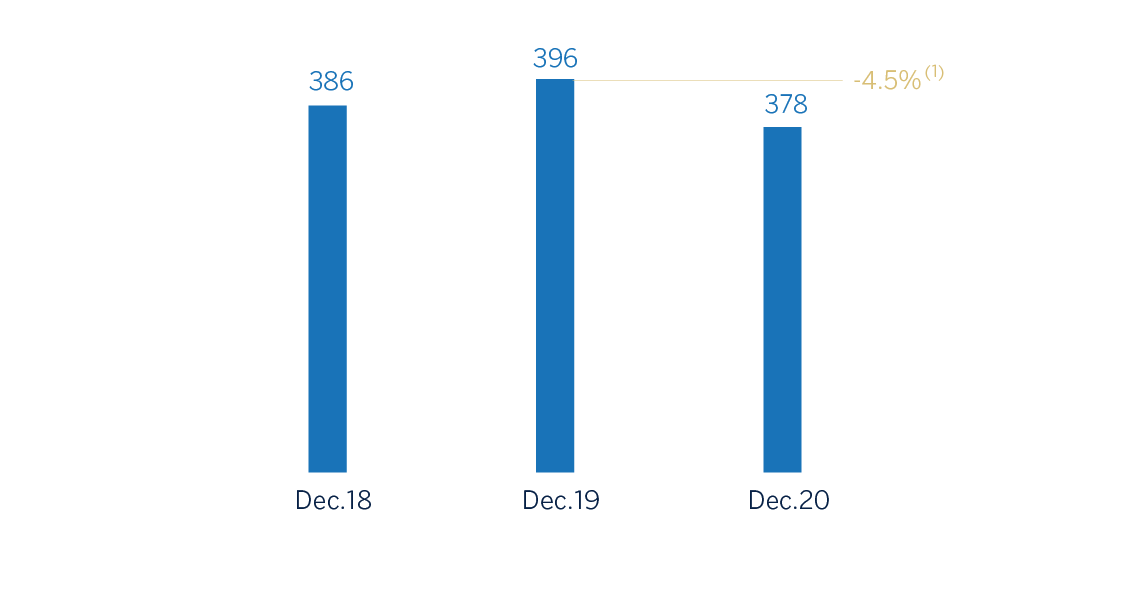
(1) At constant exchange rates: +3.5%.
CUSTOMER FUNDS
(BILLIONS OF EUROS)
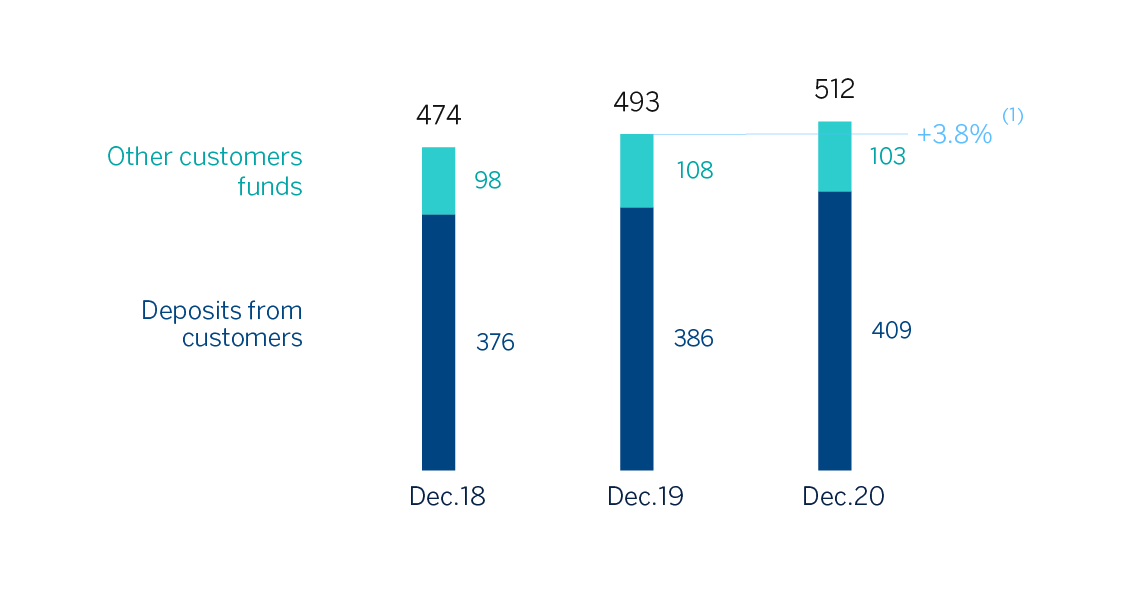
(1) At constant exchange rates: +11.9%.
CUSTOMER FUNDS (MILLIONS OF EUROS)
| 31-12-20 | ∆% | 31-12-19 | |
|---|---|---|---|
| Deposits from customers | 409,122 | 6.1 | 385,686 |
| Current accounts | 320,713 | 14.0 | 281,270 |
| Time deposits | 79,978 | (17.7) | 97,170 |
| Other deposits | 8,430 | 16.3 | 7,246 |
| Other customer funds | 102,947 | (4.5) | 107,803 |
| Mutual funds and investment companies | 64,869 | (5.5) | 68,639 |
| Pension funds | 36,215 | (1.1) | 36,630 |
| Other off-balance sheet funds | 1,863 | (26.5) | 2,534 |
| Total customer funds | 512,068 | 3.8 | 493,488 |
- General note: figures without considering the classification of BBVA Paraguay as Non-current Assets and Liabilities Held for Sale as of 31-12-2020 and 31-12-2019 and BBVA USA and the rest of Group's companies in the United States included in the sale agreement signed with PNC as Non-current Assets and Liabilities Held For Sale as of 31-12-2020.
Solvency
Capital base
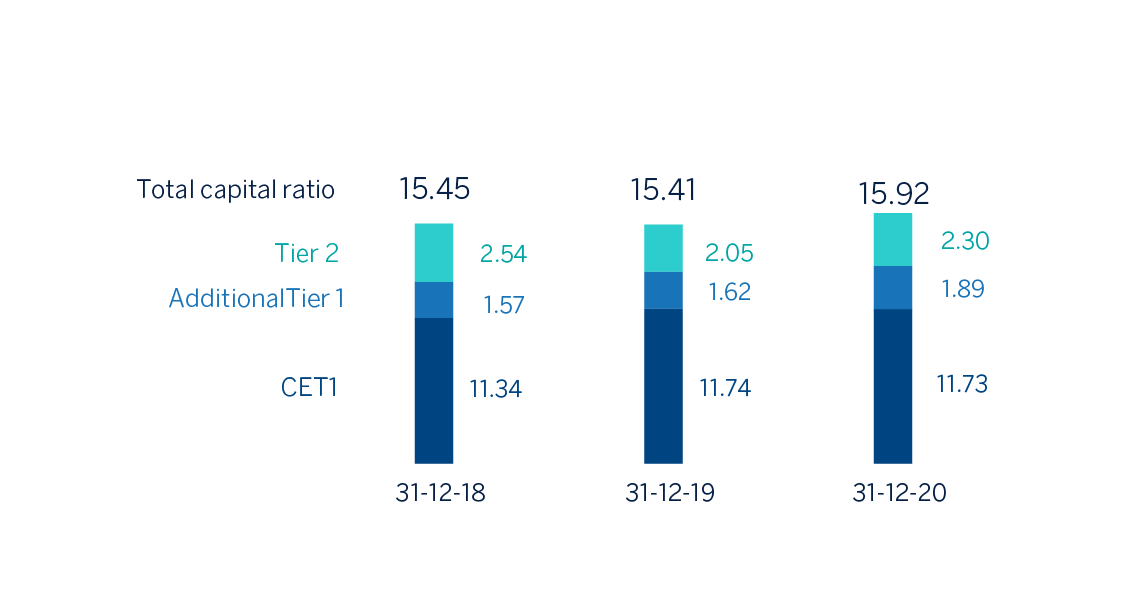
BBVA's fully-loaded CET1 ratio stood at 11.73% at the end of December 2020. From 2021 onwards the BBVA Group sets the target to keep the CET1 fully-loaded ratio between 11.5%-12.0% increasing the distance to the minimum requirement (currently at 8.59%) to 291-341 basis points. At the end of 2020 financial year the CET1 fully-loaded ratio is already within this target management range.
In the last quarter of 2020, the CET1 fully-loaded ratio stood 21 basis points above the previous quarter. This increase includes a positive impact of +7 basis points due to the execution of the agreement reached with Allianz to jointly boost the non-life insurance business in Spain, excluding the health insurance line. The corresponding amount to €0.059 (gross) per share as shareholder remuneration allowed by the ECB recommendation has been already deduced from the capital base. This ratio does not include the positive impact of the sale of BBVA USA and other companies in the United States with activities related to said banking business, which, according to the current estimate and using as a reference the capital level in December 2020, would place the fully-loaded CET1 ratio at 14.58%. Additionally, it does not include the effect from the closing of the BBVA Paraguay sale, which would have a positive impact of approximately +6 basis points and which will be registered in the first quarter of 2021.
Furthermore, the profit generated in the period, excluding the gains generated by the operation with Allianz, has contributed +30 basis points, while the other elements of the capital ratios has contributed to a total net impact of -16 points, being the most significant component the growth in risk-weighted assets, and, conversely, the good market performance recorded in equity instruments measured at fair value through accumulated other comprehensive income. It also includes the positive effect on the regulatory deduction of software, following the publication of Delegated Regulation 2020/2176 on December 22 concerning the prudential treatment of software.
Fully-loaded additional Tier 1 capital (AT1) stood at 1.89% at the end of December 2020. In this regard, the world's first green CoCo for a financial institution was issued in July 2020 for €1,000m, a coupon of 6% and with an early amortization option from five and a half years, allowing all requirements at this tier to be fulfilled, including those from the tiering of Pillar 2 and therefore the distance to MDA to be increased. Moreover, a CoCo of €1,500m (coupon of 6.75%) was amortized in February, on the first date of the early amortization option; in January 2021, the early amortization options were implemented for two preferential issuances, issued by BBVA International Preferred and Caixa Sabadell Preferents for 31 million pounds sterling and €90m respectively; and finally, for a third preferential issuance issued by Caixa Terrassa Societat de Participacions Preferents, the bondholders' meeting has approved its early amortization on January 29, 2021 (versus the amortization option date of August 10, 2021). As of December 31, 2020, these issuances do not form part of the Group's capital adequacy ratios.
The fully-loaded Tier 2 ratio stood at 2.30% on December 31. Two Tier 2 issuances were issued in 2020: an issuance of €1,000m in January, with a maturity of 10 years and an amortization option from the fifth year, with a coupon of 1%; and another issuance of 300 million pounds sterling in July, with a maturity of 11 years and with an early amortization option from the sixth year, with a coupon of 3.104%, thereby diversifying the investment base and improving the price compared to an equivalent issuance in euros.
The phased-in CET1 ratio stood at 12.15% at the end of December 2020, taking into account the transitory effect of the IFRS 9 standard. AT1 stood at 1.89% and Tier 2 at 2.42%, resulting in a total capital adequacy ratio of 16.46%.
Regarding shareholder remuneration, on April 9, 2020, a cash payment was made for a supplementary dividend for the 2019 financial year for the gross amount of €0.16 per share, according to the approved at the General Shareholders' Meeting on March 13, 2020. This amounted to €1,067m. Thus, the total dividend for the 2019 financial year amounts to €0.26 gross per share. This distribution had no impact on the evolution of the capital adequacy ratio since it had already accrued at the end of 2019.
BBVA has announced its intention to return in 2021 to its shareholders remuneration policy, communicated through a relevant event on February 1, 2017, consisting of distributing annually between 35% and 40% of the profits resulting of each financial year entirely in cash through two distributions (predictably in October and April and subject to relevant approvals) when the current ECB recommendation applicable on the date of publication of this report is revoked and there are no additional restrictions or limitations. (For more information see the “Shareholder remuneration” paragraph, included in the “Highlights” section).
FULLY-LOADED CAPITAL RATIOS (PERCENTAGE)
CAPITAL BASE (MILLIONS OF EUROS)
| CRD IV phased-in | CRD IV fully-loaded | |||||
|---|---|---|---|---|---|---|
| 31-12-20 (1) (2) | 30-09-20 | 31-12-19 | 31-12-20 (1) (2) | 30-09-20 | 31-12-19 | |
| Common Equity Tier 1 (CET 1) | 42,931 | 41,231 | 43,653 | 41,368 | 39,651 | 42,856 |
| Tier 1 | 49,597 | 48,248 | 49,701 | 48,035 | 46,550 | 48,775 |
| Tier 2 | 8,549 | 9,056 | 8,304 | 8,103 | 8,628 | 7,464 |
| Total Capital (Tier 1 + Tier 2) | 58,147 | 57,305 | 58,005 | 56,138 | 55,178 | 56,240 |
| Risk-weighted assets | 353,272 | 343,923 | 364,448 | 352,679 | 344,215 | 364,942 |
| CET1 (%) | 12.15 | 11.99 | 11.98 | 11.73 | 11.52 | 11.74 |
| Tier 1 (%) | 14.04 | 14.03 | 13.64 | 13.62 | 13.52 | 13.37 |
| Tier 2 (%) | 2.42 | 2.63 | 2.28 | 2.30 | 2.51 | 2.05 |
| Total capital ratio (%) | 16.46 | 16.66 | 15.92 | 15.92 | 16.03 | 15.41 |
- (1) As of December 31, 2020, the difference between the phased-in and fully-loaded ratios arises from the temporary treatment of certain capital items, mainly of the impact of IFRS 9, to which the BBVA Group has adhered voluntarily (in accordance with article 473bis of the CRR and the subsequent amendments introduced by the Regulation (EU) 2020/873).
- (2) Preliminary data.
Regarding the MREL (Minimum Requirement for own funds and Eligible Liabilities) requirements, BBVA has continued its issuance plan during 2020 by closing two public issuances of non-preferred senior debt, one in January 2020 for €1,250m with a maturity of seven years and a coupon of 0.5%, and another in February 2020 for CHF 160m with a maturity of six and a half years and a coupon of 0.125%. In May 2020, the first issuance of a COVID-19 social bond by a private financial institution in Europe was completed. This is a five-year senior preferred bond, for €1,000m and a coupon of 0.75%. Finally, in order to optimize the MREL requirement, in September BBVA issued preferred senior debt of USD 2,000m in two tranches, with maturities of three and five years, for USD 1,200m and USD 800m and coupons of 0.875% and 1.125% respectively.
The Group estimates that, following the entry into force of Regulation (EU) No. 2019/877 of the European Parliament and of the Council of May 20 (which, among other matters, establishes the MREL in terms of RWAs and new periods for said requirement's transition and implementation), the current structure of shareholders’ funds and admissible liabilities enables compliance with the MREL.
In November 2015 (effective January 1, 2017) BBVA ceased to be included in the list of banks with global systemic importance (Global Systemically Important Banks -G-SIBs-). This list is prepared annually by the Financial Stability Board (FSB) based on a set of quantitative indicators that can be consulted, together with the evaluation methodology, at the link www.bis.org/bcbs/gsib/. In November 2020, BBVA, at a consolidated level, was again identified as Another Entity of Systemic Importance (OEIS). As a consequence of the foregoing, the Bank of Spain imposes the obligation to maintain, as a buffer for OEIS during the financial year 2021, Common Equity Tier 1 elements for an amount equal to 0.75% of the total amount of its exposure to risk in the consolidated base.
Finally, the Group's leverage ratio maintained a solid position, at 6.5% fully-loaded (6.7% phased-in). These figures include the effect of the temporary exclusion of certain positions with the central bank provided for in the "CRR-Quick fix."
Stress testing at BBVA
The BBVA Group has a Stress Testing Programme (hereinafter, STP) that is part of its risk management framework. This Stress Testing Programme covers the exercises used for BBVA’s internal management and those fostered by supervisory authorities (e.g., stress test of the EBA and ECB). However, as the latter usually have a specific framework determined by the supervisor establishing, among other, its frequency, methodology, infrastructure, assumptions to be applied, etc., the STP focuses on the internal stress tests.
Some of the main targets of these internal tests are the following:
- Promote a better understanding of the exposures and risks assumed by the Group on its operations, identifying risk factors and scenarios that could jeopardize compliance with the Risk Appetite Framework.
- Allow proactive risk management and an effective response through the design of mitigating measures, so that the Group remains within the target risk profile even in stress situations.
- Contribute to the calibration of the core metrics thresholds of the Risk Appetite Framework (maximum capacity and maximum appetite thresholds) supported, among other factors, on the implementation of stress tests and their results, both internal and regulatory tests included in the internal capital (ICAAP) and liquidity (ILAAP) adequacy assessment processes and the Recovery Plan of the BBVA Group.
- Feed the setting of thresholds of the Risk Appetite Framework used for the budgeting process, which shall be aligned with the targets of the strategic plan.
- Promote and encourage BBVA’s risk culture and dialog.
Stress testing types
Stress tests carried out in BBVA’s STP have different scopes depending mainly on the geographies and the type of risk covered. On the one hand, global tests are carried out impacting all or a large number of geographies where the Group is present and all material risks faced by the Group, regardless of their nature. In addition, tests focused on a specific geographical area or aimed at stressing a specific type of risk are carried out.
These stress tests must incorporate, among other, the following principles:
- The design of global stress testing models, including the criteria adopted, the assessed scope, and the complexity and granularity of the calculations, must be proportional to and consistent with BBVA’s risk profile. BBVA’s business model and the characteristics of its portfolios must be considered.
- Stress tests assumptions must preserve a sufficient level of prudence and conservatism as not to underestimate the impact of those elements that are difficult to forecast, such as diversification assumptions.
Global stress tests are composed by the analysis of scenarios, associated with macroprudential tests (ICAAP, ILAAP and Recovery Plan) and planning processes, sensitivity analyses and reverse stress tests. The latter two are also inputs to complete the analysis of scenarios, as they contribute to the risk scenarios definition process and to the selection of adverse and very adverse scenarios, and, in the sensitivity analysis case, they allow for an agile approximation of the assessment and analysis of scenarios.
Global stress test
| Stress | Frequency | Methodology | Infrastructure and data procurement |
|---|---|---|---|
| High-level stress tests – Sensitivities |
Annual | Sensitivities to fluctuations in the main macro-financial variables included in a stress scenario |
-BBVA Research financial forecasts - Corporate budget database and output of planning tools - Sensitivities by type of risk of specialist departments - Internal balance sheet, income statement and regulatory capital base forecasting tool. |
| Ad-hoc | One-off | Detailed calculation by specialist Risk and Finance departments of the potential impact on fluctuations of macro-financial variables in a stress scenario |
-BBVA Research financial forecasts -Calculation in departmental tools of the impacts on the balance sheet and income statement - Internal balance sheet, income statement and regulatory capital base forecasting tool |
| Reverse stress test | Annual | Sensitivities to fluctuations in the main macro-financial variables included in a stress scenario |
-Idem stress sensitivities |
| Group ICAAP & Recovery | Annual | Detailed methodology of the stress tests included in the ICAAP |
|
| EBA stress test | One-off | Regulatory |
Stress tests integration into management
The scenario analysis is integrated into management through the following processes:
- Stress test results are incorporated into capital planning processes in order to project capital paths under the proposed periods and scenarios, both from a regulatory (CET1, AT1, T2) and economic (economic solvency ratio) perspective.
- BBVA’s solvency level and loss-absorbency capacity to face a variety of adverse scenarios are assessed, contributing to capital self-assessment and to the calibration of the thresholds of the Risk Appetite Framework based on specific capital requirements.
- This stress analysis is also integrated into the ICAAP, ILAAP and Recovery Plan macroprudential exercises and, under scenarios with different severities, contribute to planning capital and liquidity management measures aimed at reshaping solvency and funding structure requirements and resetting target levels.
The sensitivity analysis is integrated into management through the following processes:
- Assessment of the impact of each High Level Risk Scenario (HLRS) developed by BBVA Research throughout the year describing a wide range of risk scenarios with a different nature, origin, likelihood and severity. The impact of these scenarios on BBVA’s core metrics allow to assess the resilience of the Group to different risk scenarios.
- Based on the severity of the abovementioned results, and the likelihood allocated to each scenario assessed, and considering the risk assessment carried out to identify the main vulnerabilities of BBVA, conclusions are made on the nature and driver of the adverse and very adverse scenarios developed by BBVA Research at the end of each year to be subsequently assessed in the ICAAP and Recovery Plan processes.
- In addition, the severity of certain risk factors is adjusted through these tests, quickly assessing the impact on BBVA’s core metrics of different alternative levels for specific variables.
Reverse stress tests contribute to determining the severity in the definition of the different scenarios, depending on its use in internal management processes, liquidity and capital self-assessment or Recovery Plan, while allowing the identification of those hypotheses with greater impact on the results of the stress tests and the risk sources to which the entity is more vulnerable.
Elements of the Global Stress Tests
Five elements are identified in each of the global stress tests: scenarios, models, hypotheses and inputs, tools and impacts/outputs.
The scenario generation process is described and governed by the "Rule on the generation of Internal Risk Scenarios", which is reviewed and approved annually by the Global Risk Management Committee.
Stress test models must comply with the general risk strategy established by BBVA’s Board, and must be proportional to the level of the equity, borrowed capital and generation of recurrent earnings of the BBVA Group, and must be managed in a prudent and integrated manner throughout the life cycle of the risk models.
An adequate management framework for risk models requires considering all phases of their life cycle, from the moment a need is identified, it is planned and the development of a model begins, or its modification, to its implementation, use, validation and monitoring.
Model risk management must be based on tools that integrate the models, criteria and management strategies, and that allow decision processes to be automated. It is based on three levels and an internal governance structure that allows adequate mitigation of model risk:
- The first level consists of owners, technicians, users and developers, ensuring the existence of a suitable governance framework consistent with the needs of the BBVA Group. The second level consists of Internal Validation and the Risk Internal Control function, while the third level or line of defense consists of Internal Audit.
- With regard to the governance framework of the models, the necessary approval levels are established for each model or modification according to its tiering (categorization of the models according to the relative importance of their use in the management of the BBVA Group), which must also be applied to stress models in order to allow an adequate management on the deployment of the models, as well as the modifications that occur in risk models currently in use.
With regard to the hypotheses, and regardless of the specific criteria established in each test, they must all meet the following general requirements:
- The correlations between risk factors and types of risk must be assessed and stressed, both at an individual level in each entity or business area, as well as at the consolidated level of the BBVA Group, recognizing that in stress situations certain correlations tend to increase, reducing the benefits of the diversification between portfolios and geographies.
- The non-linear effects between risk factors and stress parameters in very low severity scenarios must be considered.
Ratings
In a year marked by the COVID-19 pandemic, BBVA’s has maintained its rating during 2020 in the single A space for senior preferred debt granted by all agencies. DBRS confirmed BBVA’s rating at A (high) with a stable outlook on April 1, and on April 29 S&P confirmed BBVA’s rating (A-) and its outlook (negative) in a joint action with the rest of the Spanish banks, in which the agency also assigned a negative outlook to the majority of the Spanish banks. In the month of July, as a consequence of the economic uncertainty caused by COVID-19 in the countries where BBVA is present, the rating agency Fitch downgraded its rating by one notch to A- with a stable outlook. For its part, Moody’s has maintained BBVA’s rating at A3 with a stable outlook. These ratings, together with their corresponding outlooks, are shown in the following table:
Ratings
| Rating agency | Long term (1) | Short term | Outlook |
|---|---|---|---|
| DBRS | A (high) | R-1 (middle) | Stable |
| Fitch | A- | F-2 | Stable |
| Moody’s | A3 | P-2 | Stable |
| Standard & Poor’s | A- | A-2 | Negative |
- (1) Ratings assigned to long term senior preferred debt. Additionally, Moody’s and Fitch assign A2 and A- rating respectively, to BBVA’s long term deposits.
The BBVA share
In a trading year clearly marked by the evolution of the pandemic, the main stock market indexes have shown a mixed behaviour during 2020. In Europe, the Stoxx Europe 600 index fell slightly in the year, down 4.00%, and in Spain the Ibex 35 fell by 15.5%. In the United States, the S&P 500 index had a faster recovery and improved by 16.3% in the period.
With regard to the banking sector indexes, its performance was worse than the general market. In Europe, the Stoxx Europe 600 Banks index, which includes the banks in the United Kingdom, and the Euro Stoxx Banks, the Eurozone bank index, fell by 24.5% and 23.7% respectively, meanwhile in the United States, the S&P Regional Banks sectoral index fell by 10.6% in the period.
For its part, the BBVA share price fell by 19.0% during the year, less than that of the banking sector in Spain (the Ibex 35 index fell by 27.3%) and closed the month of December at €4.04.
BBVA SHARE EVOLUTION COMPARED WITH EUROPEAN INDICES (BASE INDICE 100=31-12-19)
BBVA
Stoxx Europe 600
Stoxx Banks
THE BBVA SHARE AND SHARE PERFORMANCE RATIOS
| 31-12-20 | 31-12-19 | |
|---|---|---|
| Number of shareholders | 879,226 | 874,148 |
| Number of shares issued | 6,667,886,580 | 6,667,886,580 |
| Daily average number of shares traded | 34,180,978 | 30,705,133 |
| Daily average trading (millions of euros) | 108 | 153 |
| Maximum price (euros) | 5.34 | 5.68 |
| Minimum price (euros) | 2.13 | 4.19 |
| Closing price (euros) | 4.04 | 4.98 |
| Book value per share (euros) | 6.70 | 7.32 |
| Tangible book value per share (euros) | 6.05 | 6.27 |
| Market capitalization (millions of euros) | 26,905 | 33,226 |
| Yield (dividend/price; %) (1) | 4.0 | 5.2 |
- (1) Calculated by dividing shareholder remuneration over the last twelve months by the closing price of the period.
As of December 31, 2020, the number of BBVA shares was 6,668 billion, and the number of shareholders reached 879,226. By type of investor, 57.18% of the capital belongs to institutional investors and the remaining 42.82% belongs to retail shareholders.
SHAREHOLDER STRUCTURE (31-12-2020)
| Shareholders | Shares | |||
|---|---|---|---|---|
| Numbers of shares | Number | % | Number | % |
| Up to 500 | 361,681 | 41.1 | 67,754,273 | 1.0 |
| 501 to 5,000 | 406,886 | 46.3 | 710,105,474 | 10.6 |
| 5,001 to 10,000 | 59,129 | 6.7 | 416,320,737 | 6.2 |
| 10,001 to 50,000 | 46,362 | 5.3 | 888,242,755 | 13.3 |
| 50,001 to 100,000 | 3,366 | 0.4 | 229,327,509 | 3.4 |
| 100,001 to 500,000 | 1,513 | 0.2 | 273,726,222 | 4.1 |
| More than 500,001 | 289 | 0.0 | 4,082,409,610 | 61.2 |
| Total | 879,226 | 100.0 | 6,667,886,580 | 100.0 |
BBVA shares are included on the main stock market indexes, including the Ibex 35, and the Stoxx Europe 600 index, with a weighting of 6.34% and 0.31%, respectively at the end of December 2020. They are also included on several sector indexes, including Stoxx Europe 600 Banks, which includes the United Kingdom, with a weighting of 4.63% and the Euro Stoxx Banks index for the Eurozone with a weighting of 8.58%.
Finally, BBVA maintains a significant presence on a number of international sustainability indexes or Environmental, Social and Governance (ESG) indexes, which evaluates companies' performance in these areas. For more information, see the chapter "Sustainable finance" of this management report.