The BBVA share
Global growth continued to slow to rates slightly below 3.0% in annual terms in recent quarters, significantly below the 3.7% expansion registered in 2018. Growing trade protectionism and high uncertainty are having a negative impact on economic activity, mainly on exports and investment, adding to the cyclical moderation of the U.S. and eurozone economies. The announced countercyclical policies, led by central banks, will not be able to fully compensate for the impact of multiple sources of uncertainty. Thus, world growth forecasts stand at around 3.2% in 2019.
In terms of monetary policy, the main central banks have announced further relaxation measures in recent months. In the United States, the Federal Reserve (Fed) cut interest rates by 50 basis points between July and September to 2% and left the door open for new cuts if necessary. In the eurozone, the European Central Bank (ECB) announced in September a package of monetary measures to support the economy and the financial system, including: (i) a deposit facility interest rate cut of 10 basis points, leaving them at -0.50%; (ii) the adoption of a phased interest rate system for such deposit facility (tiering of deposit system); (iii) a new debt purchase program of €20,000m per month; and (iv) an improvement in financing conditions for banks in the ECB's liquidity auctions. In China, in addition to fiscal stimulus decisions and exchange rate depreciation, a cut in reserve requirements for banks was recently announced and official or monetary interest rates have been reduced. Accordingly, interest rates will remain low in major economies, enabling more flexibility to emerging countries for maneuver.
The main stock market indexes performed strongly during the first nine months of 2019, thanks particularly to the positive start in the first quarter. In Europe, the Stoxx Europe 600 index increased by 12.9% between January and September, although it fell slightly in the third quarter (-1.3% compared to June 2019). In Spain, the rise of the Ibex 35 during the same period was more moderate at 8.3%, remaining practically flat in the third quarter (+0.5%). In the United States, the main stock indexes maintain the high growth rates observed throughout the year. The S&P 500 Index rose 18.7% in the first nine months of the year, although this increase has slowed in the third quarter (+ 1.2%).
With regard to the European banking sector indixes, particularly in Europe, its performance in the first nine months of the year was worse than the general market indexes, and the positive start of the first quarter was offset by the decline in the second and third quarters of the year. The Stoxx Europe 600 Banks index, which includes banks in the United Kingdom and the Euro Stoxx Banks index for the Eurozone remained flat during the year (-0.4% and +0.8% respectively, as of September 2019), while in the United States, the S&P Regional Banks Select Industry Index upgraded 12.9% compared to the close of the 2018 financial year.
In this context, the BBVA share registered a better performance compared to the European banking sector during the first nine months of the year, with the share price increasing by 3.1% and closing September 2019 at €4.78.
BBVA share evolution
Compared with European indices (Base indice 100=31-12-18)
BBVA
Stoxx Europe 600
Stoxx Banks
Regarding shareholder remuneration in 2019, on October 15, BBVA paid a cash interim dividend of €0.10 (gross) per share on account of the 2019 dividend. This payment is in line with the policy announced in the Relevant Event released on February 1, 2017, in which BBVA plans to distribute between 35% and 40% of annual earnings in dividends. This shareholder remuneration policy will consist of two cash payments, the aforementioned in October and the foreseen in April 2020, all subject to the appropriate approvals by the relevant governing bodies.
Shareholder remuneration
(Euros-gross/share)
Cash
Group information
Results
- In the January–September period of 2019, the overall growth in recurring revenue income is maintained, with a positive evolution in terms of net interest income in most business areas.
- The trend of containing operating expenses continued, improving the efficiency ratio compared to the same period of the previous year.
- As a result of the above, operating income increased 4.8% year-on-year.
- Impairment on financial assets increased by 12.7% year-on-year, mainly as a result of the higher loan-loss provisions in the United States.
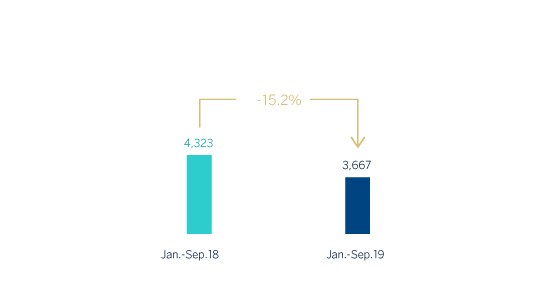
- Finally, net attributed profit stood at €3,667m, a 15.2% lower than in the January–September period of 2018. Excluding the corporate operations from the 2018 comparison, the net attributable profit closed in line with the same period of the previous year.
Net attributable profit (Millions of Euros)
Net attributable profit breakdown (1) (Percentage. Jan.-Sep. 19)
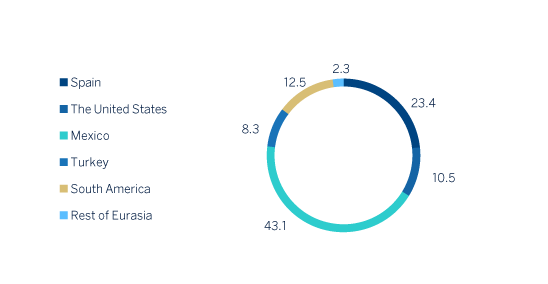
(1) Excludes the Corporate Center.
Balance sheet and business activity
- As of September 30, 2019, loans and advances to customers (gross) grew by 1.3% compared to December 31, 2018, with improved levels in the business areas of Mexico and, to a lesser extent, South America and Rest of Eurasia.
- Strong performance of customer funds (up 2.3% compared to December 31, 2018) thanks to the positive evolution in demand deposits, mutual funds and pension funds.
Solvency
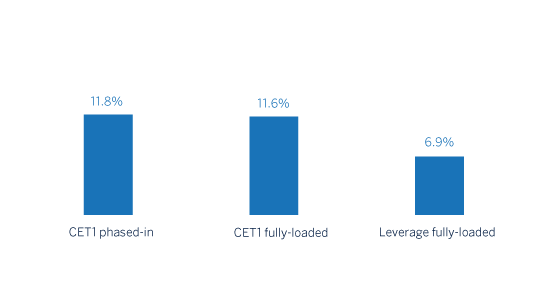
- The fully loaded CET1 ratio stood at 11.6% as of September 30, 2019, up 22 basis points in the first nine months of the year, due to recurring organic capital generation. Thus, this ratio is positioned within the range of this capital target defined for the Group.
Capital and leverage ratios (Percentage as of 30-09-19)
Risk management
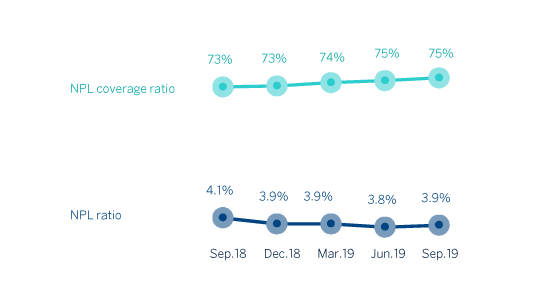
- Positive performance of the risk metrics. Non-performing loans remained flat from January to September 2019. The NPL ratio stood at 3.9%, the NPL coverage ratio was 75% and the cost of risk 1.01%, all figures as of September 30, 2019.
NPL and NPL coverage ratios (Percentage)
Transformation
- The unification of the BBVA brand in all the countries in which BBVA operates, announced in June 2019, is now a visible reality in most of the Group's digital and physical environments.
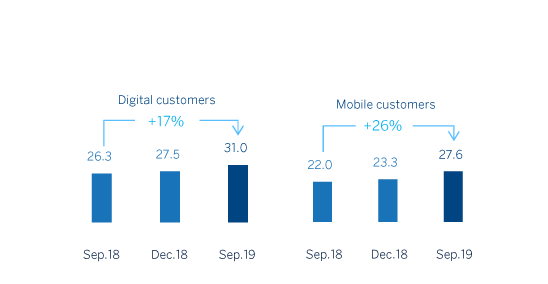
- The Group's digital and mobile customer base continues to grow, as do digital sales.
Digital and mobile customers (Millons)
Other matters of interest
- On August 7, 2019, BBVA reached an agreement with Banco GNB Paraguay S.A., for the sale of its shareholding, direct and indirect, in Banco Bilbao Vizcaya Argentaria Paraguay, S.A. (BBVA Paraguay), which amounts to 100% of its share capital. As a result of the above, all items in BBVA Paraguay's balance sheet have been reclassified into the category of 'Non-current assets (liabilities) and disposal groups held for sale' (hereinafter NCA&L).
- On January 1, 2019, IFRS 16 'Leases' entered into force, which requires the lessee to recognize the assets and liabilities arising from the rights and obligations of lease agreements. The main impacts are the recognition of an asset through the right of use and a liability based on future payment obligations. The impact of the first implementation was €3,419m and €3,472m, respectively, resulting in a decrease of 11 basis points of the CET1 capital ratio.
- In order to ensure that the information for 2019 is comparable to that of 2018, the balance sheets, income statements and ratios of the first three quarters of 2018 financial year for the Group and the South America business area have been restated to reflect the impact of the hyperinflation in Argentina as a result of the application of IAS 29 “Financial Reporting in Hyperinflationary Economies”. This impact was first registered in the third quarter of 2018, but with accounting effects as of January 1, 2018.
Business areas
Spain (1)
€4,307M
-4.2%
The United States (2)
€2,442M
+5.3%
Mexico (2)
€5,912M
+5.3%
Turkey (2)
€2,548M
+4.7%
South America (3)
€2,884M
+10.8%
Rest of Eurasia (1)
€338M
+6.4%
Spain
Millions of euros and year-on-year changes
Highlights
- Activity affected by the seasonality of the third quarter.
- Net Interest income influenced by lower ALCO contribution and the impact of IFRS 16.
- Continued decrease in operating expenses.
- Positive impact of the sale of non-performing and write-off portfolios on loan loss provisions and risk indicators.
Results
Net interest income
2,721-1.9% (1)
Gross income
4,307-4.2% (1)
Operating income
1,866-5.6% (1)
Net attributable profit
1,064-2.5% (1)
Activity (2)
Performing loans and advances to customers under mangement
-0.8%Customers funds under management
+1.8%
Risks
NPL coverage ratio
57%
59%
NPL ratio
5.1%
4.6%
Cost of risk
0.21%
0.08%
DEC 18
SEP 19
(1) Year on year changes.
(2) Excluding repos.
The United States
Millions of euros and year-on-year changes at constant exchange rate
Highlights
- Moderation of the activity growth rate.
- Good performance of the recurring revenue items.
- Continued improvement of the efficiency ratio.
- Net attributable profit affected by the impairment on financial assets.
Results
Net interest income
1,813+2.4% (1)
Gross income
2,442+5.3% (1)
Operating income
989+14.7% (1)
Net attributable profit
478-17.0% (1)
Activity (2)
Performing loans and advances to customers under mangement
+1.4%Customers funds under management
+4.0%
Risks
NPL coverage ratio
85%
102%
NPL ratio
1.3%
1.1%
Cost of risk
0.39%
0.87%
DEC 18
SEP 19
(1) Year on year changes at constant exchange rate.
(2) Excluding repos.
Mexico
Millions of euros and year-on-year changes at constant exchange rate
Highlights
- Good performance of the lending activity, boosted by growth in the retail portfolio.
- Positive trend of customer funds especially in time deposits and off-balance sheet funds.
- Net interest income growing in line with the activity.
- NTI recovery in the third quarter.
- Higher provisions due to the increase in loan portfolios mainly in consumer.
Results
Net interest income
4,599+6.5% (1)
Gross income
5,912+5.3% (1)
Operating income
3,954+5.6% (1)
Net attributable profit
1,965+1.7% (1)
Activity (2)
Performing loans and advances to customers under mangement
+7.9%Customers funds under management
+5.3%
Risks
NPL coverage ratio
154%
136%
NPL ratio
2.1%
2.4%
Cost of risk
3.07%
2.98%
DEC 18
SEP 19
(1) Year on year changes at constant exchange rate.
(2) Excluding repos.
Turkey
Millions of euros and year-on-year changes at constant exchange rate
Highlights
- Recovery of the activity in Turkish lira.
- Good performance of the net interest income.
- Operating expenses growth below the inflation rate.
- Positive evolution of the recurring revenue items offset by higher loan-loss provisions on financial assets.
Results
Net interest income
2,029+6.0% (1)
Gross income
2,548+4.7% (1)
Operating income
1,661+1.5% (1)
Net attributable profit
380-10.0% (1)
Activity (2)
Performing loans and advances to customers under mangement
-12.4%Customers funds under management
-3.9%
Risks
NPL coverage ratio
81%
75%
NPL ratio
5.3%
7.2%
Cost of risk
2.44%
1.99%
DEC 18
SEP 19
(1) Year on year changes at constant exchange rate.
(2) Excluding repos.
South America
Millions of euros and year-on-year changes at constant exchange rates
Highlights
- Positive evolution of activity in the main countries: Argentina, Colombia and Peru.
- Improved efficiency ratio, supported by the growth in net interest income and the reduction in operating expenses.
- Higher contribution from the NTI in the third quarter due to the positive performance of foreign currencies operations.
- Net attributable profit impacted by Argentina's inflation adjustment.
- Positive contribution of the main countries to the Group's attributable profit.
Results
Net interest income
2,376+12.9% (1)
Gross income
2,884+10.8% (1)
Operating income
1,733+21.8% (1)
Net attributable profit (3)
569+37.4% (1)
Activity (2)
Performing loans and advances to customers under mangement
+7.7%Customers funds under management
+7.1%
Risks
NPL coverage ratio
97%
97%
NPL ratio
4.3%
4.4%
Cost of risk
1.44%
1.91%
DEC 18
SEP 19
(1) Year on year changes at constant exchange rates.
(2) Excluding repos.
Rest of Eurasia
Millions of euros and year-on-year changes
Highlights
- Good performance in lending.
- Positive trend of net interest income, in an environment of negative interest rates.
- Controlled growth of operating expenses.
- Improved risk indicators.
Results
Net interest income
130+3.6% (1)
Gross income
338+6.4% (1)
Operating income
126+21.1% (1)
Net attributable profit
103+69.4% (1)
Activity (2)
Performing loans and advances to customers under mangement
+10.4%Customers funds under management
-12.9%
Risks
NPL coverage ratio
83%
97%
NPL ratio
1.7%
1.3%
Cost of risk
-0.11%
0.05%
DEC 18
SEP 19
(1) Year on year changes.
(2) Excluding repos.
(1) Gross income. Year-on-year change.
(2) Gross income. Year-on-year change at constant exchange rate.
(3) Gross income. Year-on-year changes at constant exchange rates.
Business Areas
Spain (1)
€4,307 Mill.
-4.2%
Millions of euros and year-on-year changes
Highlights
- Activity affected by the seasonality of the third quarter.
- Net Interest income influenced by lower ALCO contribution and the impact of IFRS 16.
- Continued decrease in operating expenses.
- Positive impact of the sale of non-performing and write-off portfolios on loan loss provisions and risk indicators.
Results
Net interest income
2,721-1.9% (1)
Gross income
4,307-4.2% (1)
Operating income
1,866-5.6% (1)
Net attributable profit
1.064-2.5% (1)
Activity (2)
Performing loans and advances to customers under mangement
-0.8%Customers funds under management
+1.8%
Risks
NPL coverage ratio
57%
59%
NPL ratio
5.1%
4.6%
Cost of risk
0.21%
0.08%
DEC 18
SEP 19
(1) Year on year changes.
(2) Excluding repos.
The United States (2)
€2,442 Mill.
+5.3%
Millions of euros and year-on-year changes at constant exchange rate
Highlights
- Moderation of the activity growth rate.
- Good performance of the recurring revenue items.
- Continued improvement of the efficiency ratio.
- Net attributable profit affected by the impairment on financial assets.
Results
Net interest income
1,813+2.4% (1)
Gross income
2,442+5.3% (1)
Operating income
989+14.7% (1)
Net attributable profit
478-17.0% (1)
Activity (2)
Performing loans and advances to customers under mangement
+1.4%Customers funds under management
+4.0%
Risks
NPL coverage ratio
85%
102%
NPL ratio
1.3%
1.1%
Cost of risk
0.39%
0.87%
DEC 18
SEP 19
(1) Year on year changes at constant exchange rate.
(2) Excluding repos.
Mexico (2)
€5,912 Mill.
+5.3%
Millions of euros and year-on-year changes at constant exchange rate
Highlights
- Good performance of the lending activity, boosted by growth in the retail portfolio.
- Positive trend of customer funds especially in time deposits and off-balance sheet funds.
- Net interest income growing in line with the activity.
- NTI recovery in the third quarter.
- Higher provisions due to the increase in loan portfolios mainly in consumer.
Results
Net interest income
4,599+6.5% (1)
Gross income
5,912+5.3% (1)
Operating income
3,954+5.6% (1)
Net attributable profit
1,965+1.7% (1)
Activity (2)
Performing loans and advances to customers under mangement
+7.9%Customers funds under management
+5.3%
Risks
NPL coverage ratio
154%
136%
NPL ratio
2.1%
2.4%
Cost of risk
3.07%
2.98%
DEC 18
SEP 19
(1) Year on year changes at constant exchange rate.
(2) Excluding repos.
Turkey (2)
€2,548 Mill.
+4.7%
Millions of euros and year-on-year changes at constant exchange rate
Highlights
- Recovery of the activity in Turkish lira.
- Good performance of the net interest income.
- Operating expenses growth below the inflation rate.
- Positive evolution of the recurring revenue items offset by higher loan-loss provisions on financial assets.
Results
Net interest income
2,029+6.0% (1)
Gross income
2,548+4.7% (1)
Operating income
1,661+1.5% (1)
Net attributable profit
380-10.0% (1)
Activity (2)
Performing loans and advances to customers under mangement
-12.4%Customers funds under management
-3.9%
Risks
NPL coverage ratio
81%
75%
NPL ratio
5.3%
7.2%
Cost of risk
2.44%
1.99%
DEC 18
SEP 19
(1) Year on year changes at constant exchange rate.
(2) Excluding repos.
South America
€2,884 Mill.
+10.8%
Millions of euros and year-on-year changes at constant exchange rates
Highlights
- Positive evolution of activity in the main countries: Argentina, Colombia and Peru.
- Improved efficiency ratio, supported by the growth in net interest income and the reduction in operating expenses.
- Higher contribution from the NTI in the third quarter due to the positive performance of foreign currencies operations.
- Net attributable profit impacted by Argentina's inflation adjustment.
- Positive contribution of the main countries to the Group's attributable profit.
Results
Net interest income
2,376+12.9% (1)
Gross income
2,884+10.8% (1)
Operating income
1,733+21.8% (1)
Net attributable profit (3)
569+37.4% (1)
Activity (2)
Performing loans and advances to customers under mangement
+7.7%Customers funds under management
+7.1%
Risks
NPL coverage ratio
97%
97%
NPL ratio
4.3%
4.4%
Cost of risk
1.44%
1.91%
DEC 18
SEP 19
(1) Year on year changes at constant exchange rates.
(2) Excluding repos.
Rest of Eurasia (1)
€338 Mill.
+6.4%
Millions of euros and year-on-year changes
Highlights
- Good performance in lending.
- Positive trend of net interest income, in an environment of negative interest rates.
- Controlled growth of operating expenses.
- Improved risk indicators.
Results
Net interest income
130+3.6% (1)
Gross income
338+6.4% (1)
Operating income
126+21.1% (1)
Net attributable profit
103+69.4% (1)
Activity (2)
Performing loans and advances to customers under mangement
+10.4%Customers funds under management
-12.9%
Risks
NPL coverage ratio
83%
97%
NPL ratio
1.7%
1.3%
Cost of risk
-0.11%
0.05%
DEC 18
SEP 19
(1) Year on year changes.
(2) Excluding repos.
(1) Gross income. Year-on-year change.
(2) Gross income. Year-on-year change at constant exchange rate.
(3) Gross income. Year-on-year changes at constant exchange rates.
News
Contact
 Shareholder attention line
912 24 98 21
 Subscription service
  Shareholder Office
 Contact email