Non Core Real Estate
Highlights
- Positive trend in the Spanish real-estate market.
- Agreement with Cerberus to reduce almost entirely the net real-estate exposure.
- Significant reduction in net losses.
Industry trends
The close of 2017 was positive for the real-estate market:
- Investment in housing grew by 2.4% between September and December, above the two previous quarters, according to data from the National Quarterly Accounting office of the National Institute of Statistics (INE).
- Sales of homes totaled some 535,000, a rise of 16.1% year-on-year, according to the information from the General Council of Spanish Notaries (CIEN). Job creation, the low cost of finance, household optimism and a smaller than initially expected impact from uncertainty regarding the economic policy as a result of events in Catalonia, have all contributed to this positive performance. As a result in January 2018 the growth of residential sales was maintained (+11.2% year-on-year).
- The price housing increased in the fourth quarter of 2017 by 7.2% year-on-year (INE data), up 0.6 percentage points on the previous quarter.
- The cost of mortgage lending remained at relatively low levels, therefore mortgage conditions remain attractive.
- Finally, construction activity is still responding to the strength of demand. According to the Ministry of Public Works, nearly 81,000 new housing construction permits were approved in 2017 for housing starts, up 26.2% on 2016. The figure for January 2018 was also positive, with approved permits up by 7.4% year-on-year.
Evolution of Net exposure to real-estate
(Million euros)
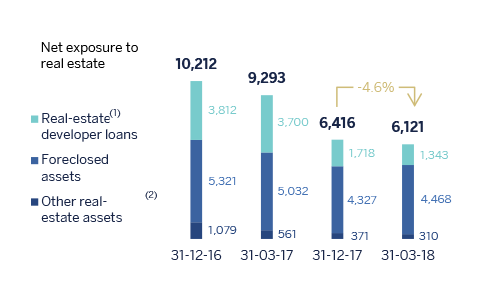
- (1) Compared to Bank of Spain's Transparency scope (Circular 5/2011 dated November 30), real-estate developer loans do not include €2.1Bn (March 2018) mainly related to developer performing loans transferred to the Banking Activity in Spain area.
- (2) Other real-estate assets not originated from foreclosures.
Coverage of real-estate exposure (Million euros as of 31-03-2018)
| Gross Value | Provisions | Net exposure | % Coverage | |
|---|---|---|---|---|
| Real-estate developer loans (1) | 2,853 | 1,510 | 1,343 | 53 |
| Performing | 461 | 74 | 387 | 16 |
| Finished properties | 315 | 47 | 269 | 15 |
| Construction in progress | 66 | 9 | 57 | 14 |
| Land | 72 | 17 | 55 | 24 |
| Without collateral and other | 8 | 1 | 7 | 18 |
| NPL | 2,392 | 1,436 | 956 | 60 |
| Finished properties | 1,091 | 570 | 521 | 52 |
| Construction in progress | 113 | 54 | 59 | 48 |
| Land | 1.006 | 668 | 337 | 66 |
| Without collateral and other | 182 | 143 | 39 | 79 |
| Foreclosed assets | 11,541 | 7,073 | 4,468 | 61 |
| Finished properties | 7,036 | 3,635 | 3,401 | 52 |
| Construction in progress | 541 | 365 | 176 | 67 |
| Land | 3,964 | 3,073 | 891 | 78 |
| Other real-estate assets (2) | 958 | 648 | 310 | 68 |
| Real-estate exposure | 15,352 | 9,231 | 6,121 | 60 |
- (1) Compared to Bank of Spain's Transparency scope (Circular 5/2011 dated November 30), real-estate developer loans do not include €2.1 Bn (March 2018) mainly related to developer performing loans transferred to the Banking activity in Spain unit.
- (2) Other real-estate assets not originated from foreclosures.
Activity
BBVA is moving forward with the process of closing the sale announced in the fourth quarter of 2017. Under the deal, most of BBVA's real-estate business in Spain will be transferred to a company, 80% of whose shares will then be sold to Cerberus in the second half of 2018. Thus, during this period, BBVA continues to manage real-estate assets subject to the agreement according to normal business and control procedures.
Overall, as of 31-Mar-2018, net exposure was €6,121m, a decline of 4.6% since December 2017.
Total real-estate exposure, including loans to developers, foreclosures and other assets, had a coverage ratio of 60% at the close of March 2018. The coverage ratio of foreclosed assets was 61%.
Non-performing balances fell again, thanks to a decline of new additions to NPL over the quarter. The NPL coverage ratio closed at 60%.
In addition, during the quarter, BBVA placed a public share offering of a total of 11,619,724 shares of its subsidiary Metrovacesa, accounting for 26.9% of its stake (7.7% of total capital). After the sale BBVA's participation in Metrovacesa reduced from 28.51% to 20.85%
Results
This business area posted a cumulative loss of €27m, which compares with a loss of €106m in the same period the previous year.
Financial statements (Million euros)
| IFRS 9 | IAS 39 | |||||
|---|---|---|---|---|---|---|
| Income statement | 1 Q 18 | ∆% | 1 Q 17 | |||
| Net interest income | 7 | (27.9) | 10 | |||
| Net fees and commissions | 0 | (71.3) | 2 | |||
| Net trading income | 1 | n.s. | (0) | |||
| Other income/expenses | (11) | (65.2) | (32) | |||
| Gross income | (3) | (84.6) | (21) | |||
| Operating expenses | (20) | (21.1) | (26) | |||
| Personnel expenses | (13) | 1.9 | (12) | |||
| Other administrative expenses | (6) | (13.9) | (7) | |||
| Depreciation | (2) | (72.2) | (7) | |||
| Operating income | (24) | (49.6) | (47) | |||
| Impairment on financial assets (net) | (55) | n.s. | (4) | |||
| Provisions (net) and other gains (losses) | 47 | n.s. | (86) | |||
| Profit/(loss) before tax | (32) | (76.9) | (137) | |||
| Income tax | 5 | (83.8) | 31 | |||
| Profit/(loss) for the year | (27) | (74.9) | (106) | |||
| Non-controlling interests | - | - | - | |||
| Net attributable profit | (27) | (75.0) | (106) | |||
| IFRS 9 | IAS 39 | |||||
|---|---|---|---|---|---|---|
| Balance sheet | 31-03-18 | ∆% | 31-12-17 | |||
| Cash, cash balances at central banks and other demand deposits | 10 | (14.0) | 12 | |||
| Financial assets designated at fair value | 1,649 | n.s. | 9 | |||
| of which Loans and advances | 1,663 | n.s. | - | |||
| Financial assets at amortized cost | 1,396 | (60.3) | 3,521 | |||
| of which Loans and advances | 1,391 | (60.5) | 3,521 | |||
| Inter-area positions | - | - | - | |||
| Tangible assets | 6 | n.s. | - | |||
| Other assets | 6,124 | (0.8) | 6,172 | |||
| Total assets/liabilities and equity | 9,186 | (5.4) | 9,714 | |||
| Financial liabilities held for trading and designated at fair value through profit or loss | - | - | - | |||
| Deposits from central banks and credit institutions | 102 | n.s. | - | |||
| Deposits from customers | 10 | (19.3) | 13 | |||
| Debt certificates | 750 | (4.5) | 785 | |||
| Inter-area positions | 5,323 | (7.8) | 5,775 | |||
| Other liabilities | - | - | - | |||
| Economic capital allocated | 3,001 | (4.5) | 3,141 | |||
| Memorandum item: | ||||||
| Risk-weighted assets | 9,272 | (4.3) | 9,692 | |||