South America
Highlights
- Activity continues to evolve at a good pace.
- Good performance in all income statement lines.
- Expenses growth below the increase rate of gross income.
Business activity (1)
(Year-on-year change at constant exchange rates. Data as of 31-03-2018)
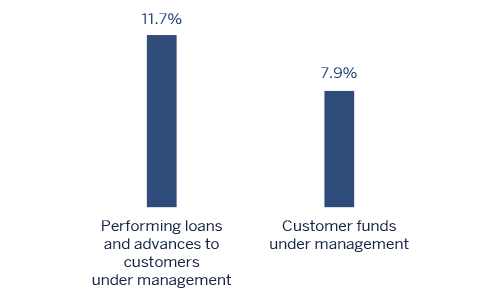
(1) Excluding repos.
Net interest income/ATAs
(Percentage. Constant exchange rates)

Operating income
(Million euros at constant exchange rates)
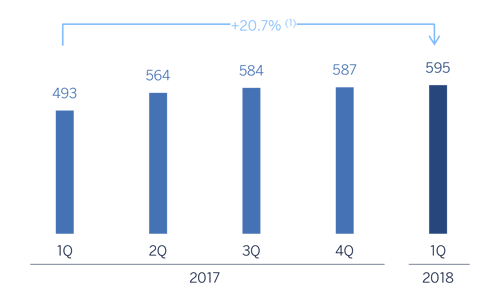
(1)At current exchange rates: +13.1%.
Net attributable profit
(Million euros at constant exchange rates)
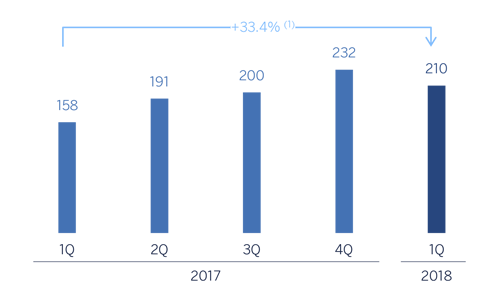
(1) At current exchange rates: +11.6%.
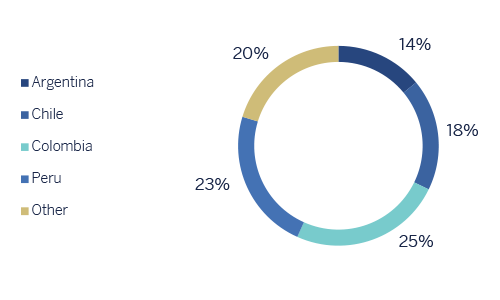
Breakdown of performing loans under management (1)
(31-03-2018)
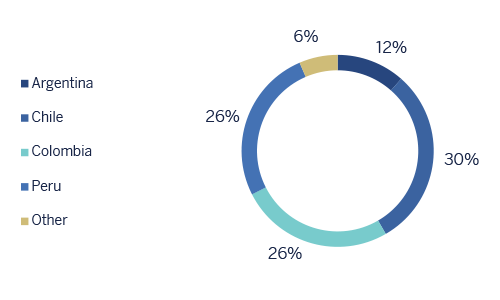
(1) Excluding repos.
Breakdown of customer funds under management (1)
(31-03-2018)
(1) Excluding repos.
Macro and industry trends
The economies of South America consolidated their economic recovery. This is mainly the result of the following factors: i) increases in the prices of most commodities exported by the region and ii) the reduction of tensions in the financial markets. The above, together with reduced political uncertainty, is resulting in an expansion of investment and a strengthening of consumption. In addition, consumer confidence is steadily improving, as inflation falls, although the weak labor market may continue to be a liability.
With respect to the performance of the currencies, exchange rates have been relatively stable in recent months, which has combined with continued weak domestic demand to moderate inflation in most countries. In this context, monetary policy will remain expansive in most of the countries in the region, except in Argentina.
Regarding the banking systems within BBVA’s regional footprint, the macroeconomic backdrop and reduced levels of banking penetration in these countries in aggregate terms (obviously with differences between countries) led to strong results in terms of the main indicators of profitability and solvency, while non-performing loans remained under control. In addition, there has been sustained growth in lending and deposits.
Activity
All the comments below on rates of change, for both activity and earnings, will be given at constant exchange rate, unless expressly stated otherwise. These rates, together with changes at the current exchange rate, can be seen in the attached tables of financial statements and relevant business indicators.
Lending (performing loans under management) in South America grew by 1.6% over the quarter and closed 11.7% higher than the volume of 31-Mar-2017. By country, the most significant increase was in Argentina (up 6.9% in the quarter and up 73.9% year-on-year).
Regarding asset quality portfolio, there was a slight increase in the NPL ratio, which closed the quarter at 3.6%, while the NPL coverage ratio fell slightly to 93%.
Customer funds have increased by 1.5% so far this year (up 7.9% year-on-year), supported by off-balance-sheet funds (up 9.5% in the quarter). By country, there was a positive trend in Argentina (up 12.4%) and Colombia (2.3%).
Results
In the first quarter of 2018, South America generated a net attributable profit of €210m, which represents year-on-year growth of 33.4% (up 13.8% at current exchange rates). The key aspects of the income statement in this area were:
- A year-on-year increase of 15.4% in gross income, thanks to the good performance of more recurring revenue items and greater contribution from NTI. Net interest income (up 14.7%) grew faster than the year-on-year increase in lending, thanks to greater volume and good price management. Net fees and commissions rose 10.6% in the same period.
- Growth of operating expenses (up 9.4%) below the growth of gross income in the area, as a result of the cost control implemented in all the countries.
- Slight increase of the impairment losses on financial assets (up 2.2%), well below the increase in lending in the area. As a result, the cumulative cost of risk at the close of March stood at 1.37%.
By country, revenues performed very well in Argentina, with a year-on-year growth in gross income of 47.5%. This increase was based both on the performance of recurring revenue (boosted by higher volumes of business) and in the positive performance of NTI (mainly due to exchange rates). Operating expenses grew below the rate of gross income, and impairment losses on financial assets also grew below the figure for lending. As a result, there was a significant yearon-year increase in net attributable profit (up 76.5%). In Chile, net interest income performed well (driven by the positive trend in lending and good management of customer spreads) while net fees and commissions and NTI declined. The above, together with controlled growth in expenses and the cost of risk, generated a net attributable profit that was 6.0% lower than the same period of the previous year. In Colombia, the increase in earnings was based on the good performance of net interest income (due to a positive performance in activity and customer spreads) and an increase in fees and commissions, which boosted gross income (up 13.4%), above the rate of growth of operating expenses (up 5.8%). Together with the reduction of impairment losses on financial assets, this led to a year-on-year increase of 91.6% in the net attributed profit. In Peru, net attributable profit fell by 4.4%, as the good performance of NTI and moderate growth in recurring revenue were largely offset by the increase in loan-loss provisions.
Financial statements and relevant business indicators (Million euros and percentage)
| IFRS 9 | IAS 39 | |||||
|---|---|---|---|---|---|---|
| Income statement | 1 Q 18 | ∆% | ∆% (1) | 1 Q 17 | ||
| Net interest income | 792 | (1.9) | 14.7 | 807 | ||
| Net fees and commissions | 163 | (7.5) | 10.6 | 176 | ||
| Net trading income | 112 | (2.7) | 15.1 | 115 | ||
| Other income/expenses | 12 | 123.5 | n.s. | 5 | ||
| Gross income | 1,079 | (2.3) | 15.4 | 1,104 | ||
| Operating expenses | (484) | (8.9) | 9.4 | (531) | ||
| Personnel expenses | (247) | (10.8) | 7.6 | (276) | ||
| Other administrative expenses | (207) | (8.0) | 10.5 | (225) | ||
| Depreciation | (30) | 1.2 | 17.8 | (30) | ||
| Operating income | 595 | 3.8 | 20.7 | 573 | ||
| Impaiment on financial assets not measured at fair value through profit or loss | (167) | (10.2) | 2.2 | (186) | ||
| Provisions or reversal of provisions and other results | (11) | (38.3) | (27.6) | (18) | ||
| Profit/(loss) before tax | 417 | 12.9 | 32.6 | 369 | ||
| Income tax | (128) | 16.5 | 37.8 | (110) | ||
| Profit/(loss) for the year | 289 | 11.4 | 30.4 | 260 | ||
| Non-controlling interests | (79) | 5.5 | 23.1 | (75) | ||
| Net attributable profit | 210 | 13.8 | 33.4 | 185 | ||
| IFRS 9 | IAS 39 | |||||
|---|---|---|---|---|---|---|
| Balance sheets | 31-03-18 | ∆% | ∆%(1) | 31-12-17 | ||
| Cash, cash balances at central banks and other demand deposits | 7,921 | (12.4) | (10.5) | 9,039 | ||
| Financial assets | 10,176 | (12.5) | (11.8) | 11,627 | ||
| of which Loans and advances | 361 | n.s. | n.s. | 3 | ||
| Loans and receivables | 51,934 | 1.4 | 2.5 | 51,207 | ||
| of which loans and advances to customers | 48,400 | 0.3 | 1.3 | 48,272 | ||
| Tangible assets | 688 | (5.2) | (2.1) | 725 | ||
| Other assets | 1,251 | (38.6) | (38.0) | 2,038 | ||
| Total assets/liabilities and equity | 71,969 | (3.6) | (2.4) | 74,636 | ||
| Financial liabilities held for trading and designated at fair value through profit or loss | 2,575 | (8.8) | (8.4) | 2,823 | ||
| Deposits from central banks and credit institutions | 5,257 | (30.4) | (29.9) | 7,552 | ||
| Deposits from customers | 45,230 | (1.0) | 0.2 | 45,666 | ||
| Debt certificates | 7,412 | 2.8 | 3.8 | 7,209 | ||
| Other liabilities | 8,572 | 0.8 | 3.2 | 8,505 | ||
| Economic capital allocated | 2,923 | 1.5 | 2.4 | 2,881 | ||
| Relevant business indicators | 31-03-18 | ∆% | ∆%(1) | 31-12-17 |
|---|---|---|---|---|
| Performing loans and advances to customers under management (2) | 48,355 | 0.6 | 1.6 | 48,068 |
| Non-performing loans and guarantees given | 1,998 | 6.0 | 5.7 | 1,884 |
| Customer deposits under management (2) | 45,234 | (1.6) | (0.5) | 45,970 |
| Off-balance sheet funds (3) | 13,018 | 6.7 | 9.4 | 12,197 |
| Risk-weighted assets | 55,718 | (0.5) | 1.1 | 55,975 |
| Efficiency ratio (%) | 44.8 | 45.1 | ||
| NPL ratio (%) | 3.6 | 3.4 | ||
| NPL coverage ratio (%) | 93 | 89 | ||
| Cost of risk (%) | 1.37 | 1.32 |
- (1) Figures at constant exchange rates.
- (2) Excluding repos.
- (3) Excluding repos and including specific marketable debt securities.
- (4) Includes mutual funds, pension funds and other off-balance sheet funds.
South America. Data per country (Million euros)
| IFRS 9 | IAS 39 | IFRS 9 | IAS 39 | |||||
|---|---|---|---|---|---|---|---|---|
| Operating income | Net attributable profit | |||||||
| Country | 1 Q 18 | ∆% | ∆% (1) | 1 Q 17 | 1 Q 18 | ∆% | ∆% (1) | 1 Q 17 |
| Argentina | 130 | 28.3 | 85.9 | 101 | 52 | 21.8 | 76.5 | 43 |
| Chile | 107 | (4.1) | 1.6 | 112 | 45 | (11.3) | (6.0) | 51 |
| Colombia | 161 | 5.0 | 18.3 | 154 | 64 | 70.1 | 91.6 | 37 |
| Peru | 164 | (9.3) | 3.2 | 181 | 36 | (15.9) | (4.4) | 43 |
| Other countries (1) | 32 | 27.8 | 46.9 | 25 | 13 | 23.4 | 47.4 | 11 |
| Total | 595 | 3.8 | 20.7 | 573 | 210 | 13.8 | 33.4 | 185 |
- (1) Figures at constant exchange rates.
- (2) Venezuela, Paraguay, Uruguay and Bolivia. Additionally, it includes eliminations and other charges.
South America. Relevant business indicators per country (Million euros)
| Argentina | Chile | Colombia | Peru | |||||
|---|---|---|---|---|---|---|---|---|
| 31-03-18 | 31-12-17 | 31-03-18 | 31-12-17 | 31-03-18 | 31-12-17 | 31-03-18 | 31-12-17 | |
| Performing loans and advances to customers under management (1.2) | 5,562 | 5,201 | 14,577 | 14,447 | 12,509 | 12,451 | 12,575 | 12,643 |
| Non-performing loans and guarantees given (1) | 46 | 41 | 442 | 416 | 744 | 704 | 649 | 629 |
| Customer deposits under management (1.3) | 6,436 | 6,158 | 9,047 | 9,575 | 13,039 | 12,798 | 11,755 | 11,907 |
| Off-balance sheet funds (1.4) | 1,765 | 1,140 | 1,501 | 1,282 | 1,257 | 1,170 | 1,618 | 1,543 |
| Risk-weighted assets | 8,679 | 9,364 | 14,730 | 14,431 | 12,921 | 12,299 | 14,634 | 14,879 |
| Efficiency ratio (%) | 53.7 | 56.1 | 45.0 | 45.2 | 36.4 | 36.0 | 37.1 | 35.6 |
| NPL ratio (%) | 0.8 | 0.8 | 2.7 | 2.6 | 5.6 | 5.3 | 4.0 | 3.8 |
| NPL coverage ratio (%) | 202 | 198 | 62 | 60 | 97 | 88 | 102 | 100 |
| Cost of risk (%) | 1.09 | 0.61 | 0.90 | 0.76 | 1.83 | 2.59 | 1.62 | 1.14 |
- (1) Figures at constant exchange rates.
- (2) Excluding repos.
- (3) Excluding repos and including specific marketable debt securities.
- (4) Includes mutual funds, pension funds and other off-balance-sheet funds.