Mexico
Highlights
- In activity, sound growth of retail portfolios.
- Expenses growth remains below the gross income.
- Double-digit year-on-year growth in net attributable profit.
- Asset quality indicators continue improving.
Business activity (1)
(Year-on-year change at constant exchange rate. Data as of 31-03-2018)
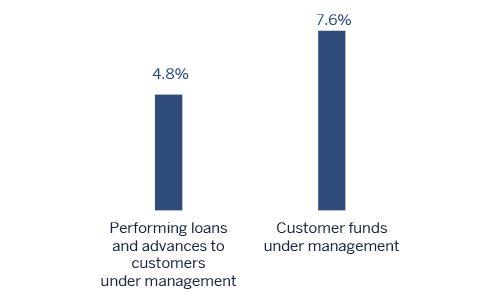
(1) Excluding repos.
Net interest income/ATAs
(Percentage. Constant exchange rate)

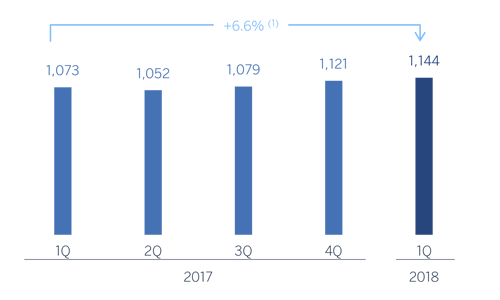
Operating income
(Million euros at constant exchange rate)
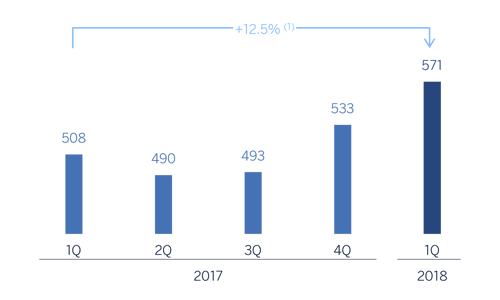
Net attributable profit
(Million euros at constant exchange rate)
(1) At current exchange rate: 0.0%.
(1) At current exchange rate: +5.5%.
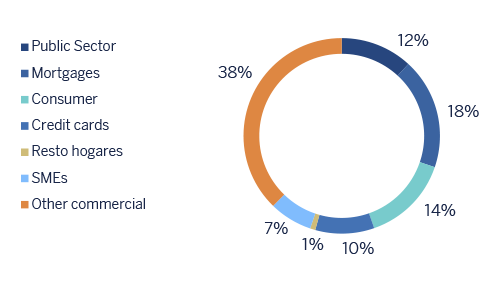
Breakdown of performing loans under management (1)
(31-03-2018)
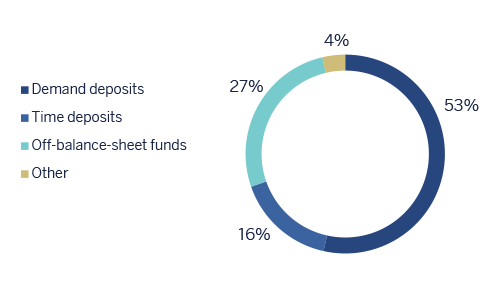
Breakdown of customer funds under management (1)
(31-03-2018)
(1) Excluding repos.
(1) Excluding repos.
Macro and industry trends
The activity of Mexico closed 2017 with an average growth of 2.0%. After the negative effect of natural disasters in the third quarter, there was a recovery in the fourth. On the demand side, exports of manufactured goods and, above all, consumption were the most dynamic components. They are expected to continue to be so during this year, despite the uncertainty regarding the results of the elections, and about the NAFTA negotiations.
Inflation slowed during the initial months of 2018, following the strong increase registered in 2017. This behavior explains the recently contained depreciation of the peso against the euro, which eases the pressure on prices and suggest that further interest-rate hikes by Banxico will not be necessary.
For yet another quarter, the Mexican banking system showed excellent levels of solvency and asset quality. According to the latest available information from the National Banking Commission and Securities (CNBV) in February 2018, activity remained as strong as in previous quarters, with annual growth in the volume of deposits and lending at 9.6% and 10.6%, respectively. Finally, the NPL ratio was stable (2.2%) and there was a slight reduction in the NPL coverage ratio (151%).
Activity
All the comments below on rates of change, for both activity and earnings, will be given at constant exchange rate, unless expressly stated otherwise. These rates, together with changes at current exchange rate, can be seen in the attached tables of financial statements and relevant business indicators.
Lending (performing loans under management) remained flat in the area during the first quarter of 2018 (up 0.5% from December 2017), showing a year-on-year rise of 4.8%. BBVA in Mexico continued to maintain its leadership position in the country, with a market share of 22.6% in performing loans, according to local figures from the CNBV at the close of February 2018.
With respect to its composition, according to data for the close of the first quarter of 2018, the relative weight of the wholesale and retail businesses remains unchanged, at approximately 50% each. The wholesale portfolio reported a year-on-year increase of 2.7%, but a decline of 3.5% in the quarter, as a result of the high level of uncertainty in the country regarding the results of the upcoming elections. The retail portfolio grew by 2.7% in the quarter (up 7.7% year-on-year), strongly supported by auto loans, which rose by 1.2% between January and March 2018 (up 5.5% year-on-year). Lastly, credit cards increased by 5.2% year-on-year.
This trend has been accompanied by an improvement in asset quality indicators. The NPL and NPL coverage ratios closed the quarter at 2.1% and 153% respectively. The growth in the NPL coverage ratio was basically due to the increase in provisions, as a result of the effects of the initial implementation of IFRS 9.
Total customer funds (customer deposits under management, mutual funds and other off-balance-sheet funds) showed a quarterly decline of 2.6%, but a rise of 7.6% year-on-year, mostly explained by time deposits (down 0.6% over the quarter, but up 18.8% year-on-year), as demand deposits maintained their positive trend, with growth of 4.1% over the year. BBVA in Mexico has a profitable funding mix, with low-cost deposits accounting for around 70% of total customer deposits under management. Lastly, mutual funds increased by 1.9% between January and March 2018 (up 11.1% year-on-year).
Results
The highlights of the income statement for Mexico for the first quarter of 2018 are summarized below:
- Positive performance of net interest income, which increased 8.2% year-on-year, driven primarily by greater volumes of activity.
- Good performance of net fees and commissions, with growth of 6.3% over the last twelve months. They remained strongly influenced by an increased volume of transactions with credit card customers, mutual funds, investment banking activities, and fees coming from online banking.
- NTI the positive results derived from the valuation of the ALCO portfolios, is tarnished by the high revenues of the Global Markets Unit registered in the first quarter of 2017, leading to a decrease of -1.0% on the year-on-year comparison.
- In other income/expenses the comparison was also negative year-on-year (down 30.6%), mainly explained by an extraordinary income from insurance activity in the first quarter of 2017.
- Operating expenses continued to grow at a controlled pace (up 4.8% year-on-year) and below the area's gross income growth of 6.0%. As a result, the efficiency ratio has continued to improve and stood at 33.1% at the close of the first quarter of the year.
- Good risk management has been reflected in the 0.6% decline in impairment losses on financial assets. As a result the cumulative cost of risk in the area closed at 3.18% from 3.24% as of December 2017.
- Other gains (losses) included the extraordinary income from the sale of BBVA Bancomer's stake in a real-estate development.
Overall, BBVA in Mexico posted a net attributable profit in the first quarter of €571m, a year-on-year increase of 12.5%.
Financial statements and relevant business indicators (Million euros and percentage)
| IFRS 9 | IAS 39 | ||||
|---|---|---|---|---|---|
| Income statement | 1Q 18 | ∆% | ∆%(1) | 1Q 17 | |
| Net interest income | 1,317 | 1.6 | 8.2 | 1,297 | |
| Net fees and commissions | 281 | (0.3) | 6.3 | 282 | |
| Net trading income | 67 | (7.1) | (1.0) | 73 | |
| Other income/expenses | 45 | (34.9) | (30.6) | 69 | |
| Gross income | 1.711 | (0.6) | 6.0 | 1.720 | |
| Operating expenses | (567) | (1.7) | 4.8 | (576) | |
| Personnel expenses | (246) | (0.2) | 6.4 | (247) | |
| Other administrative expenses | (260) | (2.6) | 3.8 | (267) | |
| Depreciation | (60) | (3.7) | 2.7 | (63) | |
| Operating income | 1,144 | 0.0 | 6.6 | 1,144 | |
| Impairment on financial assets (net) | (377) | (6.7) | (0.6) | (404) | |
| Provisions (net) and other gains (losses) | 21 | n.s. | n.s. | (4) | |
| Profit/(loss) before tax | 788 | 7.0 | 14.1 | 736 | |
| Income tax | (216) | 11.2 | 18.5 | (194) | |
| Profit/(loss) for the year | 572 | 5.5 | 12.5 | 542 | |
| Non-controlling interests | (0) | 3.1 | 9.9 | (0) | |
| Net attributable profit | 571 | 5.5 | 12.5 | 541 | |
| IFRS 9 | IAS 39 | ||||
|---|---|---|---|---|---|
| Balance sheets | 31-03-18 | ∆% | ∆%(1) | 31-12-17 | |
| Cash, cash balances at central banks and other demand deposits | 7,749 | (12.3) | (16.5) | 8,833 | |
| Financial assets designated at fair value | 27,930 | (2.4) | (7.1) | 28,627 | |
| of which Loans and advances | 768 | (50.7) | (53.1) | 1,558 | |
| Financial assets at amortized cost | 53,233 | 11.6 | 6.3 | 47,691 | |
| of which loans and advances to customers | 47,247 | 3.2 | (1.7) | 45,768 | |
| Tangible assets | 1,791 | 2.4 | (2.5) | 1,749 | |
| Other assets | 2,572 | (64.1) | (65.8) | 7,160 | |
| Total assets/liabilities and equity | 93,275 | (0.8) | (5.6) | 94,061 | |
| Financial liabilities held for trading and designated at fair value through profit or loss | 19,167 | 103.8 | 94.0 | 9,405 | |
| Deposits from central banks and credit institutions | 1,448 | (75.3) | (76.4) | 5,853 | |
| Deposits from customers | 47,522 | (4.9) | (9.5) | 49,964 | |
| Debt certificates | 7.903 | 8,1 | 2,9 | 7.312 | |
| Other liabilities | 13,648 | (22.6) | (26.3) | 17,627 | |
| Economic capital allocated | 3,588 | (8.0) | (12.4) | 3,901 | |
| Relevant business indicators | 31-03-18 | ∆% | ∆%(1) | 31-12-17 |
|---|---|---|---|---|
| Performing loans and advances to customers under management (2) | 47,243 | 4.5 | (0.5) | 45,196 |
| Non-performing loans and guarantees given | 1,095 | (2.6) | (7.3) | 1,124 |
| Customer deposits under management (2) | 46,024 | 2.1 | (2.8) | 45,093 |
| Off-balance sheet funds (4) | 20,033 | 2.9 | (2.1) | 19,472 |
| Risk-weighted assets | 47,769 | 6.3 | 1.2 | 44,941 |
| Efficiency ratio (%) | 33.1 | 34.4 | ||
| NPL ratio (%) | 2.1 | 2.3 | ||
| NPL coverage ratio (%) | 153 | 123 | ||
| Cost of risk (%) | 3.18 | 3.24 |
(1) Figures at constant exchange rate.
(2) Excluding repos.
(3) Includes mutual funds, pension funds and other off-balance sheet funds.