Banking activity in Spain
Highlights
- Activity impacted by seasonality.
- Good performance of net fees and commissions.
- Improvement of efficiency due to the continuous reduction of expenses.
- Lower impairments, solid asset-quality indicators.
Business activity (1)
(Year-on-year change. Data as of 31-03-2018)
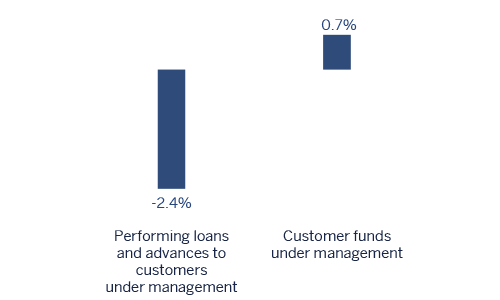
(1) Excluding repos.
Net interest income/ATAs
(Percentage)

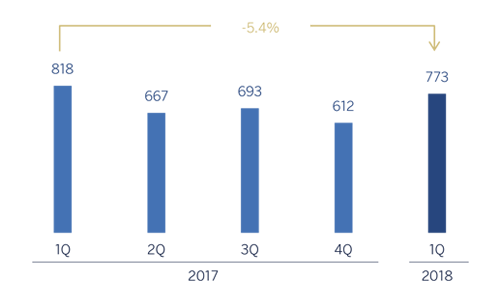
Operating income (Million euros)
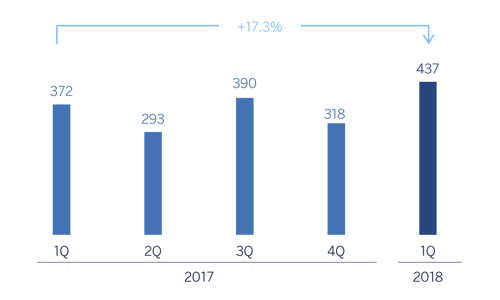
Net attributable profit (Million euros)
Breakdown of performing loans under management (1)
(31-03-2018)

Breakdown of customer funds under management (1)
(31-03-2018)

(1) Excluding repos.
(1) Excluding repos.
Macro and industry trends
The Spanish economy closed 2017 with a solid growth of 3.1%, reflecting what a still strong domestic demand, despite the political uncertainty. Exports and investment continued to show signs of recovery, although consumption moderated slightly. Overall, both internal fundamentals, related to continued improvements in employment and favorable financial conditions, and external fundamentals, associated with the recovery of global trade, are still sound. They will continue to drive growth in the early months of 2018, although a slight moderation is expected for the year as a whole.
Regarding the Spanish banking system and according to data from February 2018 (latest published data) from the Bank of Spain, the total volume of lending to the private sector (household and corporate) continued to decline year-on-year (down 2.4%). However, since August there have been signs of a slight upturn in the total volume of credit in the economy, though the signs are still too weak to confirm that there has been a turning point. Non-performing loans in the sector continued to improve, with their volume down 16.7% year-on-year as of February 2018. As a result, the NPL ratio declined to 7.8% as of February 2018. The system's liquidity position continues to be comfortable: the funding gap (difference between the volume of loans and total deposits) fell to the €105.5 billion, 4.1% of the total balance sheet of the system.
Activity
As of 31-Mar-2018, lending (performing loans under management) was down by 2.4% compared to the figure at the end of December 2017, due basically to the reduction in the corporates (down 9.6 %) and in the mortgages (down 1.1%). In contrast, consumer finance remained strong (up 2.2%), influenced by the positive performance of new production, which posted year-on-year growth of 22.9%, according to cumulative figures through March 2018.
In asset quality, there was a reduction in the quarter of the balance of non-performing loans in the area, with the NPL ratio falling over the last three months by 15 basis points to 5.4%. The NPL coverage ratio also increased to 57%.
Customer deposits under management fell by 3.0% compared to the close of December 2017 (down 2.3% in the last twelve months). By products, there was a further decline in time deposits (down 15.1% in the quarter), strongly focused on the segment of wholesale clients. It was again partially offset by the increase in demand deposits (up 1.6% over the last three months) and off-balance-sheet funds, which retained their positive trend, despite the unfavorable performance of the markets, with year-to-date growth of 1.6%. This performance continued to be largely supported by the growth in mutual funds (up 3.2%).
Results
The year-on-year highlights of the income statement in the area were:
- Net interest income in the first quarter declined year-on-year by 1.6% and quarterly by 2.7%. The lower volume of loans and the smaller contribution from wholesale portfolios explains these declines
- Positive performance of net fees and commissions (up 7.8%), which offset the decline in net interest income. It stands out the significant contribution from fees from mutual funds and pensions, whose quarterly growth was 6.4%.
- Lower contribution from NTI compared with the same quarter of the previous year (down 26.0%), associated with lower portfolio sales, but an improvement on the figure for the last three months of 2017 (up 3.3%), thanks to the positive performance of the Global Markets unit.
- Reduction in other income/expenses. Net earnings from the insurance business grew by 0.5% (up 1.6% over the quarter).
- As a result, there was a decline in gross income e of 4.8%, although the rise over the quarter was 10.3%.
- Operating expenses continued the downward trend observed in previous periods, both over the last twelve months (down 4.2%) and over the quarter (down 1.4%). The efficiency ratio closed at 51.5%, below the figure in 2017 (54.9%), and operating income fell by 5.4%, although in the quarter was an increase of 26.4%.
- Decline in impairment losses on financial assets (down 57.4% year-on-year and down 49.1% over the last three months) explained by lower loan-loss provisions in large customers. As a result, the cumulative cost of risk stood at 0.17% as of 31-Mar-2018.
- Lastly, provisions (net) and other gains (losses) were favorable, with a year-on-year decline of 32.5%.
As a result, the net attributable profit generated by Banking Activity in Spain in the first quarter of 2018 stood at €437m, a year-on-year increase of 17.3%, strongly influenced by the positive performance of net fees and commissions, operating expenses and loan-loss provisions.
Financial statements and relevant business indicators (Million euros and percentage)
| IFRS 9 | IAS 39 | |||||
|---|---|---|---|---|---|---|
| Income statement | 1Q 18 | ∆% | 1Q 17 | |||
| Net interest income | 921 | (1,6) | 935 | |||
| Net fees and commissions | 412 | 7,8 | 382 | |||
| Net trading income | 167 | (26,0) | 225 | |||
| Other income/expenses | 97 | (27,6) | 134 | |||
| of which insurance activities (1) | 108 | 0,5 | 108 | |||
| Gross income | 1.596 | (4,8) | 1.676 | |||
| Operating expenses | (823) | (4,2) | (859) | |||
| Personnel expenses | (473) | (1,4) | (479) | |||
| Other administrative expenses | (279) | (6,7) | (299) | |||
| Depreciation | (71) | (12,0) | (81) | |||
| Operating income | 773 | (5,4) | 818 | |||
| Impairment on financial assets not measured at fair value through profit or loss | (70) | (57,4) | (165) | |||
| Provisions or reversal of provisions and other results | (87) | (32,5) | (129) | |||
| Profit/(loss) before tax | 616 | 17,7 | 523 | |||
| Income tax | (178) | 18,4 | (150) | |||
| Profit/(loss) for the year | 438 | 17,3 | 373 | |||
| Non-controlling interests | (1) | 20,7 | (1) | |||
| Net attributable profit | 437 | 17,3 | 372 | |||
- (1) Includes premiums received net of estimated technical insurance reserves.
| IFRS 9 | IAS 39 | |||||
|---|---|---|---|---|---|---|
| Balance sheets | 31-03-18 | ∆% | 31-12-17 | |||
| Cash, cash balances at central banks and other demand deposits | 19,306 | 43.4 | 13,463 | |||
| Financial assets | 103,371 | 30.0 | 79,501 | |||
| of which Loans and advances | 23,453 | n.s. | 1,312 | |||
| Financial assets at amortized cost | 192,622 | (13.0) | 221,391 | |||
| of which loans and advances to customers | 167,524 | (8,5) | 183,172 | |||
| Inter-area positions | 1,897 | 5.0 | 1,806 | |||
| Tangible assets | 970 | 10.7 | 877 | |||
| Other assets | 4,764 | 100.2 | 2,380 | |||
| Total assets/liabilities and equity | 322.929 | 1.1 | 319,417 | |||
| Financial liabilities held for trading and designated at fair value through profit or loss | 70,607 | 91.8 | 36,817 | |||
| Deposits from central banks and credit institutions | 42,287 | (32.0) | 62,226 | |||
| Deposits from customers | 169,096 | (4.9) | 177,763 | |||
| Debt certificates | 31.680 | (4.9) | 33,301 | |||
| Inter-area positions | - | - | - | |||
| Other liabilities | 268 | (31.5) | 391 | |||
| Economic capital allocated | 8,991 | 0.8 | 8,920 | |||
| Relevant business indicators | 31-03-18 | ∆% | 31-12-17 |
|---|---|---|---|
| Loans and advances to customers (gross) (1) | 163,290 | (2.4) | 167,291 |
| Non-performing loans and contingent liabilities | 10,377 | (4.2) | 10,833 |
| Customer deposits under management (2) | 169,592 | (3.0) | 174,822 |
| Off-balance sheet funds (3) | 63,048 | 1.6 | 62,054 |
| Risk-weighted assets | 103,229 | (4.5) | 108,093 |
| Efficiency ratio (%) | 51.5 | 54.9 | |
| NPL ratio (%) | 5.4 | 5.5 | |
| NPL coverage ratio (%) | 57 | 50 | |
| Cost of risk (%) | 0.17 | 0.32 |
- (1) Excluding repos.
- (2) Includes mutual funds. pension funds and other off-balance-sheet funds.