Turkey
Highlights
- Double-digit year-on-year growth in activity indicators.
- Sound growth of the recurring revenue items.
- Control of operating expenses that grow below the level of inflation.
- Risk indicators affected by the one-time impairment of the commercial portfolio.
Business activity (1)
(Year-on-year change at constant exchange rate. Data as of 31-03-2018)
(1) Excluding repos.
Net interest income/ATAs
(Percentage. Constant exchange rate)

Operating income
(Million euros at constant exchange rate)
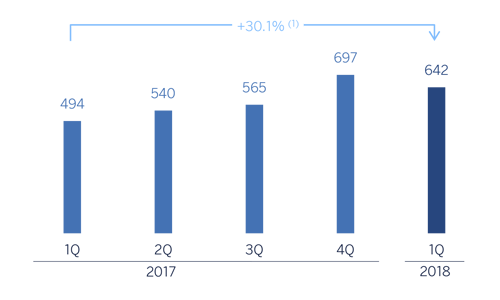
(1) At current exchange rate: +9.2%.
Net attributable profit
(Million euros at constant exchange rate)
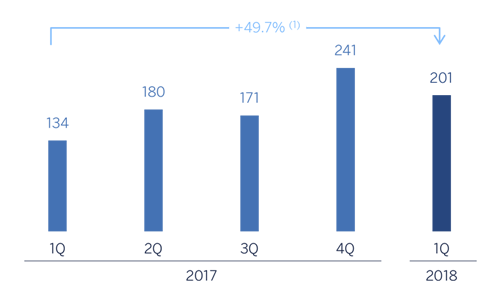
(1) At current exchange rate: +25.7%.
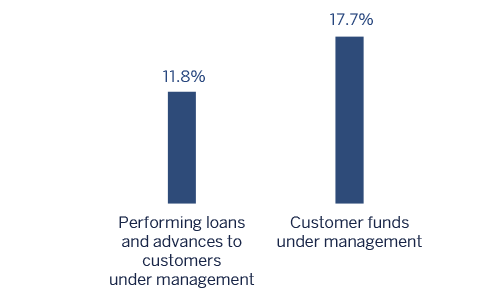
Breakdown of performing loans under management (1)
(31-03-2018)

(1) Excluding repos.
Breakdown of customer funds under management (1)
(31-03-2018)

(1) Excluding repos.
Macro and industry trends
According to the latest information from the Turkish Statistical Institute, the Turkey’s year-on-year economic growth was 7.3% in the fourth quarter of 2017, strongly supported by the high contribution from internal demand, led mainly by private consumption. In contrast, net exports continued to fall. Economic activity is expected to remain solid in the first half of 2018. Among the factors contributing to this will be the extension through 2018 of the Credit Guarantee Fund (CGF) program. However, this environment will be clearly conditioned by the political environment due to the advance election announcement (on 24th of June 2018, which was previously scheduled on the 3rd of November 2019).
Although inflation closed the month of March 2018 in double digits (10.2%), the figure was a reduction with respect to that of December 2017 (11.9%), thanks to the positive base effects. However, the prospects of inflation declining further are limited by the new depreciation pressure on the Turkish lira against the euro.
Given the inflation expectations, the CBRT will maintain its tight monetary policy. After the increases registered in 2017, the average CBRT funding rate stands at 12.75%.
Regarding the Turkish financial sector, with data as of the end of the first quarter of 2018, the year-on-year growth rate in total lending (adjusted by the effect of the Turkish lira’s depreciation) moderated to 17.3%, after the acceleration throughout 2017, thanks to the credit access facilities promoted by the CGF program mentioned before. The sector's NPL ratio continued to improve, ending the month of March at 2.8%. Lastly, customer deposits maintained a year-on-year increase similar to that of previous periods, of 12.4% (also adjusted by the effect of the Turkish lira's depreciation), supported by the positive trend of Turkish lira deposits. Foreign-currency deposits again recorded a decrease.
Activity
Unless expressly stated otherwise, all the comments below on rates of change, for both activity and earnings, will be given at constant exchange rate. These rates, together with changes at current exchange rate, can be seen in the attached tables of financial statements and relevant business indicators.
The growth of lending activity (performing loans under management) in the area amounted to 3.5% in the quarter, which is equivalent to a 11.8% increase in year-on-year terms due to loans in Turkish lira. Furthermore, advances in foreign currency remained stable during the first quarter of 2018. By segments, Garanti continued to perform favorably in business banking loans throughout the quarter and gained market share among its private peers. Although the impact of the extension to 2018 of the mentioned CGF program will be more limited than in 2017, Garanti began to take advantage of it during the first quarter of 2018. Garanti outperformed the sector in consumer general purpose loans and auto loans on the back of a favorable business cooperation with automobile companies. In mortgages, Garanti also gained market share among Turkish private banks. Lastly, there was a contraction in Garanti´s total credit card market share due to a shrinkage in consumer credit card balances.
In terms of asset quality, NPL ratio closed at 3.7%, well below the sector in local terms and NPL coverage ratio stands at 86%.
Customer deposits (58% of total liabilities in the area as of 31-3-2018) remained the main source of funding for the balance sheet in Turkey and grew by 4.3% in the quarter. Both, Turkish lira deposits and foreign currency deposits showed progress. In this line, demand deposits performed well, and continued to be one of the supports for the growth of net interest income (since they have almost zero cost), with a weight of 31% of total customer deposits.
Results
Turkey generated a cumulative net attributable profit of €201m in the first quarter of 2018, which represents a 49.7% rise in year-on-year terms. The most significant aspects of the year-on-year changes in the income statement were as follows:
- Positive performance of net interest income (up 10.4%). This positive trend is, above all, a result of the increase in activity, good management of customer spreads (despite the funding cost increase) and higher income from inflation-linked bonds (7% in the first quarter of 2017, and 8% in the first quarter of 2018).
- Income from fees and commissions grew by 39.9%. This significant increase is mainly driven by the good performance in payment systems, project finance arrangement fees and money transfer.
- Positive contribution of NTI (in the first quarter of 2017 were negative), due to increased gains from the sale of securities and trading with derivatives and currencies.
- Overall, gross income was up 21.5% in the first quarter of 2018 compared to the same period of 2017.
- Operating expenses increased by 8.6%, well below both the inflation rate and the year-on-year growth rate in gross income, thanks to the strict control cost discipline. As a result, the efficiency ratio declined to 35.6% (36.5% in 2017).
- Impairment losses on financial assets rose by 48.5% mainly due to the impact of wholesale customers impairment. As a result, the cumulative cost of risk of the area stood at 1.17%.
Financial statements and relevant business indicators (Million euros and percentage)
| IFRS 9 | IAS 39 | ||||
|---|---|---|---|---|---|
| Income statement | 1 Q 18 | ∆% | ∆%(1) | 1 Q 17 | |
| Net interest income | 753 | (7.3) | 10.4 | 812 | |
| Net fees and commissions | 201 | 17.5 | 39.9 | 171 | |
| Net trading income | 20 | n.s. | n.s. | (15) | |
| Other income/expenses | 23 | 164.5 | 215.0 | 9 | |
| Gross income | 996 | 2.0 | 21.5 | 976 | |
| Operating expenses | (354) | (8.8) | 8.6 | (389) | |
| Personnel expenses | (177) | (12.8) | 3.8 | (203) | |
| Other administrative expenses | (137) | (1.7) | 17.0 | (139) | |
| Depreciation | (40) | (12.5) | 4.2 | (46) | |
| Operating income | 642 | 9.2 | 30.1 | 588 | |
| Impaiment on financial assets not measured at fair value through profit or loss | (151) | 24.7 | 48.5 | (121) | |
| Provisions or reversal of provisions and other results | 29 | 79.9 | 114.2 | 16 | |
| Profit/(loss) before tax | 520 | 7.7 | 28.2 | 483 | |
| Income tax | (114) | 7.0 | 27.5 | (106) | |
| Profit/(loss) for the year | 407 | 7.8 | 28.4 | 377 | |
| Non-controlling interests | (206) | (5.3) | 12.8 | (217) | |
| Net attributable profit | 201 | 25.7 | 49.7 | 160 | |
| IFRS 9 | IAS 39 | ||||
|---|---|---|---|---|---|
| Balance sheets | 31-03-18 | ∆% | ∆%(1) | 31-12-17 | |
| Cash, cash balances at central banks and other demand deposits | 2,942 | (27.1) | (21.5) | 4,036 | |
| Financial assets designated at fair value | 5,993 | (6.6) | 0.6 | 6,419 | |
| of which Loans and advances | - | - | - | - | |
| Financial assets at amortized cost | 62,420 | (4.1) | 3.3 | 65,083 | |
| of which loans and advances to customers | 49,751 | (3.2) | 4.3 | 51,378 | |
| Tangible assets | 1,252 | (6.9) | 0.3 | 1,344 | |
| Other assets | 1,781 | (1.7) | 5.9 | 1,811 | |
| Total assets/liabilities and equity | 74,389 | (5.5) | 1.8 | 78,694 | |
| Financial liabilities held for trading and designated at fair value through profit or loss | 1,602 | 147.4 | 166.5 | 648 | |
| Deposits from central banks and credit institutions | 9,021 | (19.4) | (13.2) | 11,195 | |
| Deposits from customers | 43,246 | (3.2) | 4.2 | 44,691 | |
| Debt certificates | 6,941 | (16.8) | (10.4) | 8,346 | |
| Other liabilities | 11,002 | (2.8) | 4.7 | 11,321 | |
| Economic capital allocated | 2.576 | 3.3 | 11.3 | 2,493 | |
| Relevant business indicators | 31-03-18 | ∆% | ∆%(1) | 31-12-17 |
|---|---|---|---|---|
| Performing loans and advances to customers under management (2) | 49,408 | (3.9) | 3.5 | 51,438 |
| Non-performing loans and guarantees given | 2,380 | (6.8) | 0.4 | 2,553 |
| Customer deposits under management (3) | 43,143 | (3.1) | 4.3 | 44,539 |
| Off-balance sheet funds (4) | 3,861 | (1.1) | 6.6 | 3,902 |
| Risk-weighted assets | 60,936 | (2.9) | 4.6 | 62,768 |
| Efficiency ratio (%) | 35.6 | 36.5 | ||
| NPL ratio (%) | 3.7 | 3.9 | ||
| NPL coverage ratio (%) | 86 | 85 | ||
| Cost of risk (%) | 1.17 | 0.82 |
(1) Figures at constant exchange rate.
(2) Excluding repos.
(3) Includes mutual funds, pension funds and other off-balance-sheet funds.