
Other information: Corporate & Investment Banking
Highlights
- Good performance of customer activity, which is reflected in net interest income, and fees and commissions.
- Good evolution of NTI, highlighting the contribution of Mexico.
- Leadership position in green and sustainable loans.
- Net attributable profit affected by the significant increase in the impairment on financial assets line.
Business activity (1)
(Year-on-year change at constant exchange rates.
Data as of 31-12-20)
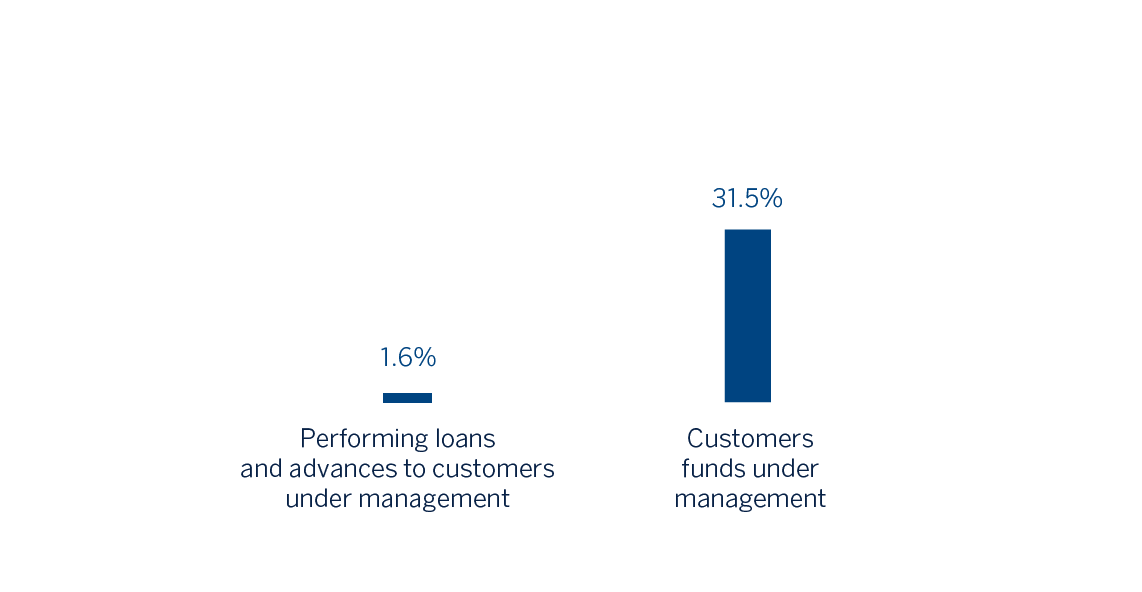
(1) Excluding repos.
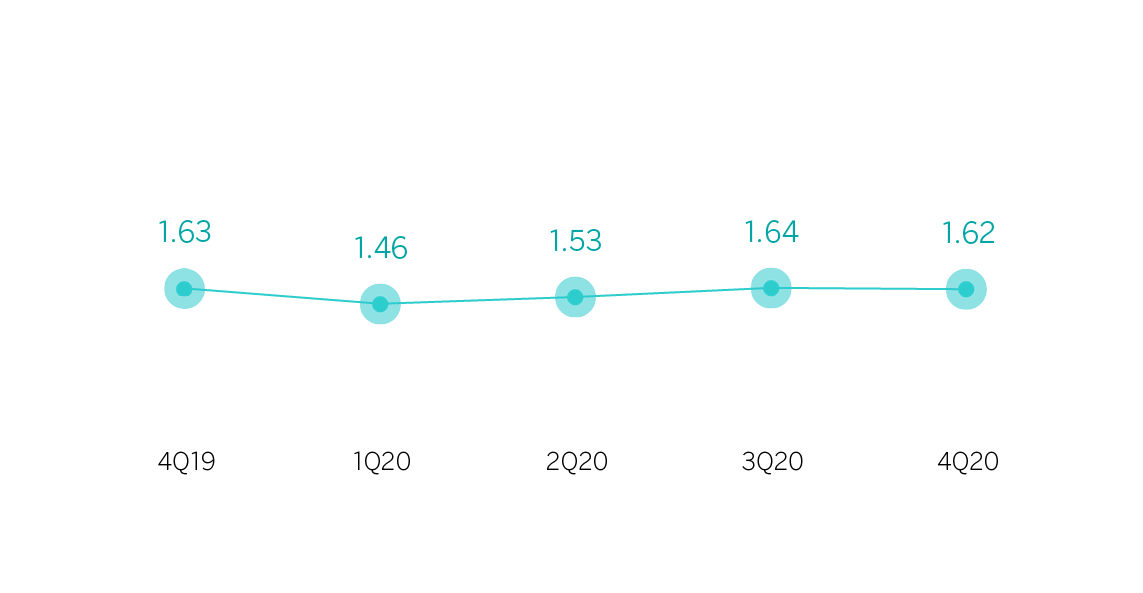
Gross income/ATAs
(Percentage. Constant exchange rates)
Operating income
(Millions of euros at constant exchange rates)
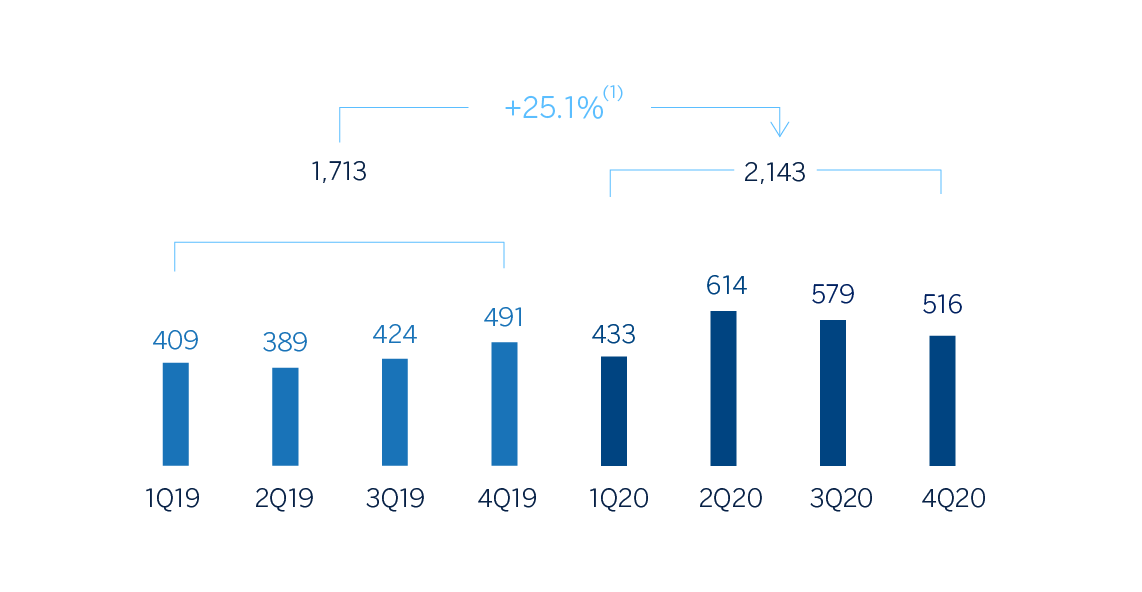
(1) At current exchange rate: +9.0%.
Net attributable profit
(Millions of euros at constant exchange rates)
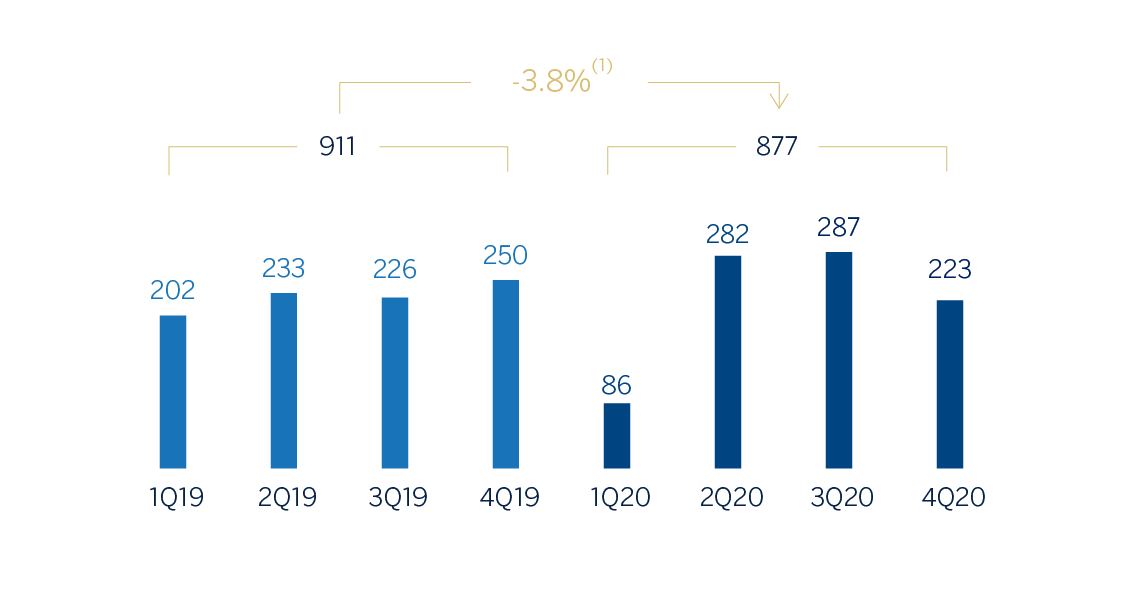
(1) At current exchange rate: -13.9%.
Financial statements and relevant business indicators (Millions of euros and percentage)
| Income statement | 2020 | ∆% | ∆% (1) | 2019 |
|---|---|---|---|---|
| Net interest income | 1,596 | 6.0 | 19.9 | 1,506 |
| Net fees and commissions | 802 | 8.6 | 18.2 | 739 |
| Net trading income | 780 | (7.6) | 2.7 | 844 |
| Other operating income and expenses | (44) | (21.6) | (6.0) | (56) |
| Gross income | 3,135 | 3.4 | 15.1 | 3,033 |
| Operating expenses | (992) | (7.1) | (1.8) | (1,067) |
| Personnel expenses | (425) | (11.2) | (7.5) | (479) |
| Other administrative expenses | (449) | (3.1) | 5.0 | (463) |
| Depreciation | (118) | (5.9) | (3.7) | (126) |
| Operating income | 2,143 | 9.0 | 25.1 | 1,965 |
| Impairment on financial assets not measured at fair value through profit or loss | (570) | 138.0 | 184.7 | (239) |
| Provisions or reversal of provisions and other results | (81) | n.s. | n.s. | 9 |
| Profit/(loss) before tax | 1,492 | (14.0) | (2.0) | 1,735 |
| Income tax | (395) | (7.4) | 6.3 | (427) |
| Profit/(loss) for the year | 1,097 | (16.2) | (4.7) | 1,308 |
| Non-controlling interests | (220) | (24.0) | (8.1) | (290) |
| Net attributable profit/(loss) | 877 | (13.9) | (3.8) | 1,018 |
- (1) Figures at constant exchange rates.
| Balance sheets | 31-12-20 | ∆% | ∆% (1) | 31-12-19 |
|---|---|---|---|---|
| Cash, cash balances at central banks and other demand deposits | 7,503 | 113.6 | 136.3 | 3,513 |
| Financial assets designated at fair value | 110,734 | 6.0 | 8.5 | 104,432 |
| Of which Loans and advances | 31,183 | (8.7) | (8.3) | 34,153 |
| Financial assets at amortized cost | 74,589 | (2.1) | 6.1 | 76,169 |
| Of which loans and advances to customers | 62,782 | (4.8) | 3.8 | 65,915 |
| Inter-area positions | - | - | - | - |
| Tangible assets | (51) | n.s. | n.s. | 63 |
| Other assets | 854 | (65.9) | (61.7) | 2,506 |
| Total assets/liabilities and equity | 193,628 | 3.7 | 8.9 | 186,684 |
| Financial liabilities held for trading and designated at fair value through profit or loss | 87,743 | (3.3) | (1.3) | 90,704 |
| Deposits from central banks and credit institutions | 16,218 | 5.1 | 7.3 | 15,426 |
| Deposits from customers | 47,471 | 21.2 | 33.6 | 39,166 |
| Debt certificates | 2,096 | (20.2) | (16.6) | 2,625 |
| Inter-area positions | 31,430 | 0.4 | 9.4 | 31,316 |
| Other liabilities | 4,265 | 44.1 | 49.3 | 2,959 |
| Economic capital allocated | 4,405 | (1.8) | 7.0 | 4,487 |
- (1) Figures at constant exchange rates.
| Relevant business indicators | 31-12-20 | ∆% | ∆% (1) | 31-12-19 |
|---|---|---|---|---|
| Performing loans and advances to customers under management (2) | 61,153 | (6.6) | 1.6 | 65,509 |
| Non-performing loans | 1,538 | 27.1 | 58.0 | 1,211 |
| Customer deposits under management (2) | 46,818 | 19.6 | 31.8 | 39,150 |
| Off-balance sheet funds (3) | 1,030 | (0.7) | 19.3 | 1,037 |
| Efficiency ratio (%) | 31.6 | 35.2 |
- (1) Figures at constant exchange rates.
- (2) Excluding repos.
- (3) Includes mutual funds, pension funds and other off-balance sheet funds.
Unless expressly stated otherwise, all the comments below on rates of change, for both activity and profit and loss, will be given at constant exchange rates. These rates, together with the changes at current exchange rates, can be found in the attached tables of the financial statements and relevant business indicators.
Activity
The most relevant aspects related to the area's activity in 2020 were:
- Lending activity (performing loans under management) continued to show dynamism, with a growth of 1.6% in 2020, and the performance in Spain and Turkey standing out, as a result of the higher loan drawdowns by customers, especially in the second quarter of the year, to address the situation caused by COVID-19 with a more comfortable liquidity position, and which were amortized throughout the second half of the year.
- Customer funds registered a double-digit increase of 31.5% during 2020, with a positive evolution in almost all geographic areas, except for Rest of Eurasia and Mexico mainly as a result of the placement of liquidity in the bank. By geographical area, Spain and The United States outperform.
During 2020, and within the strategic priority of "helping our clients transition toward a sustainable future", it is worth mentioning that BBVA CIB has participated in a total of approximately 110 transactions, 28 in the bond brokerage field and 82 in the sustainable financing field (of which 18 were project finance transactions, 26 finalist loans certified by an independent third party which accredits that the object of the financing has positive environmental or social impacts, 38 were financings linked to the achievement of certain environmental and social indicators (KPI-linked) and/or linked to ESG rating (Environmental, Social and Governance, ESG-linked).
Results
CIB generated a cumulative net attributable profit of €877m in 2020, which is 3.8% less in terms of the year-on-year comparison, mainly due to the increase in the impairment on financial assets, since the operating income grew by 25.1% in the year. The most relevant aspects on the year-on-year comparison in the income statement for Corporate & Investment Banking are summarized below:
- Excellent evolution of net interest income (up 19.9%) due to the performance of lending activity, with higher volumes and an improvement in profitability per transaction due to the sales effort.
- Double-digit increase in net fees and commissions (up 18.2%), supported by transactional business and new funding operations in most of the geographical areas, in particular Turkey and the United States (fixed-income origination activity).
- NTI recorded 2.7% year-on-year growth, with growth in all geographical areas (except Spain, which was affected by the restrictions on the distribution of dividends at the beginning of the pandemic), due to the good performance of customer activity and the good management of market volatility.
- The efficiency ratio improved to 31.6%, due to both the growth of gross income (up 15.1%) and the good performance of operating expenses, which fell by 1.8%, supported by the containment plans implemented by the area, as well as by the savings in some discretionary expenses following the pandemic.
- Provisions for impairment on financial assets increased significantly due to provisions related to COVID-19, mainly recognized in the first quarter of 2020, which includes a deterioration in the macroeconomic scenario.