
Spain
Highlights
- Activity growth driven by corporate and investment banking operations and government support programs.
- Improved efficiency ratio, driven by controlled operating expenses.
- Risk indicators contained.
- Net attributable profit affected by the level of impairment on financial assets.
Business activity (1)
(Year-on-year change. Data as of 31-12-20)
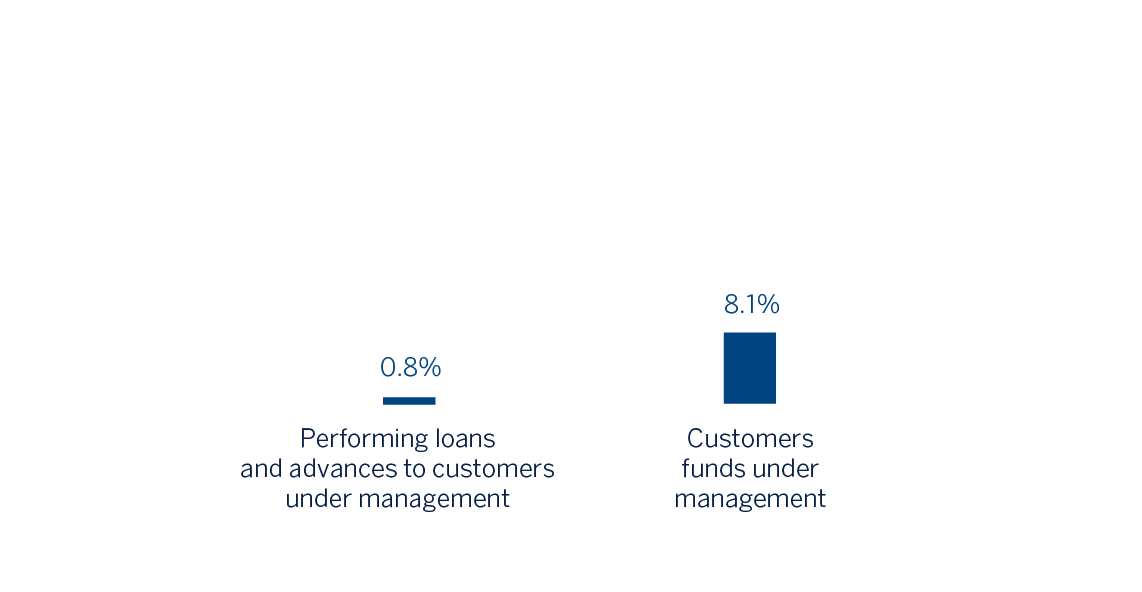
(1) Excluding repos.
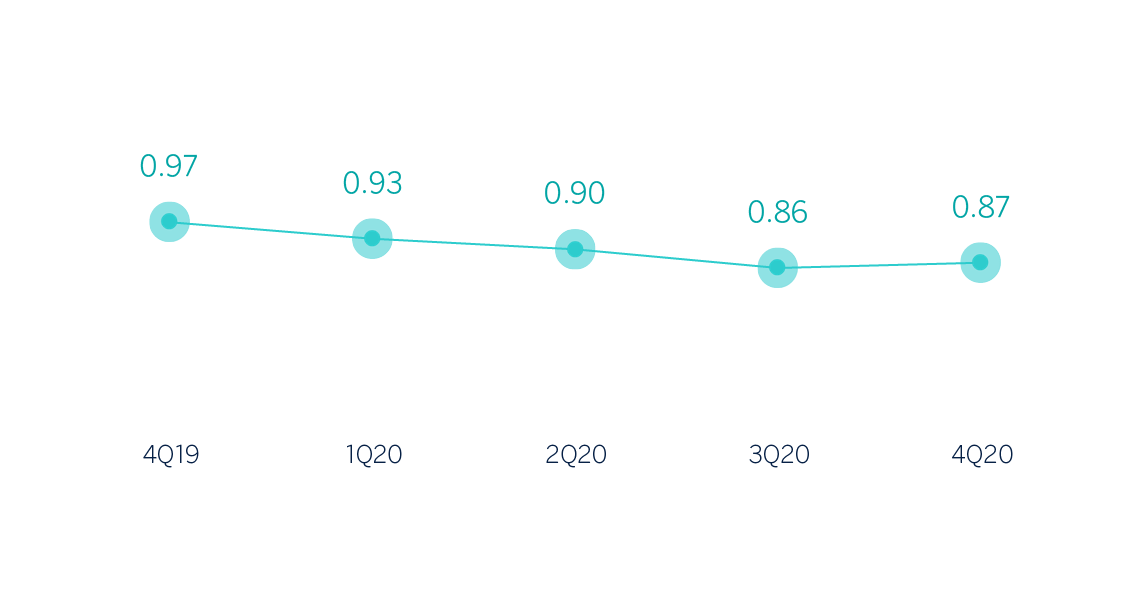
Net interest income/ATAs
(Percentage)
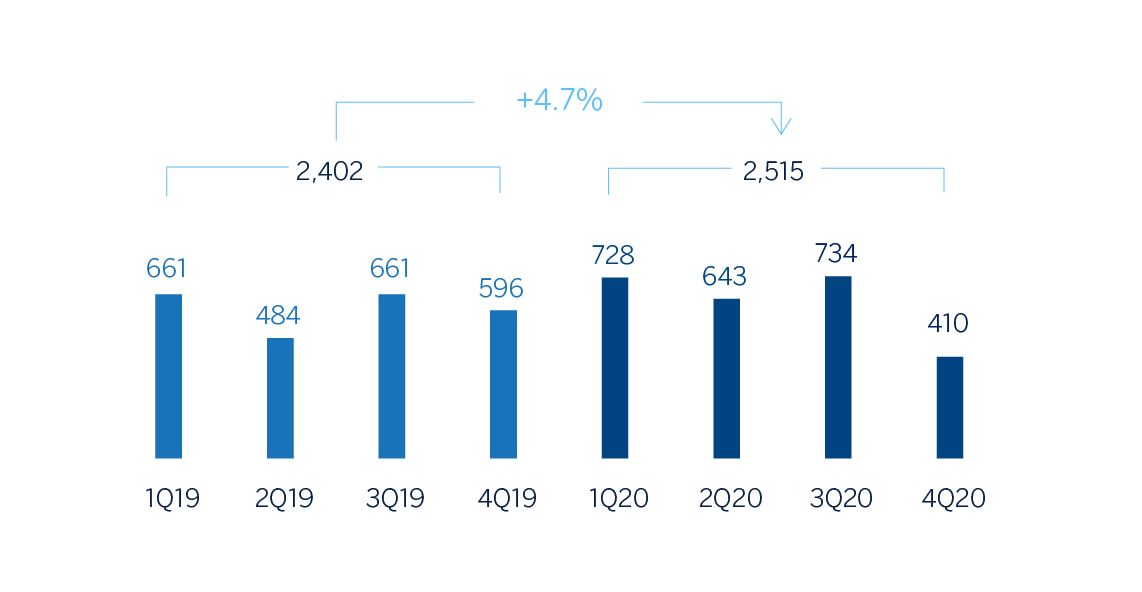
Operating income (Millions of euros)
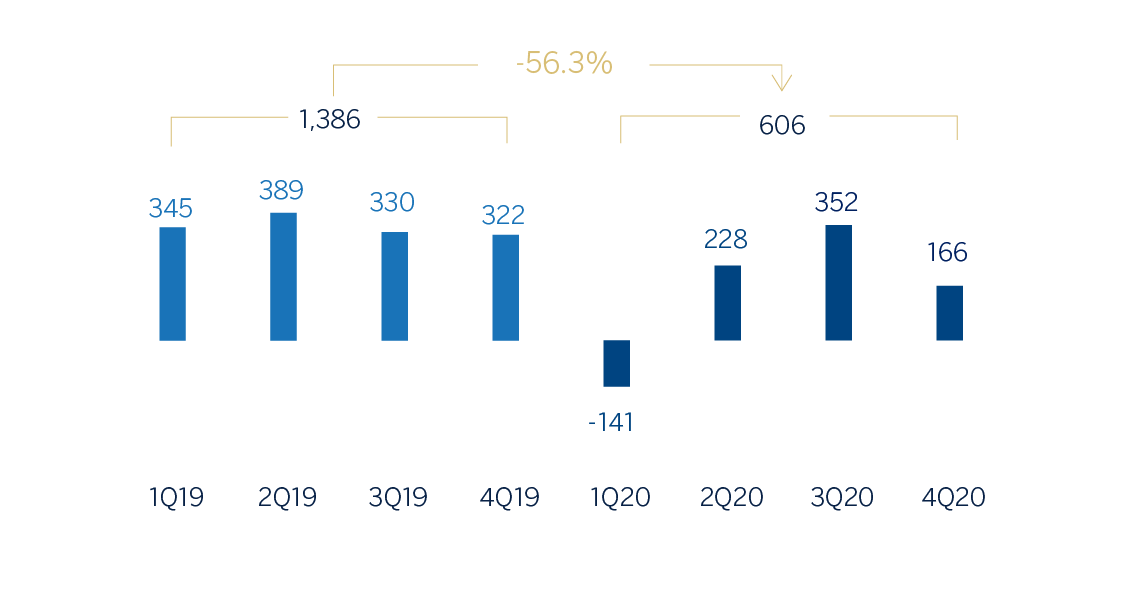
Net attributable profit (Millions of euros)
Financial statements and relevant business indicators (Millions of euros and percentage)
| Income statement | 2020 | ∆% | 2019 |
|---|---|---|---|
| Net interest income | 3,553 | (0.4) | 3,567 |
| Net fees and commissions | 1,802 | 2.9 | 1,751 |
| Net trading income | 174 | (27.2) | 239 |
| Other operating income and expenses | 25 | (74.2) | 98 |
| Of which insurance activities (1) | 465 | (10.1) | 518 |
| Gross income | 5,554 | (1.8) | 5,656 |
| Operating expenses | (3,039) | (6.6) | (3,253) |
| Personnel expenses | (1,738) | (7.7) | (1,883) |
| Other administrative expenses | (841) | (5.9) | (895) |
| Depreciation | (460) | (3.4) | (476) |
| Operating income | 2,515 | 4.7 | 2,402 |
| Impairment on financial assets not measured at fair value through profit or loss | (1,167) | n.s. | (138) |
| Provisions or reversal of provisions and other results | (538) | 39.3 | (386) |
| Profit/(loss) before tax | 809 | (56.9) | 1,878 |
| Income tax | (200) | (59.1) | (489) |
| Profit/(loss) for the year | 610 | (56.1) | 1,389 |
| Non-controlling interests | (3) | 36.5 | (3) |
| Net attributable profit | 606 | (56.3) | 1,386 |
- (1) Includes premiums received net of estimated technical insurance reserves.
| Balance sheets | 31-12-20 | ∆% | 31-12-19 |
|---|---|---|---|
| Cash, cash balances at central banks and other demand deposits | 38,360 | 141.2 | 15,903 |
| Financial assets designated at fair value | 138,178 | 13.4 | 121,890 |
| Of which: Loans and advances | 30,680 | (10.2) | 34,175 |
| Financial assets at amortized cost | 198,173 | 1.5 | 195,260 |
| Of which: Loans and advances to customers | 167,998 | 0.4 | 167,332 |
| Inter-area positions | 21,940 | 1.4 | 21,637 |
| Tangible assets | 2,902 | (12.1) | 3,302 |
| Other assets | 6,427 | (0.1) | 6,436 |
| Total assets/liabilities and equity | 405,981 | 11.4 | 364,427 |
| Financial liabilities held for trading and designated at fair value through profit or loss | 74,023 | (4.8) | 77,731 |
| Deposits from central banks and credit institutions | 58,783 | 43.1 | 41,092 |
| Deposits from customers | 206,428 | 13.2 | 182,370 |
| Debt certificates | 39,326 | 10.7 | 35,520 |
| Inter-area positions | - | - | - |
| Other liabilities | 16,964 | (8.2) | 18,484 |
| Economic capital allocated | 10,457 | 13.3 | 9,229 |
| Relevant business indicators | 31-12-20 | ∆% | 31-12-19 |
|---|---|---|---|
| Performing loans and advances to customers under management (1) | 165,511 | 0.8 | 164,140 |
| Non-performing loans | 8,340 | (3.4) | 8,635 |
| Customer deposits under management (1) | 205,809 | 12.9 | 182,370 |
| Off-balance sheet funds (2) | 62,707 | (5.1) | 66,068 |
| Risk-weighted assets | 104,388 | (0.5) | 104,911 |
| Efficiency ratio (%) | 54.7 | 57.5 | |
| NPL ratio (%) | 4.3 | 4.4 | |
| NPL coverage ratio (%) | 67 | 60 | |
| Cost of risk (%) | 0.67 | 0.08 |
- (1) Excluding repos.
- (2) Includes mutual funds, pension funds and other off-balance sheet funds.
Activity
The most relevant aspects related to the area's activity throughout 2020 were:
- Lending activity (performing loans under management) stood higher than at the end of 2019 (up 0.8%). The reduction in mortgage lending and lending to public institutions (down 4.2%) was offset, among others, by higher balances in retail banking (up 11.2%), in SMEs (up 6.5%) and in corporate and investment banking (up 3.3%), which benefited from the facilities guaranteed by the Spanish Instituto de Crédito Oficial (hereinafter ICO).
- With regard to asset quality, the indicators remained stable compared to the previous quarter. As a result, the NPL ratio remained at 4.3% and the coverage ratio at 67%.
- Total customer funds grew by 8.1% compared to the close of 2019, partly due to the trend for greater saving, both by companies and by individual customers. This has resulted in an increase in customer deposits under management (up 12.9%), which managed to offset the negative evolution of off-balance sheet funds (down 5.1%) resulting from the unfavorable performance of the markets in 2020.
Results
Spain generated a cumulative net attributable profit of €606m in 2020, 56.3% lower than in 2019, mainly due to the increase in impairment on financial assets as a result of the pandemic, meanwhile, operating income increased by 4.7% compared to the previous year.
The main highlights of the area's income statement are:
- Net interest income was slightly lower than at the close of 2019 (down 0.4%), affected by the falling rate environment and the change in the financing mix of the companies from long- to short-term.
- Net fees and commissions performed well (up 2.9% year-on-year), widely as a result of asset management fees and fees generated by corporate banking operations, which offset exemptions on some products at the worst moments of the pandemic.
- NTI (decreased (down 27.2% year-on-year), mainly due to performance of the Global Markets area in the last quarter of the year, which offsets the higher gains from ALCO portfolio sales in 2020.
- The other operating income and expenses line compares negatively to the previous year (down 74.2%), due to increased contributions to both the Single Resolution Fund and the Deposit Guarantee Fund and the lower contribution of the insurance business. It should also be noted that, once authorization was received from the competent regulators, on December 14, BBVA Seguros transferred to Allianz half plus one share of the company created to jointly develop non-life insurance business, excluding health insurance line.
- There was a reduction in operating expenses (down 6.6% year-on-year), mainly as a result of the cost-containment plans and supported by the reduction in discretionary expenses as a result of the pandemic. Therefore, the efficiency ratio stood at 54.7% compared to 57.5% in 2019.
- Impairment on financial assets increased by €1,029m compared to the previous year, mainly due to the negative impact recorded mainly in the first quarter of 2020, as a result of deterioration in the macroeconomic scenario due to COVID-19, which includes credit provisions for those sectors most affected, in a comparison that is further impacted by portfolio sales made in 2019. In quarterly terms, this line item stood at similar levels prior to the pandemic, which meant that the cumulative cost of risk stood at 0.67% at the close of December.
- Finally, provisions and other results generated a more negative result compared to the previous year, mainly due to provisions for potential claims.