
South America
Highlights
- Activity growth impacted by the support measures from the different governments.
- Year-on-year growth in recurring revenues and year-on-year decline in NTI due to the sale of the stake in Prisma in 2019.
- Contained growth in expenditure, well below the area's average inflation.
- Net attributable profit affected by the increase in the impairment on financial assets line.
Business activity (1)
(Year-on-year change at constant exchange rates. Data as of 31-12-20)
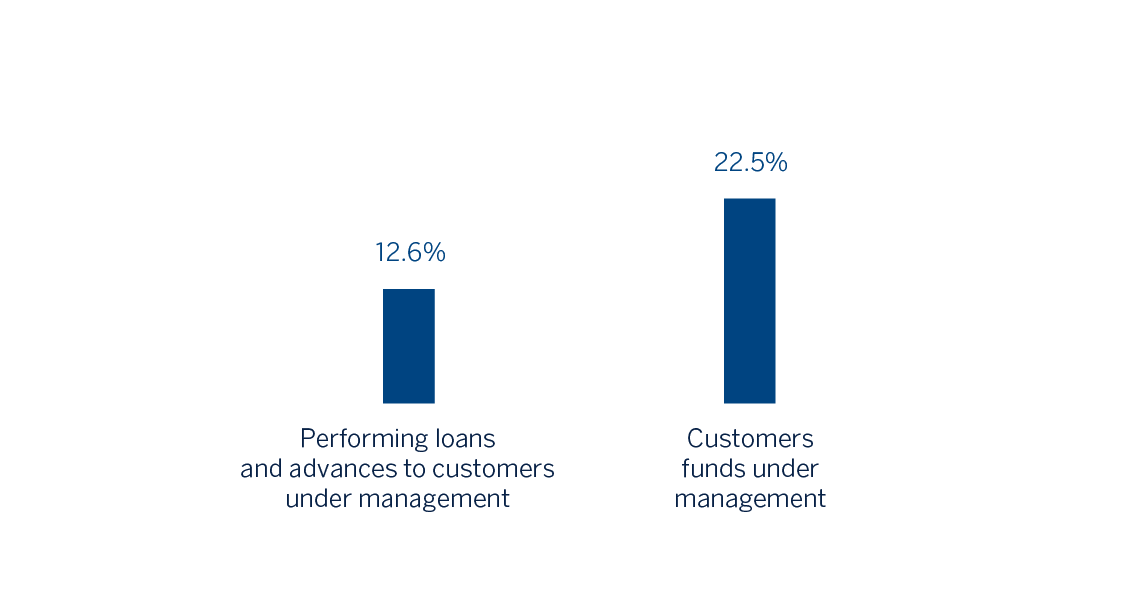
(1) Excluding repos.
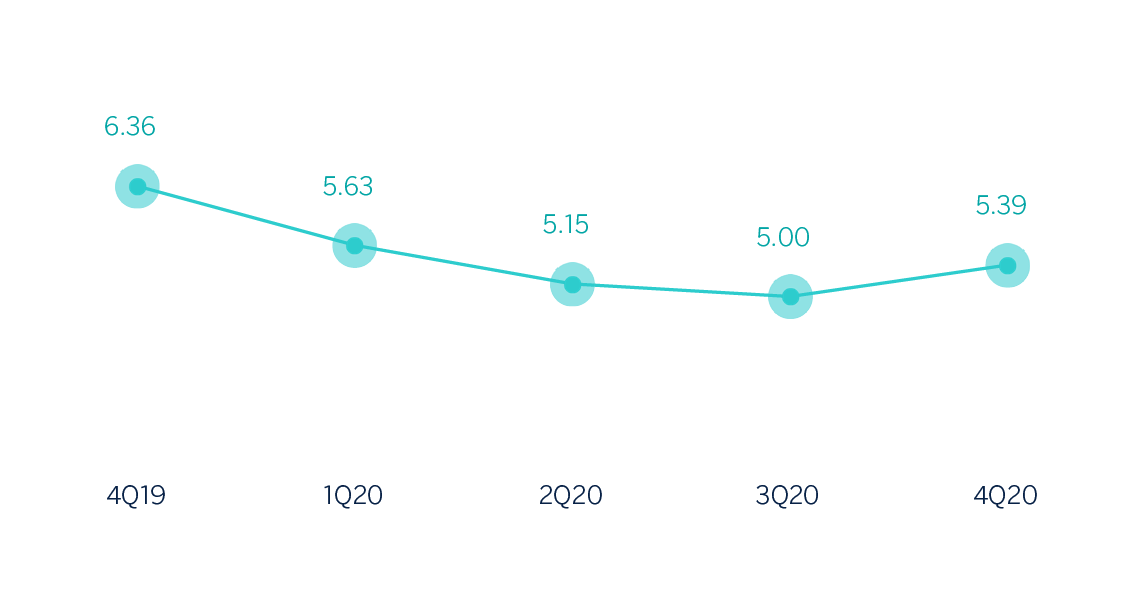
Net interest income/ATAs
(Percentage. Constant exchange rates)
Operating income
(Millions of euros at constant exchange rates)
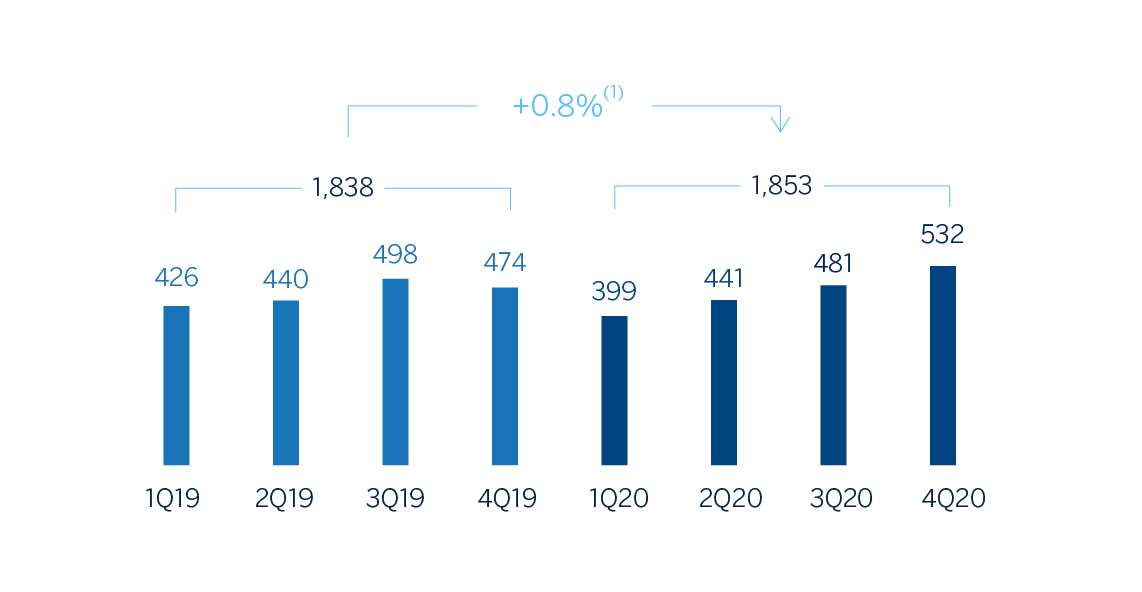
(1) At current exchange rate: -18.6%.
Net attributable profit
(Millions of euros at constant exchange rates)
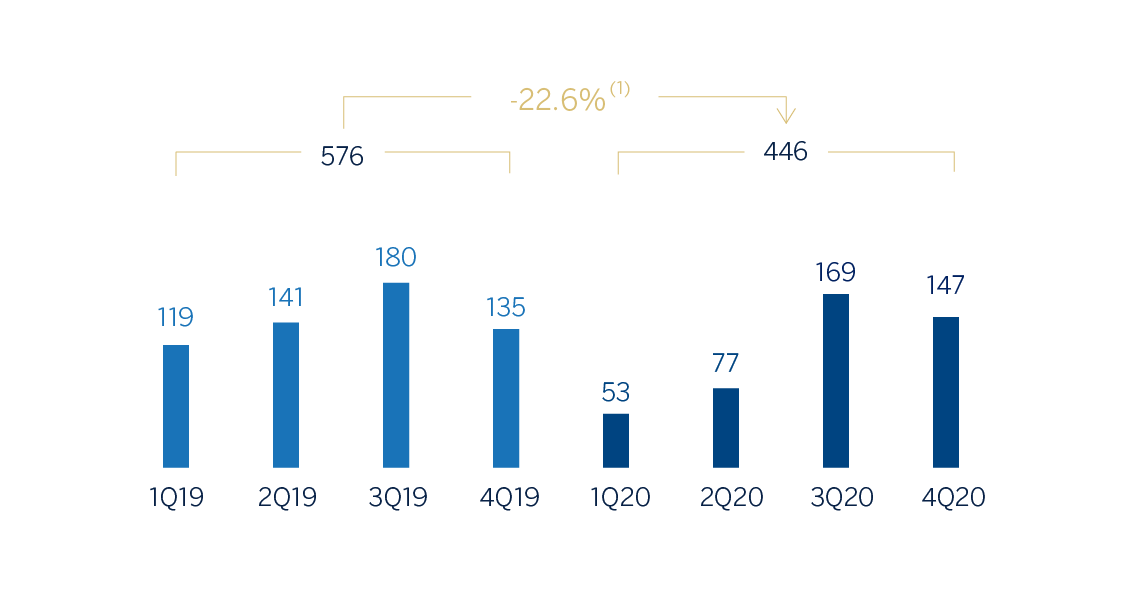
(1) At current exchange rate: -38.2%.
Financial statements and relevant business indicators (Millions of euros and percentage)
| Income statement | 2020 | ∆% | ∆% (1) | 2019 |
|---|---|---|---|---|
| Net interest income | 2,701 | (15.5) | 0.9 | 3,196 |
| Net fees and commissions | 484 | (13.1) | 0.6 | 557 |
| Net trading income | 407 | (29.3) | (12.8) | 576 |
| Other operating income and expenses | (367) | (23.4) | (18.9) | (479) |
| Gross income | 3,225 | (16.2) | 1.7 | 3,850 |
| Operating expenses | (1,372) | (12.8) | 2.8 | (1,574) |
| Personnel expenses | (669) | (15.7) | 0.2 | (794) |
| Other administrative expenses | (549) | (9.8) | 6.5 | (609) |
| Depreciation | (154) | (10.3) | 1.9 | (171) |
| Operating income | 1,853 | (18.6) | 0.8 | 2,276 |
| Impaiment on financial assets not measured at fair value through profit or loss | (864) | 11.3 | 34.0 | (777) |
| Provisions or reversal of provisions and other results | (93) | (10.2) | 24.5 | (103) |
| Profit/(loss) before tax | 896 | (35.8) | (19.9) | 1,396 |
| Income tax | (277) | (24.5) | (4.5) | (368) |
| Profit/(loss) for the year | 619 | (39.8) | (25.3) | 1.028 |
| Non-controlling interests | (173) | (43.7) | (31.6) | (307) |
| Net attributable profit | 446 | (38.2) | (22.6) | 721 |
| Balance sheets | 31-12-20 | ∆% | ∆% (1) | 31-12-19 |
|---|---|---|---|---|
| Cash, cash balances at central banks and other demand deposits | 7,126 | (17.1) | 4.1 | 8,601 |
| Financial assets designated at fair value | 7,329 | 19.7 | 44.3 | 6,120 |
| Of which loans and advances | 108 | (5.2) | 8.4 | 114 |
| Financial assets at amortized cost | 38,549 | 1.8 | 20.7 | 37,869 |
| Of which loans and advances to customers | 33,615 | (5.8) | 11.8 | 35,701 |
| Tangible assets | 808 | (16.5) | (4.7) | 968 |
| Other assets | 1,624 | 12.9 | 32.5 | 1,438 |
| Total assets/liabilities and equity | 55,435 | 0.8 | 20.7 | 54,996 |
| Financial liabilities held for trading and designated at fair value through profit or loss | 1,326 | (28.7) | (17.6) | 1,860 |
| Deposits from central banks and credit institutions | 5,378 | 47.1 | 72.0 | 3,656 |
| Deposits from customers | 36,874 | 2.1 | 23.4 | 36,104 |
| Debt certificates | 2,612 | (18.9) | (7.5) | 3,220 |
| Other liabilities | 7,093 | (7.5) | 10.4 | 7,664 |
| Economic capital allocated | 2,152 | (13.6) | 4.7 | 2,492 |
| Relevant business indicators | 31-12-20 | ∆% | ∆% (1) | 31-12-19 |
|---|---|---|---|---|
| Performing loans and advances to customers under management (2) | 33,719 | (5.3) | 12.6 | 35,598 |
| Non-performing loans | 1,780 | (3.9) | 13.6 | 1,853 |
| Customer deposits under management (3) | 36,886 | 2.1 | 23.3 | 36,123 |
| Off-balance sheet funds (4) | 13,722 | 6.7 | 20.3 | 12,864 |
| Risk-weighted assets | 39,804 | (12.4) | 5.2 | 45,413 |
| Efficiency ratio (%) | 42.5 | 40.9 | ||
| NPL ratio (%) | 4.4 | 4.4 | ||
| NPL coverage ratio (%) | 110 | 100 | ||
| Cost of risk (%) | 2.36 | 1.88 |
- (1) Figures at constant exchange rates.
- (2) Excluding repos.
- (3) Excluding repos and including specific marketable debt securities.
- (4) Includes mutual funds, pension funds and other off-balance sheet funds.
South America. Data per country (Millions of euros)
| Operating income | Net attributable profit/(loss) | |||||||
|---|---|---|---|---|---|---|---|---|
| Country | 2020 | ∆% | ∆% (1) | 2019 | 2020 | ∆% | ∆% (1) | 2019 |
| Argentina | 343 | (37.3) | n.s. | 548 | 89 | (33.0) | n.s. | 133 |
| Colombia | 591 | (7.4) | 6.2 | 639 | 165 | (38.0) | (28.9) | 267 |
| Peru | 718 | (13.2) | (7.2) | 827 | 110 | (45.6) | (41.8) | 202 |
| Other countries (2) | 200 | (23.4) | (11.4) | 261 | 82 | (31.7) | (20.2) | 120 |
| Total | 1,853 | (18.6) | 0.8 | 2,276 | 446 | (38.2) | (22.6) | 721 |
- (1) Figures at constant exchange rates.
- (2) Bolivia, Chile (Forum), Paraguay, Uruguay and Venezuela. Additionally, it includes eliminations and other charges.
South America. Relevant business indicators per country (Millions of euros)
| Argentina | Colombia | Peru | ||||
|---|---|---|---|---|---|---|
| 31-12-20 | 31-12-19 | 31-12-20 | 31-12-19 | 31-12-20 | 31-12-19 | |
| Performing loans and advances to customers under management (1) (2) | 2,812 | 1,909 | 11,682 | 11,234 | 15,106 | 12,575 |
| Non-performing loans and guarantees given (1) | 52 | 68 | 677 | 648 | 904 | 675 |
| Customer deposits under management (1) (3) | 4,622 | 2,845 | 12,129 | 11,097 | 15,850 | 12,250 |
| Off-balance sheet funds (1) (4) | 969 | 420 | 1,567 | 1,214 | 2,146 | 1,523 |
| Risk-weighted assets | 5,685 | 6,093 | 13,095 | 14,172 | 15,845 | 19,293 |
| Efficiency ratio (%) | 53.6 | 46.9 | 35.2 | 36.2 | 37.7 | 35.8 |
| NPL ratio (%) | 1.8 | 3.4 | 5.2 | 5.3 | 4.5 | 4.1 |
| NPL coverage ratio (%) | 241 | 161 | 113 | 98 | 101 | 96 |
| Cost of risk (%) | 3.24 | 4.22 | 2.64 | 1.67 | 2.13 | 1.45 |
- (1) Figures at constant exchange rates.
- (2) Excluding repos.
- (3) Excluding repos and including specific marketable debt securities.
- (4) Includes mutual funds and other off-balance sheet funds.
Unless expressly stated otherwise, all the comments below on rates of change, for both activity and results, will be given at constant exchange rates. These rates, together with the changes at current exchange rates, can be found in the attached tables of the financial statements and relevant business indicators.
Activity and results
The most relevant aspects related to the area's activity in 2020 were:
- Lending activity (performing loans under management) was 12.6% higher as of December 31, 2020 compared to the close of the previous year. The performance of the wholesale portfolio stands out (up 20.3% year-on-year), due to the greater drawdown of credit facilities by companies in response to the situation generated by the COVID-19 pandemic. The retail portfolio closed up compared to the end of 2019 (up 5.1%) following the upturn in the quarter (up 1.9%), mainly due to the evolution of credit cards and consumer loans (up 4.3% collectively). In terms of asset quality, the non-performing loan ratio stood at 4.4% while the NPL coverage ratio stood at 110%.
- On the funding side, the performance has been boosted by the measures taken by the different central banks to ensure liquidity in the respective financial systems in the region. As a result, deposits from customers under management increased by 23.3% throughout the year, mainly due to the evolution of demand deposits. Likewise, off-balance sheet funds grew by 20.3% throughout the year.
South America generated a cumulative net attributable profit of €446m in 2020, representing a year-on-year decline of 22.6% (down 38.2% at current exchange rates), mainly due to the increase in the impairment on financial assets in the first half of 2020 caused by the COVID-19 crisis. The cumulative impact of inflation in Argentina on the area's net attributable profit in 2020 stood at a loss of around €104m, compared to a cumulative loss of €98m at the end of December 2019.
The most notable aspects of the cumulative evolution of the income statement as of December 2020 are summarized below:
- Net interest income continued to grow at constant exchange rates (up 0.9%). At current exchange rates, the devaluation of the main currencies in the region weakened this positive performance.
- Decreased contribution from NTI (down 12.8% at constant exchange rates, down 29.3% at current exchange rates). This line includes the annual valuation in the last quarter of 2020 of the Bank's stake in Prisma Medios de Pago S.A. (hereinafter Prisma), the outcome of which was more positive than the 2019 annual valuation, in a comparison that also includes the capital gains in the first quarter of 2019.
- Operating expenses (up 2.8%) increased significantly below the inflation rate in the region.
- Increased requirements for impairment on financial assets (up 34.0%, up 11.3% at current exchange rates) mainly due to the extraordinary deterioration in the macroeconomic scenario resulting from the impact of COVID-19 and largely recorded in the first half of the year.
The evolution throughout 2020 for the business area’s most representative countries, Argentina, Colombia and Peru, is summarized below:
Argentina
- Lending activity grew by 47.3% since December 2019 due to growth in commercial and credit card segments. Throughout the quarter, retail portfolios showed higher growth than wholesale portfolios as a result of lower activity caused by the pandemic. Greater credit card and consumer finance dynamism was also observed. There was a decrease in the NPL ratio, which stood at 1.8% as of December 31, 2020, from 3.4% at the end of December 2019, due to the reduction in non-performing loans. The NPL coverage ratio increased to 241%.
- On the total customer funds side, available liquidity meant that deposits from customers under management increased by 62.5% in 2020, with growth in both demand deposits and time deposits, the latter was favored by minimum returns on deposits in pesos established by the Central Bank of the Republic of Argentina. Off-balance sheet funds also increased significantly.
- Net attributable profit stood at €89m, with recurrent revenues performing well (up 8.0%) and a greater contribution as a result of the annual valuation on the remaining stake in Prisma. The year-on-year comparison is affected by the positive effect of the sale of the stake in Prisma and the increased need for impairment on financial assets in 2019, due to the rating downgrade and the situation in the country at the time.
Colombia
- Lending activity grew by 4.0% in 2020 due to the performance of retail portfolios (up 5.1% year-on-year), particularly consumer and mortgages, the latter supported by government incentives for non-social housing. In terms of asset quality, the NPL ratio and NPL coverage ratio improved to 5.2% and 113% respectively at the close of December 2020.
- Deposits from customers under management increased by 9.3% in 2020, driven by growth in demand deposits. Off-balance sheet funds continued their recovery after the withdrawals seen at the end of the first quarter of the year and closed 29.0% higher than the one reached at the end of December 2019. In the quarter, the search for more profitable investment alternatives by customers, in line with the bank's strategy of reducing financial costs, meant a reduction in deposits from customers (down 0.9%).
- The net attributable profit stood at €165m, with a year-on-year decrease of 28.9%. The strength of operating income is notable, which increased by 6.2% in 2020 thanks to higher income generation from net interest income and NTI, although there was a negative impact from the higher loan-loss provisioning due to the COVID-19 crisis.
Peru
- Lending activity was 20.1% higher than at the end of the 2019 financial year, mainly driven by the wholesale portfolio, as a result of the distribution of funds from the Plan Reactiva, which more than offset the decline still seen in credit cards as a result of the lower activity due to the pandemic. In terms of asset quality, as of December 31, 2020, an increase was recorded in the NPL ratio, which stood at 4.5%, due to the deterioration of certain refinanced loans, as well as other assets in the commercial, SMEs and retail portfolio segments. For its part, the NPL coverage ratio stood at 101%, higher than at the end of December 2019.
- Customer deposits under management increased by 29.4% during 2020, mainly due to the 53.4% growth in demand deposits driven by legislative measures that allowed pension plan participants to withdraw part of their funds as a relief measure to cope with the pandemic. Off-balance sheet funds increased by 40.9%.
- Net interest income fell compared to the previous year, due to the pressure on interest rates caused by the drop in official rates and government-backed loans at preferential rates, which are in addition to other customer relief measures such as interest-free deferral of repayments on credit cards. Net fees and commissions grew slightly (up 0.5%), influenced by reduced activity as a result of the pandemic, the temporary elimination of certain fees and commissions as a measure to support customers, and the increased use of digital channels. The upturn in operating expenses in the last quarter caused a growth in this line (up 1.1%) in the year, but below the inflation growth (up 2%). Greater impairment on financial assets was observed in the quarter as a result of rating adjustments, which were combined with provisions made mainly in the first half of the year as a result of the COVID-19 crisis and resulted in this line increasing by 70.2%. As a result, net attributable profit stood at €110m, 41.8% lower than in 2019.