
The United States
Highlights
- Flat lending activity and strong increase in customer deposits in the year.
- The cost of risk favorable evolution continues, with a significant improvement in the quarter.
- Positive evolution of fees and commissions and NTI.
- Net attributable profit impacted by the Fed rate reduction and the significant increase in the impairment on financial assets line.
Business activity (1)
(YEAR-ON-YEAR CHANGE AT CONSTANT EXCHANGE RATE. DATA AS OF 31-12-20)
(1) Excluding repos.
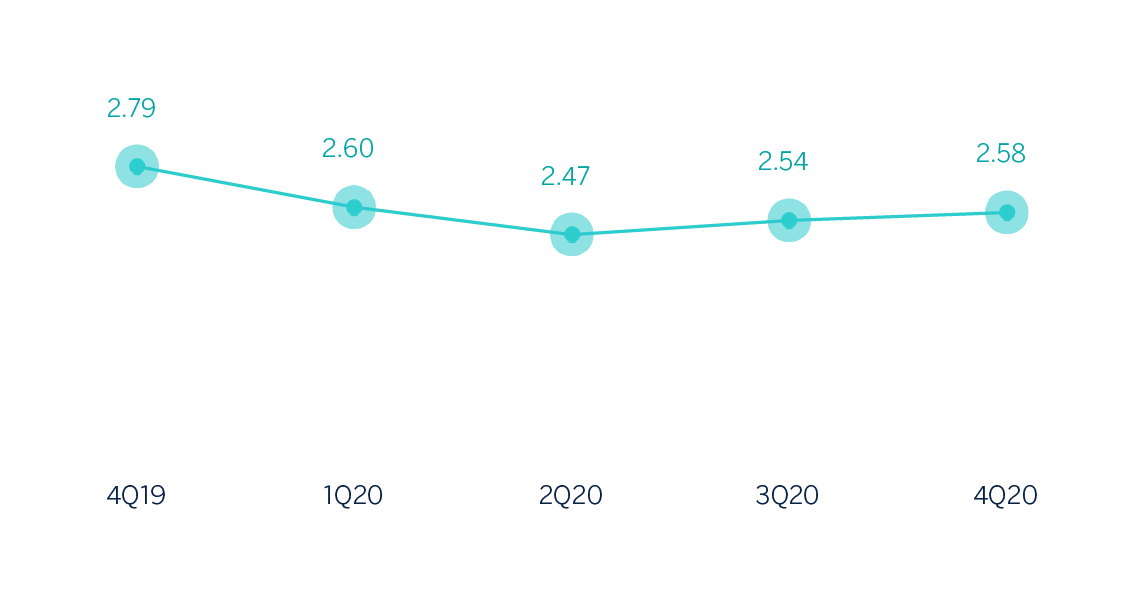
Net interest income/ATAs
(Percentage. Constant exchange rate)
Operating income
(Millions of euros at constant exchange rate)
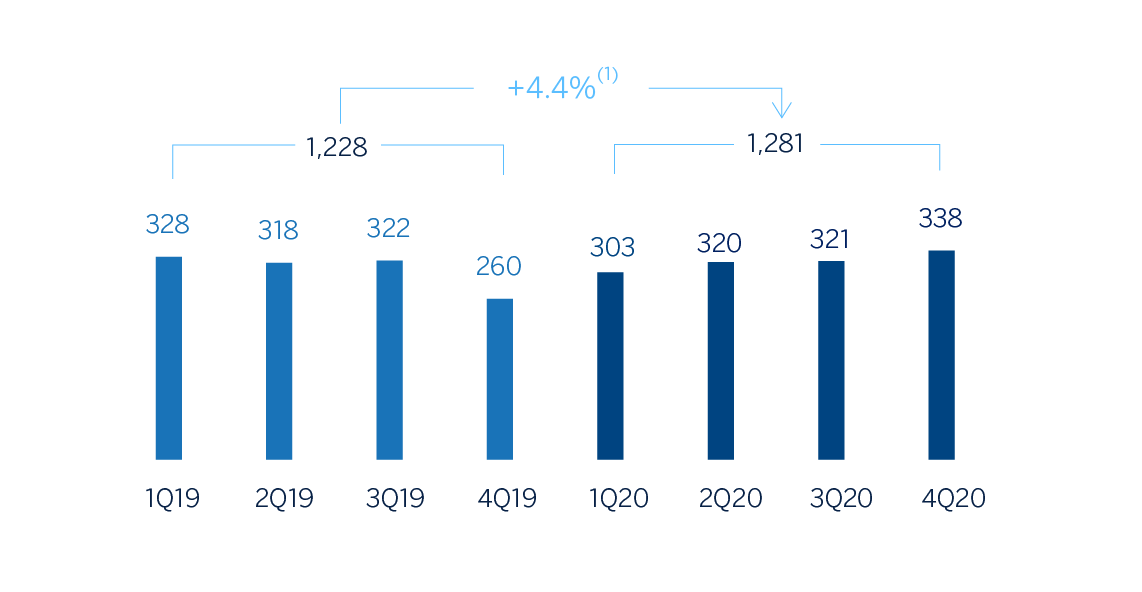
(1) At current exchange rate: +1.9%.
Net attributable profit
(Millions of euros at constant exchange rate)
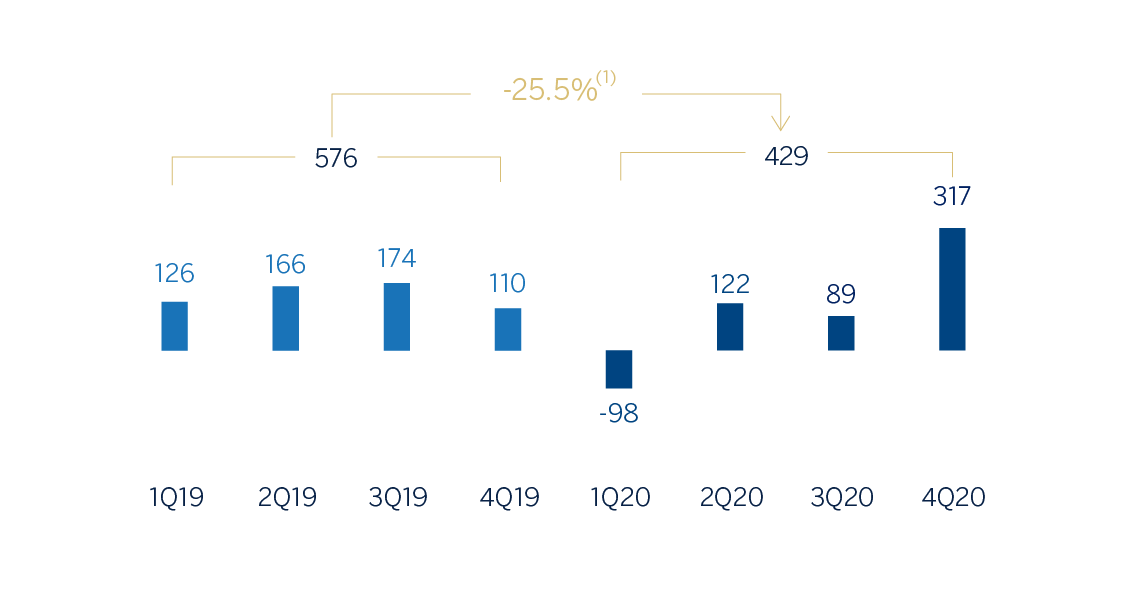
(1) At current exchange rate: -27.2%.
Financial statements and relevant business indicators (Millions of euros and percentage)
| Income statement | 2020 | ∆% | ∆% (1) | 2019 |
|---|---|---|---|---|
| Net interest income | 2,284 | (4.6) | (2.6) | 2,395 |
| Net fees and commissions | 665 | 3.2 | 5.5 | 644 |
| Net trading income | 220 | 27.4 | 31.8 | 173 |
| Other operating income and expenses | (17) | n.s. | n.s. | 12 |
| Gross income | 3,152 | (2.2) | (0.0) | 3,223 |
| Operating expenses | (1,870) | (4.9) | (2.8) | (1,966) |
| Personnel expenses | (1,085) | (3.7) | (1.6) | (1,126) |
| Other administrative expenses | (577) | (7.1) | (5.1) | (621) |
| Depreciation | (209) | (4.7) | (2.7) | (219) |
| Operating income | 1,281 | 1.9 | 4.4 | 1,257 |
| Impaiment on financial assets not measured at fair value through profit or loss | (776) | 41.0 | 44.3 | (550) |
| Provisions or reversal of provisions and other results | (4) | 70.8 | 72.5 | (2) |
| Profit/(loss) before tax | 502 | (28.8) | (27.1) | 705 |
| Income tax | (73) | (36.8) | (35.4) | (115) |
| Profit/(loss) for the year | 429 | (27.2) | (25.5) | 590 |
| Non-controlling interests | - | - | - | - |
| Net attributable profit | 429 | (27.2) | (25.5) | 590 |
| Balance sheets | 31-12-20 | ∆% | ∆%(1) | 31-12-19 |
|---|---|---|---|---|
| Cash, cash balances at central banks and other demand deposits | 17,260 | 108.1 | 127.3 | 8,293 |
| Financial assets designated at fair value | 6,792 | (11.3) | (3.1) | 7,659 |
| Of which: Loans and advances | 349 | 33.8 | 46.2 | 261 |
| Financial assets at amortized cost | 66,933 | (3.7) | 5.2 | 69,510 |
| Of which: Loans and advances to customers | 57,983 | (8.2) | 0.3 | 63,162 |
| Inter-area positions | - | - | - | - |
| Tangible assets | 810 | (11.4) | (3.2) | 914 |
| Other assets | 2,158 | 0.2 | 9.5 | 2,153 |
| Total assets/liabilities and equity | 93,953 | 6.1 | 15.9 | 88,529 |
| Financial liabilities held for trading and designated at fair value through profit or loss | 952 | 237.9 | 269.0 | 282 |
| Deposits from central banks and credit institutions | 5,570 | 36.5 | 49.1 | 4,081 |
| Deposits from customers | 69,923 | 3.6 | 13.1 | 67,525 |
| Debt certificates | 2,879 | (18.9) | (11.4) | 3,551 |
| Inter-area positions | 4,869 | 42.5 | 55.7 | 3,416 |
| Other liabilities | 6,124 | 5.0 | 14.7 | 5,831 |
| Economic capital allocated | 3,636 | (5.4) | 3.3 | 3,843 |
| Relevant business indicators | 31-12-20 | ∆% | ∆% (1) | 31-12-19 |
|---|---|---|---|---|
| Performing loans and advances to customers under management (2) | 57,887 | (8.5) | (0.0) | 63,241 |
| Non-performing loans | 1,258 | 72.3 | 88.2 | 730 |
| Customer deposits under management (2) | 69,926 | 3.5 | 13.1 | 67,528 |
| Off-balance sheet funds (3) | - | - | - | - |
| Risk-weighted assets | 60,365 | (7.4) | 1.2 | 65,170 |
| Efficiency ratio (%) | 59.3 | 61.0 | ||
| NPL ratio (%) | 2.1 | 1.1 | ||
| NPL coverage ratio (%) | 84 | 101 | ||
| Cost of risk (%) | 1.18 | 0.88 |
- (1) Figures at constant exchange rate.
- (2) Excluding repos.
- (3) Includes mutual funds and other off-balance sheet funds.
Unless expressly stated otherwise, all the comments below on rates of change, for both activity and earnings, will be given at constant exchange rate. These rates, together with changes at current exchange rates, can be found in the attached tables of financial statements and relevant business indicators. In relation to the sale agreement reached by the BBVA Group with PNC (For more information see “Highlights” section of this report), which includes certain companies of the Group in the United States, the figures and comments of this business area are presented incorporating the companies mentioned at the end of December 2020.
Activity
The most relevant aspects related to the area's activity during 2020 were:
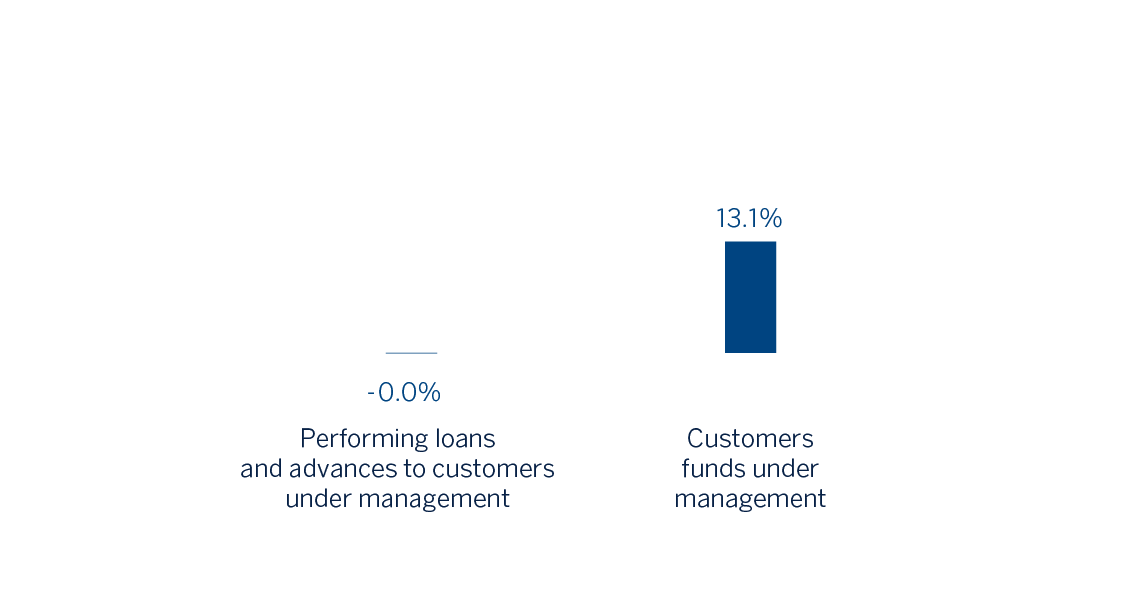
- The lending activity (performing loans under management) showed lower dynamism between October and December (down 3.2%), due to the combined effect of several factors, including the volume of liquidity injected into the system and the use by companies of credit facilities provided during the first and second quarters of the year. In comparison to December 2019, the loan portfolio remains flat, mainly due to the performance of the Corporate and Business Banking segment, which was driven by the Paycheck Protection Program. The rest of the retail portfolio showed reductions in rates of change with respect to the end of 2019, due to the unfavorable impact of the pandemic.
- In terms of risk indicators, the NPL ratio showed an upward trend during the year, focused on the most sensitive sectors in the COVID-19 environment and closed at 2.1%. For its part, the NPL coverage ratio stood at 84%, compared to 101% at the end of December 2019.
- Customer deposits under management increased by 13.1% in the year, due to the placement of the increased liquidity made available to customers in demand deposits. This line showed a flat performance in the quarter.
Results
The United States generated a net attributable profit of €429m during 2020, 25.5% less than in the same period of the previous year. The most relevant aspects related to the income statement are summarized below:
- Net interest income fell by 2.6% year-on-year, affected by the Fed's interest rate cuts, for a total of 225 basis points since the first quarter of 2019, partially offset by the lower financing costs due to the excellent cost of deposits management. This line increased by 2.3% in the quarter, mainly by both the lower expenses and the funding mix improvement.
- Net fees and commissions closed with an increase of 5.5% compared to the same period last year, mainly due to commissions generated by the New York branch.
- NTI contribution increased (up 31.8% year-on-year) with a favorable evolution in the quarter (up 54.8%), due to the higher results from the Global Markets unit and the stake in Propel.
- Operating expenses fell compared to the previous year (down 2.8%), as a result of both the decrease in some discretionary expenses due to the pandemic and the containment plans implemented.
- Increase in the impairment on financial assets (up 44.3% year-on-year), explained mainly by the adjustment in the macroeconomic scenario due to the negative effects of COVID-19, mainly registered in the first quarter of 2020, and to higher loan-loss provisions to cover specific customers in the Oil & Gas sector. It should be noted that in the last quarter of 202, this line closed with a release of €58m, which explains the improvement of the cumulative cost of risk, which stood at 1.18% at the end of December 2020 compared to 1.69 at the end of September.