
Turkey
Highlights
- Significant credit growth driven by Turkish lira loans. Strong growth in foreign currency deposits.
- Outstanding performance of recurring revenue and efficiency ratio improvement.
- Reduction in the NPL ratio year-to date.
- Double digit growth in the main income statement margins.
Business activity (1)
(Year-on-year change at constant exchange rate. Data as of 31-12-20)
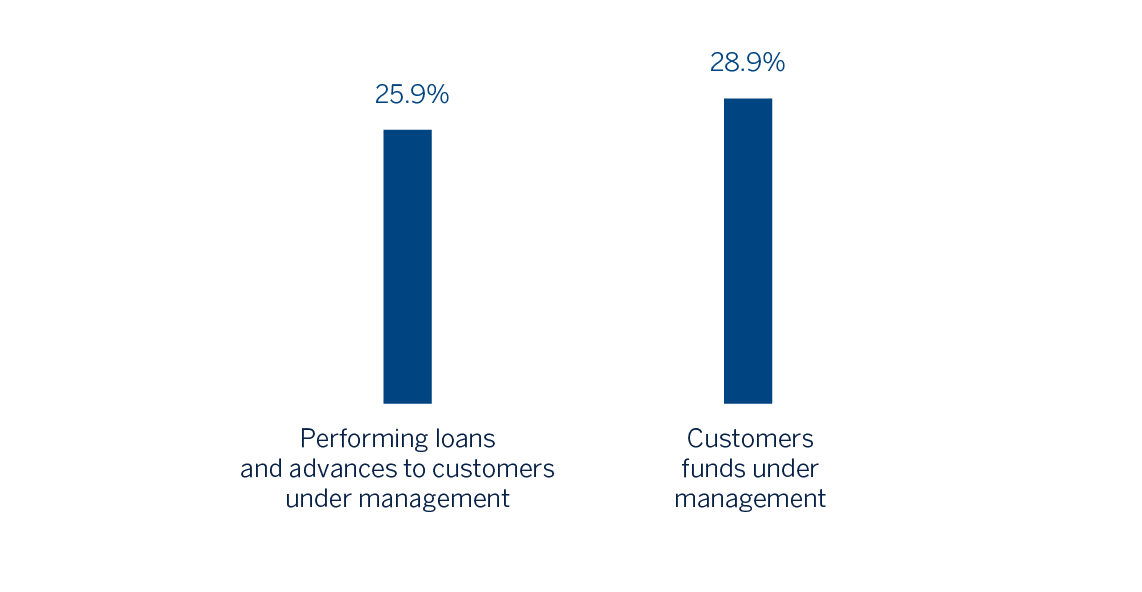
(1) Excluding repos.
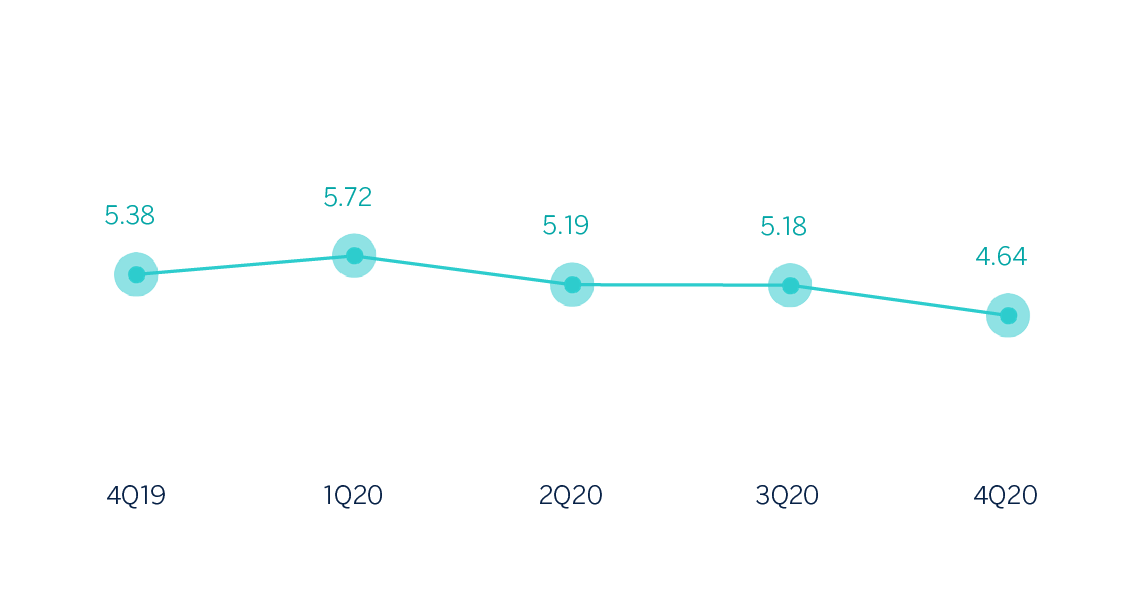
Net interest income/ATAs
(Percentage. Constant exchange rate)
Operating income
(Millions of euros at constant exchange rate)

(1) At current exchange rate: +7.1%.
Net attributable profit
(Millions of euros at constant exchange rate)

(1) At current exchange rate: +11.4%.
Financial statements and relevant business indicators (Millions of euros and percentage)
| Income statement | 2020 | ∆% | ∆% (1) | 2019 |
|---|---|---|---|---|
| Net interest income | 2,783 | (1.1) | 25.2 | 2,814 |
| Net fees and commissions | 510 | (28.8) | (9.9) | 717 |
| Net trading income | 227 | n.s. | n.s. | 10 |
| Other operating income and expenses | 53 | 7.3 | 35.8 | 50 |
| Gross income | 3,573 | (0.5) | 26.0 | 3,590 |
| Operating expenses | (1,029) | (15.3) | 7.3 | (1,215) |
| Personnel expenses | (561) | (17.2) | 4.8 | (678) |
| Other administrative expenses | (319) | (11.1) | 12.6 | (359) |
| Depreciation | (150) | (16.4) | 5.9 | (179) |
| Operating income | 2,544 | 7.1 | 35.6 | 2,375 |
| Impairment on financial assets not measured at fair value through profit or loss | (895) | (1.2) | 25.0 | (906) |
| Provisions or reversal of provisions and other results | (127) | (1.0) | 25.3 | (128) |
| Profit/(loss) before tax | 1,522 | 13.5 | 43.7 | 1,341 |
| Income tax | (380) | 21.7 | 54.1 | (312) |
| Profit/(loss) for the year | 1,142 | 11.0 | 40.5 | 1,029 |
| Non-controlling interests | (579) | 10.6 | 40.0 | (524) |
| Net attributable profit | 563 | 11.4 | 41.0 | 506 |
| Balance sheets | 31-12-20 | ∆% | ∆% (1) | 31-12-19 |
|---|---|---|---|---|
| Cash, cash balances at central banks and other demand deposits | 5,477 | (0.2) | 36.1 | 5,486 |
| Financial assets designated at fair value | 5,332 | 1.2 | 38.0 | 5,268 |
| Of which loans and advances | 415 | (6.6) | 27.3 | 444 |
| Financial assets at amortized cost | 46,705 | (8.9) | 24.2 | 51,285 |
| Of which loans and advances to customers | 37,295 | (7.9) | 25.5 | 40,500 |
| Tangible assets | 901 | (19.4) | 9.9 | 1,117 |
| Other assets | 1,170 | (7.1) | 26.7 | 1,260 |
| Total assets/liabilities and equity | 59,585 | (7.5) | 26.1 | 64,416 |
| Financial liabilities held for trading and designated at fair value through profit or loss | 2,336 | 7.0 | 45.8 | 2,184 |
| Deposits from central banks and credit institutions | 3,381 | (24.4) | 3.0 | 4,473 |
| Deposits from customers | 39,353 | (4.8) | 29.8 | 41,335 |
| Debt certificates | 3,503 | (18.0) | 11.8 | 4,271 |
| Other liabilities | 8,476 | (10.6) | 21.9 | 9,481 |
| Economic capital allocated | 2,535 | (5.1) | 29.3 | 2,672 |
| Relevant business indicators | 31-12-20 | ∆% | ∆% (1) | 31-12-19 |
|---|---|---|---|---|
| Performing loans and advances to customers under management (2) | 36,638 | (7.6) | 25.9 | 39,662 |
| Non-performing loans | 3,183 | (13.1) | 18.5 | 3,663 |
| Customer deposits under management (2) | 39,346 | (4.8) | 29.8 | 41,324 |
| Off-balance sheet funds (3) | 3,425 | (12.3) | 19.5 | 3,906 |
| Risk-weighted assets | 53,021 | (6.4) | 27.6 | 56,642 |
| Efficiency ratio (%) | 28.8 | 33.8 | ||
| NPL ratio (%) | 6.6 | 7.0 | ||
| NPL coverage ratio (%) | 80 | 75 | ||
| Cost of risk (%) | 2.13 | 2.07 |
(1) Figures at constant exchange rate.
(2) Excluding repos.
(3) Includes mutual funds and other off-balance sheet funds.
Unless expressly stated otherwise, all comments below on rates of changes for both activity and income, will be presented at constant exchange rates. These rates, together with changes at current exchange rates, can be observed in the attached tables of the financial statements and relevant business indicators.
Activity
The most relevant aspects related to the area’s activity during 2020 were:
- Lending activity (performing loans under management) increased by 25.9% year-to-date mainly driven by a growth in Turkish lira loans (up 33.6%) which was supported by commercial and consumer loans. Foreign-currency loans (in U.S. dollars) fell during 2020 (down 5.4%).
- Lending growth was accelerated in the first half the year favored by the low interest rate environment, yet as the interest rates started to increase its loan growth moderated in the second half of the year. By segments;
- Turkish lira commercial loans performed remarkably well year-on-year (up 51.6%) mainly thanks to the Credit Guarantee Fund utilizations and short term commercial lending.
- Additionally, retail loans increased (up 22.3%) driven by both consumer loans including mortgages (up 22.6%) and credit cards (up 21.5%), thanks to the recovering economic activity with the steps taken towards new normal in the COVID-19 environment.
- In terms of asset quality, the NPL ratio decreased from December 2019 and stood at 6.6%. The NPL coverage ratio increased to 80% as of December 31, 2020 compared to the previous year.
- Customer deposits under management (66% of total liabilities in the area as of December 31, 2020) remained the main source of funding for the balance sheet and increased by 29.8% year-to-date. It is worth mentioning the positive performance of demand deposits which increased by 73.9% year-to-date and now represent 51% of total customer deposits, as well as the off-balance sheet funds which grew by 19.5% during the same period. Foreign currency demand deposit grew by 84.6% year-to-date, with remarkable increases in second and third quarters, mainly due to the dollarization impact and increasing demand towards gold deposits.
Results
Turkey generated a net attributable profit of €563m in 2020, 41.0% higher than the same period of the previous year, despite a decrease in the quarter (down -62.6%). The most significant aspects of the year-on-year evolution in the income statement are the following:
- Net interest income grew (up 25.2%) mainly thanks to good management of customer spreads, higher activity volume and remarkable contribution from inflation-linked bonds.
- Net fees and commissions contracted by -9.9% on a year-on-year basis, mainly due to the changes in fees regulation that came into force in March 2020 and lower activity levels due to the impact of COVID-19. With the beginning of the third quarter, this line started to record growth thanks to the recovery of the economic activity with the gradual steps taken towards normalization.
- Good performance of the NTI, which contributed €227m in 2020 compared to €10m in 2019. This is mainly the result of the good performance of foreign currency positions and trading operations.
- Other income and operating expenses increased by 35.8% year-on-year, mainly due to the positive contribution of non-financial activities (renting activity) and higher insurance activity net results.
- Operating expenses increased by 7.3%, significantly below the average inflation rate (12.28%), which is also supported by the reduction in some discretionary expenses due to COVID-19. As a result of the growth of the gross income well above the growth of expenses, the efficiency ratio improved 5 percentage points during the year to 28.8%.
- Impairment losses on financial assets increased by 25.0% primarily due to higher provisions for specific clients in the commercial portfolio. As a result, the cumulative cost of risk at the end of December stood at 2.13%.
- The line provisions and other results closed in 2020 with a loss of €127m, which is a similar level to the one registered in the previous year, mainly due to provisions for special funds and for contingent liabilities and commitments.