
Mexico
Highlights
- Slight deceleration of activity, impacted by the macroeconomic environment.
- Solid liquidity position.
- Controlled expenses growing significatively under the inflation and the strength of the gross income.
- Net attributable profit affected by the significant increase in the impairment on financial assets line.
Business activity (1)
(Year-on-year change at constant exchange rate. DATA AS OF 31-12-20)
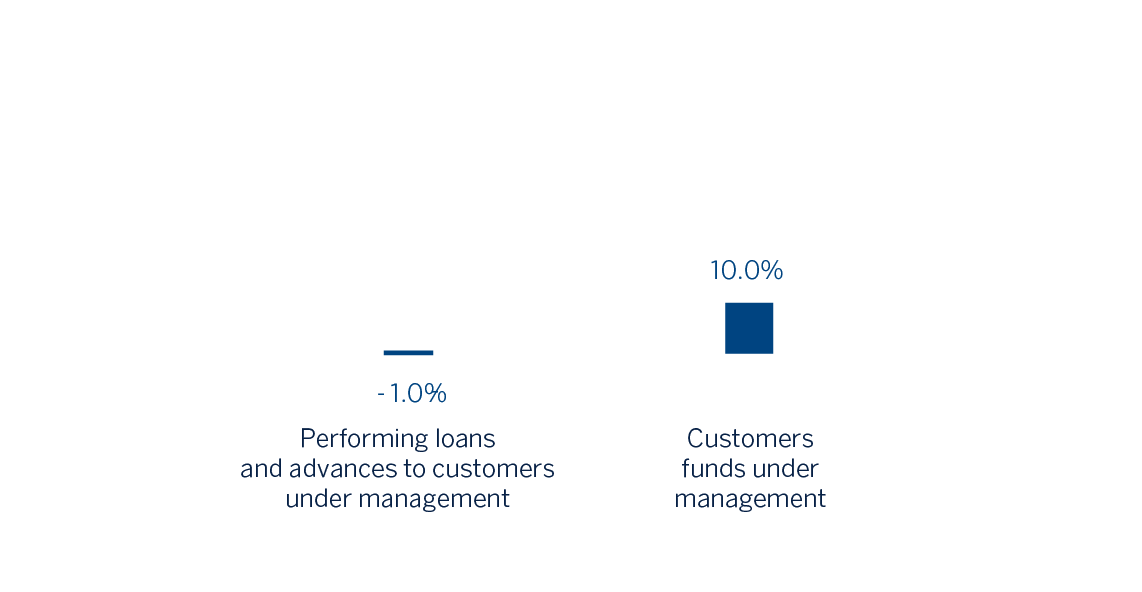
(1) Excluding repos.
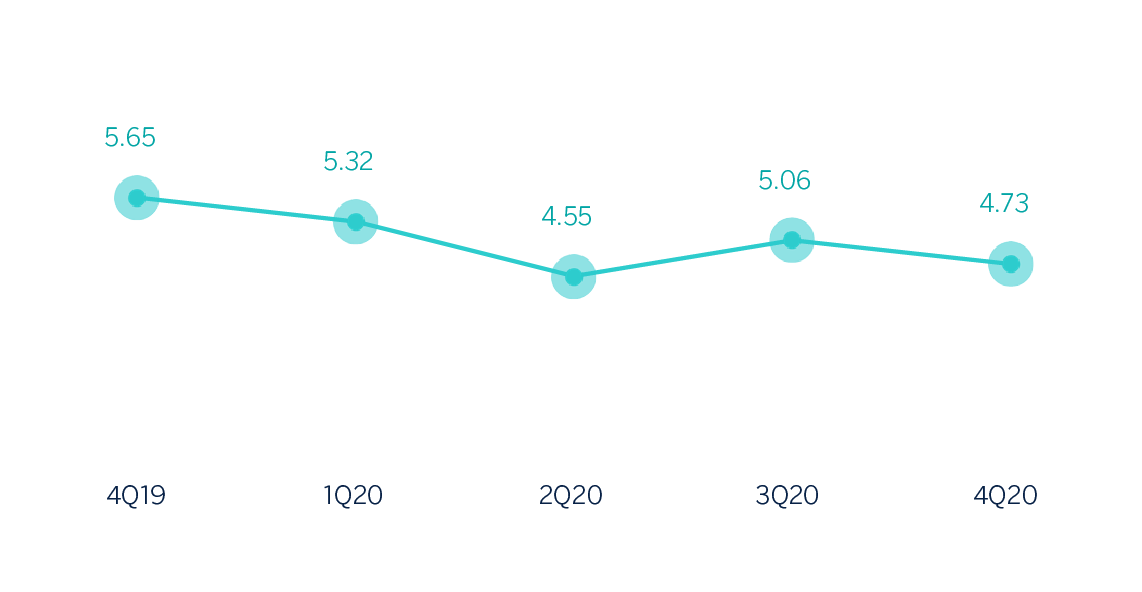
Net interest income/ATAs
(Percentage. Constant exchange rate)
Operating income
(Millions of euros at constant exchange rate)
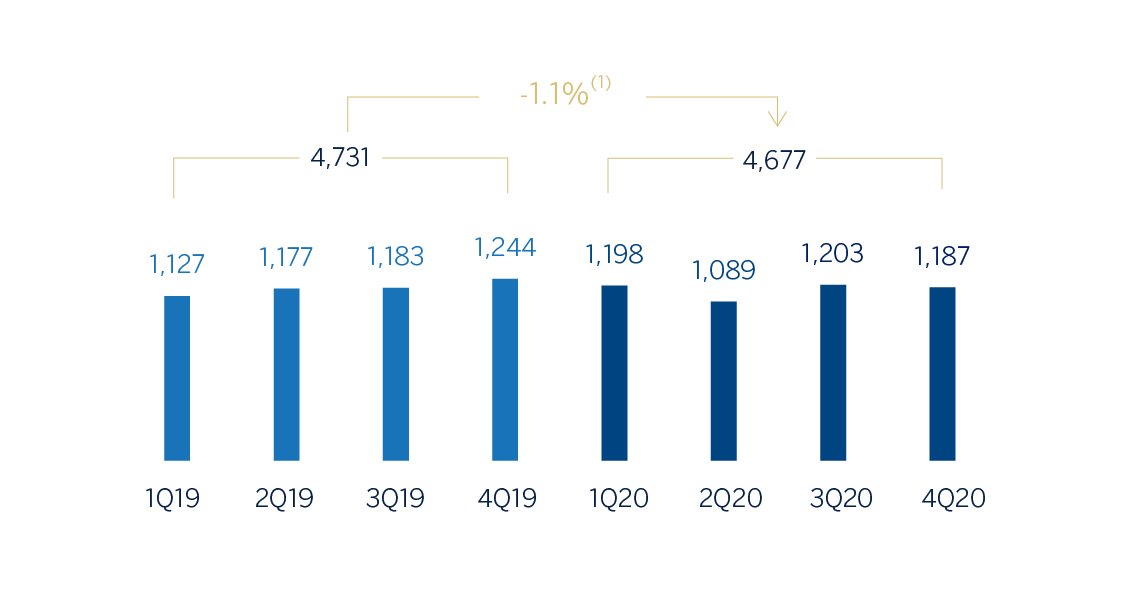
(1) At current exchange rate: -13.1%.
Net attributable profit
(Millions of euros at constant exchange rate)
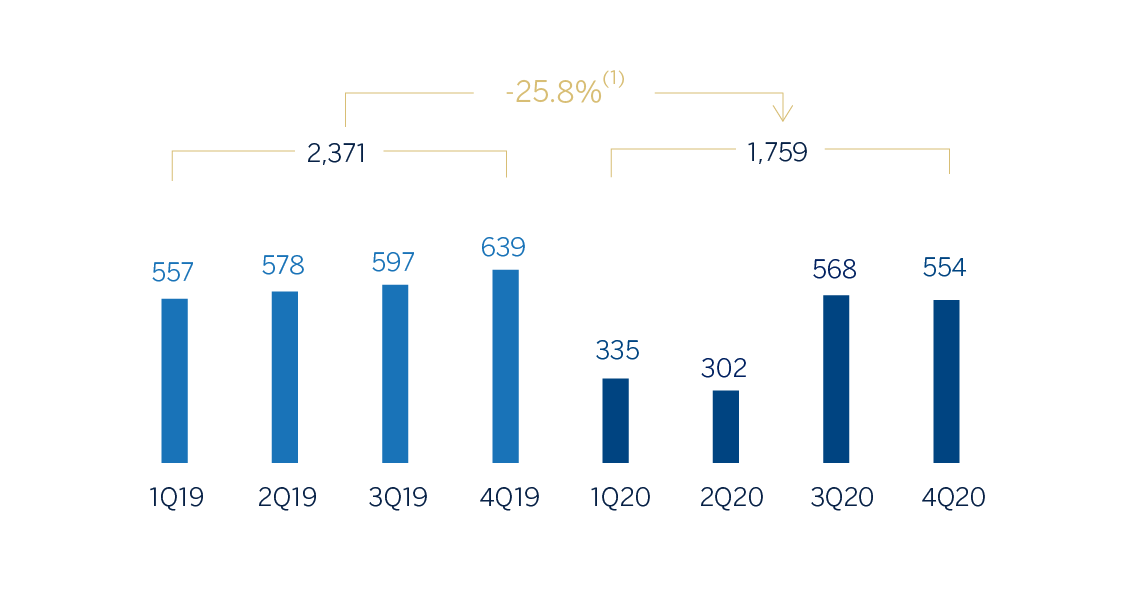
(1) At current exchange rate: -34.8%.
Financial statements and relevant business indicators (Millions of euros and percentage)
| Income statement | 2020 | ∆% | ∆% (1) | 2019 |
|---|---|---|---|---|
| Net interest income | 5,415 | (12.8) | (0.7) | 6,209 |
| Net fees and commissions | 1,065 | (17.9) | (6.6) | 1,298 |
| Net trading income | 423 | 36.4 | 55.3 | 310 |
| Other operating income and expenses | 114 | (46.2) | (38.8) | 212 |
| Gross income | 7,017 | (12.6) | (0.5) | 8,029 |
| Operating expenses | (2,340) | (11.5) | 0.7 | (2,645) |
| Personnel expenses | (967) | (14.0) | (2.1) | (1,124) |
| Other administrative expenses | (1,061) | (9.7) | 2.8 | (1,175) |
| Depreciation | (311) | (9.9) | 2.5 | (346) |
| Operating income | 4,677 | (13.1) | (1.1) | 5,384 |
| Impairment on financial assets not measured at fair value through profit or loss | (2,172) | 28.0 | 45.6 | (1,698) |
| Provisions or reversal of provisions and other results | (33) | n.s. | n.s. | 5 |
| Profit/(loss) before tax | 2,472 | (33.0) | (23.8) | 3,691 |
| Income tax | (713) | (28.1) | (18.2) | (992) |
| Profit/(loss) for the year | 1,759 | (34.8) | (25.8) | 2,699 |
| Non-controlling interests | (0) | (32.6) | (23.3) | (0) |
| Net attributable profit | 1,759 | (34.8) | (25.8) | 2,699 |
| Balance sheets | 31-12-20 | ∆% | ∆% (1) | 31-12-19 |
|---|---|---|---|---|
| Cash, cash balances at central banks and other demand deposits | 9,159 | 41.2 | 62.4 | 6,489 |
| Financial assets designated at fair value | 36,360 | 15.8 | 33.2 | 31,402 |
| Of which loans and advances | 2,589 | 233.2 | 283.4 | 777 |
| Financial assets at amortized cost | 59,814 | (9.6) | 4.0 | 66,180 |
| Of which loans and advances to customers | 50,002 | (13.9) | (0.9) | 58,081 |
| Tangible assets | 1,647 | (18.5) | (6.3) | 2,022 |
| Other assets | 3,224 | 8.0 | 24.3 | 2,985 |
| Total assets/liabilities and equity | 110,204 | 1.0 | 16.2 | 109,079 |
| Financial liabilities held for trading and designated at fair value through profit or loss | 23,801 | 9.3 | 25.7 | 21,784 |
| Deposits from central banks and credit institutions | 5,122 | 141.9 | 178.3 | 2,117 |
| Deposits from customers | 54,052 | (3.4) | 11.2 | 55,934 |
| Debt certificates | 7,387 | (16.4) | (3.8) | 8,840 |
| Other liabilities | 14,507 | (6.5) | 7.6 | 15,514 |
| Economic capital allocated | 5,336 | 9.1 | 25.6 | 4,889 |
| Relevant business indicators | 31-12-20 | ∆% | ∆% (1) | 31-12-19 |
|---|---|---|---|---|
| Performing loans and advances to customers under management (2) | 50,446 | (13.9) | (1.0) | 58,617 |
| Non-performing loans | 1,818 | 23.0 | 41.6 | 1,478 |
| Customer deposits under management (2) | 53,775 | (2.8) | 11.8 | 55,331 |
| Off-balance sheet funds (3) | 22,524 | (7.9) | 5.9 | 24,464 |
| Risk-weighted assets | 60,797 | 2.5 | 18.0 | 59,299 |
| Efficiency ratio (%) | 33.3 | 32.9 | ||
| NPL ratio (%) | 3.3 | 2.4 | ||
| NPL coverage ratio (%) | 122 | 136 | ||
| Cost of risk (%) | 4.02 | 3.01 |
(1) Figures at constant exchange rate.
(2) Excluding repos.
(3) Includes mutual funds and other off-balance sheet funds.
Unless expressly stated otherwise, all the comments below on rates of change, for both activity and results, will be given at constant exchange rates. These rates, together with changes at current exchange rates, can be found in the attached tables of financial statements and relevant business indicators.
Activity
The most relevant aspects related to the area's activity during the year 2020 were:
- Lending activity (performing loans under management) decreased slightly (down 1.0% year-on-year), due to the economic weakness resulting from the closure of non-essential activities related to the pandemic. The wholesale portfolio fell slightly in 2020 (down 0.7% year-on-year) due to the amortizations related to the credit facilities registered in the first quarter of the year. On the other hand, the retail portfolio registered a decrease compared to December 2019 (down 0.5%), mainly due to the fact that the consumer and credit card portfolios recorded lower balances, affected by the lower economic activity resulting from the pandemic. This was partially offset by a year-on-year increase in the mortgage portfolio (up 7.4%).
- As for the asset quality indicators, the NPL ratio stood above the figure at the end of 2019 (up 3.3%), with an increase in the balance of non-performing loans in the consumer, credit cards and mortgage portfolios, mainly related to portfolios that participated in the support programs. For its part, the coverage ratio stood below December 2019 level, at 122%.
- Customer deposits under management increased by 11.8%, supported by the growth of demand deposits that offset the decrease of time deposits, due to the preference of customers to have their balance liquid in an environment of lower interest rates and uncertainty due to the pandemic. Off-balance sheet funds also performed well in 2020 (up 5.9%).
Results
BBVA Mexico achieved a net attributable profit of €1,759m in 2020, which is a 25.8% reduction compared to the previous year. This was due to the increase in the impairment on financial assets, generated by additional provisions made during the first half of the 2020, derived from COVID-19. The most relevant aspects related to the income statement are summarized below:
- Net interest income closed almost in line with the end of 2019 (down 0.7%). The appropriate management and optimization of the net interest income has managed to offset the lower dynamism of the retail portfolio and a reduction of 300 basis points in the benchmark rates throughout 2020. Additionally, this reflects the application of customer support programs during the first half and a change in the portfolio mix, with a higher percentage of wholesale customers for most of 2020 and stood at the end of December at pre-pandemic levels.
- Net fees and commissions fell (down 6.6%), mainly as a result of the closure of non-essential activities in Mexico, which caused a lower transactionality with credit cards. Likewise, the lower activity in investment banking and the increase in transactions made through digital channels, which do not generate fees and commissions for individual customers, also influenced this decrease.
- NTI continued to perform well, with a 55.3% year-on-year growth, mainly derived from the result of the Global Markets unit, as well as greater earnings from foreign exchange operations and capital gains from the ALCO portfolio sales.
- The other operating income and expenses line registered a year-on-year decrease of 38.8%, as a result of a greater contribution to the Deposit Guarantee Fund due to the higher volume deposited by customers and a lower performance of the insurance business, as a result of an increase in claims.
- Operating expenses closed at similar levels to the previous year (up 0.7%), with a growth that is below the average inflation levels for the year (up 3.4%) reflecting the effort to maintain strict control, despite additional expenses in medical supplies to ensure the health and safety of the employees and customers.
- The impairment on financial assets line increased by 45.6%, fundamentally due to the additional provisions caused by COVID-19, mainly registered in the first half of 2020, which include the deterioration in the macroeconomic scenario compared to the one originally forecasted in early 2020. With regard to the cumulative cost of risk as of December 2020, it stood at 4.02% following the upturn in March.
- The provisions and other results line showed an unfavorable comparison at €-33m compared with a positive result of €5m in the previous year, and mainly includes higher provisions for contingent liabilities arising from COVID-19.