
BBVA’s operational risk profile is shown below by class of risk after assessing the risks, resulting in the following monetary distribution:
Chart 22. BBVA’s operational risk profile by class of risk after assessing the risks

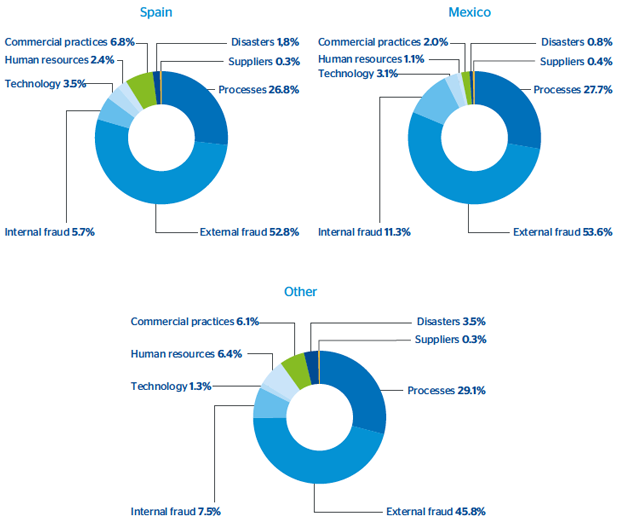
The charts below show the distribution of historical operational losses by class of risk and country, revealing a concentration of losses as a result of the materialization of external fraud events and processes.
Chart 23. Distribution of historical operational losses by class of risk and country