

4.5.1. General information
Authorization by the Bank of Spain for the use of the IRB method
The following is a list of the models authorized by the Bank of Spain for the purpose of their use in the calculation of capital requirements.
Table 26. Models authorized by the Bank of Spain for the purpose of their use in the calculation of capital requirements
| Institution | Portfolio |
|---|---|
| BBVA S.A. | Financial institutions |
|
|
Public institutions |
|
|
Consumer finance |
|
|
Credit cards |
|
|
Corporates |
| Uno-E Bank | SMEs |
|
|
Developers |
| BBVA Ireland | Retail mortgages |
|
|
Specialist finance |
|
|
Autos Finanzia |
| BBVA Bancomer | Retail Revolving (Credit Cards) |
| BBVA Group | Equity |
The approval of the models by the Bank of Spain includes both own estimations of the probability of default (PD), loss given default (LGD) and the internal estimation of credit conversion factors (CCFs).
The Group maintains its calendar for receiving approval for additional advanced internal models in different types of risks and geographical areas.
Structure of internal rating systems and relationship between internal and external ratings
The Group has rating tools for each one of the exposure categories listed in the Basel Accord.
The retail portfolio has scoring tools for determining the credit quality of transactions on the basis of information on the transaction itself and on the customer. The scoring models are algorithms calculated using statistical methods that score each transaction. This score reflects the transaction’s level of risk and is in direct relation to its probability of default (PD).
These decision models are the basic tool for deciding who should receive a loan and the amount to be granted, thereby contributing to both the arrangement and management of retail-type loans.
For the wholesale portfolio, the Group has rating tools that, unlike scorings, do not assess transactions but rather, customers. The Group has different tools for rating the various customer segments: small companies, corporates, government and other government agencies, etc. In those wholesale portfolios where the number of defaults is very low (sovereign risks, corporates, financial institutions) the internal information is supplemented by the benchmarks of external rating agencies.
The PD estimates made by the Group are transferred to the Master Scale, enabling a comparison to be made with the scales used by external agencies. This is shown below.
Table 27. BBVA master ratings scale
|
|
Probability of default (in basis points) | ||
|---|---|---|---|
| Internal ratings Abridged scale (22 groups) |
Average | Minimum from ≥ |
Maximum |
| AAA | 1 | – | 2 |
| AA+ | 2 | 2 | 3 |
| AA | 3 | 3 | 4 |
| AA– | 4 | 4 | 5 |
| A+ | 5 | 5 | 6 |
| A | 8 | 6 | 9 |
| A– | 10 | 9 | 11 |
| BBB+ | 14 | 11 | 17 |
| BBB | 20 | 17 | 24 |
| BBB– | 31 | 24 | 39 |
| BB+ | 51 | 39 | 67 |
| BB | 88 | 67 | 116 |
| BB– | 150 | 116 | 194 |
| B+ | 255 | 194 | 335 |
| B | 441 | 335 | 581 |
| B– | 785 | 581 | 1,061 |
| CCC+ | 1,191 | 1,061 | 1,336 |
| CCC | 1,500 | 1,336 | 1,684 |
| CCC– | 1,890 | 1,684 | 2,121 |
| CC+ | 2,381 | 2,121 | 2,673 |
| CC | 3,000 | 2,673 | 3,367 |
| CC– | 3,780 | 3,367 | 4,243 |
Use of internal estimations for purposes other than the calculation of capital requirements
The Group’s internal estimates are a vital component of management based on value creation, providing criteria for assessing the risk-return trade-off.
These measures have a broad range of uses, from the adoption of strategic business decisions through to the individual admission of transactions.
Specifically, internal estimations are used in everyday business in support of credit risk management through their inclusion in admission and monitoring processes, as well as in the pricing of transactions.
The management use of performance metrics that consider expected loss, economic capital and risk-adjusted return enables the monitoring of portfolios and the assessment of non-performing positions, among others.
Process for managing and recognizing the effects of credit risk mitigation
The Group uses risk mitigation techniques for exposures pertaining to the wholesale portfolio by replacing the obligor’s PD with that of the guarantor, in those cases in which the latter is eligible and their PD is lower than the obligor’s.
In retail admission processes, the scoring contains the effect of the guarantor, and the recovery flows that are forthcoming throughout the cycle reflect the recoveries related to the guarantees associated with the contracts. This means that the effect of the guarantees is taken into account in the actual estimation of the loss given default for retail portfolios.
Mechanisms used for controlling internal rating systems
The entity carries out the control and monitoring of the rating systems and metrics for risk management for private individuals, SMEs and the self-employed, corporates and institutions. The activities are carried out, within certain analytical and qualitative fields, by realizing periodic 360º monitoring of all impacts of the tools as well as their internal function in terms of efficiency and effectiveness.
Global understanding of the systems allows action plans to be established, with a follow-up to ensure their proper execution. The weaknesses of the rating tools are thus identified and managed. The monitoring function is the main driving force of new developments and evolving maintenance, which allow the business interests of the entity to be aligned with regulatory requirements and management needs within a framework of analytical, technical and technological capacities.
In general, there is a series of corporate management programs that establish the main lines and minimum contents determining the management and/or supervision of the different credit risk models, as well as defining the metrics for their correct control.
More specifically, these corporate management programs will be adjusted to each of the rating tools of a business area within a time horizon adapted to the nature of the tool. Periodically, an overall monitoring and review of compliance with the thresholds agreed under the management program will be carried out to detect situations that could potentially require an adjustment to the models and/or credit policies and to take early corrective actions to minimize the impact of such situations.
Analysis, in the methodological sphere, is defined as the monitoring of the predictive capabilities of the models, backtesting calibration of the parameters, proper granularity and concentration, sample stability of input, as well as traceability, integrity and consistency.
The use of rating systems by the different areas is overseen from the context of integration in management. This context defines parameter sensitivity tests, stress-tests of estimates, proper use of the parameters in the portfolio management to facilitate decision-making, control of exposure without rating, risk policies and the framework for delegating tasks, structures of decision-making committees, implementation risk evaluation, proper technological environment, evaluation of the inclusion of the parameters in corporate applications, proper follow-up of the training of users to guarantee its proper implementation and full comprehension, follow-up of the correct structure and quality of documentation, as well as all other activities that ensure the proper use of management metrics.
Apart from the corporate management programs mentioned above, access to the internal rating systems is based on IT system-authorized profiles that ensure only the customer loan management supervisors can see the scoring and rating.
Control of the capital process is performed by risk units that are independent of the units that calculate the scoring and rating and which, therefore, are users of the internal rating system. These control mechanisms are established at different levels of the process, such as at input, execution and final outputs, and involve both the integrity of the data and their accuracy and correctness.
Description of the internal rating process
There follows a description of the internal classification processes according to each customer category:
- Central banks and central governments: For this segment, the assignment of ratings is made by the Risk units appointed for this purpose, which periodically analyze this type of customers, rating them according to the parameters included in the corresponding rating model. This model comprises different tools depending on the type of country: developed, emerging or peripheral. Sovereign ratings are generated in local and foreign currency for these three tools, as well as a transfer rating, which evaluates the risk of inconvertibility/transfer restrictions.
In general the rating obtained is based on the ratings of external agencies, where they exist, except for the emerging economies tool in foreign currency. In this case, the ratings are calculated based on an in-house model that establishes a relationship between the score given to each country by the corresponding unit and the empirical PD of the rating agencies. This classifies the countries on the BBVA master scale.
In the case of emerging countries with presence of BBVA subsidiaries or branches, the rating in local currency is adjusted to that obtained by the emerging countries’ tool under the authorization of the Risk Committee assigned for this purpose.
- Institutions: The rating of Public Institutions is generally provided by the risk units responsible for their approval, on a yearly basis, coinciding with the review of customer risk or with the reporting of their accounts.
In the case of Financial Institutions, the Risk unit responsible makes a regular assessment of this type of customer, continuously monitoring their evolution on domestic and international markets. External ratings are a key factor in assigning ratings for financial institutions.
- Corporates: Includes the rating of exposures with corporate business groups. The result is influenced by both qualitative (business positioning, financial flexibility, etc.) and quantitative indicators (size of group by sales, debt levels, etc.). The rating of these customers is generally calculated within the framework of the annual risk review process, or the admission of new operations. The responsibility for the assessment lies with the units originating the risk, while those approving it validate it when the decision is taken.
- Corporates: This segment also takes into account quantitative factors derived from economic and financial information, as well as qualitative factors related to the age of the company, the sector, the quality of its management, etc. As in the case of the corporate sector, the rating tends to be parallel to the admission process, so that responsibility for the rating is with the unit originating the risk, while the decision-making body validates it.
- Specialist Finance: For this segment, the Group has chosen to apply the supervisory slotting criteria approach, as included in the Basel Accord of June 2004 and in the Solvency Circular.
- Developers: The rating of real-estate developers allows the rating of both the customers who are developers and the individual real-estate projects. Its use makes it easier to monitor and rate projects during their execution phase, as well as enriching the admission process.
In general in the wholesale area, the rating of customers is not limited to admission, as the ratings are updated according to new information available at any time (economic and financial data, changes in the company, external factors, etc.).
- Retail: This has been broken down into each one of the exposure categories referred to by the correlations foreseen in the sections defined in the Solvency Circular.
One of the most important processes in which scoring is fully integrated at the highest level and in all decision-making areas is the Group’s process for approving retail transactions. Scoring is an important factor for the analysis and resolution of transactions and it is a mandatory requirement to include it in decision-making on risk in those segments for which it has been designed. In the process of marketing and approving retail transactions, the manager is responsible for marketing management, the quality of the risk and the return, in other words, the customer’s comprehensive management, attending to the processes of admission, monitoring and control.
The rating process is as follows for each specific category of retail exposure:
- Mortgages, consumer finance and retail credit cards - Spain: The manager collects data on the customer (personal, financial, banking relationship information) and on the operation (LTV, amount, maturity, destination etc.) and calculates the rating of the transaction
- with the scoring. The decision of whether it is approved is made based on the results issued by the model.
- Autos Finanzia: The financing application may enter through the call center or be directly recorded in Finanzianet by our authorized dealers. The necessary information on the customer (personal, financial information, authorization of the consult from the external bureau of credit) and on the transaction (maturity, amount, etc.) is recorded to rate the transaction with the scoring. Once the validity of the information provided is obtained, the decision of whether to approve it is made based on the results issued by the model.
- Retail Revolving (BBVA Bancomer credit cards): The manager or specialist party gathers the necessary information on the customer (personal, financial information and authorization of the consult from the external bureau of credit) and on the transaction (limit requested) to rate the transaction with the scoring. There are additional processes for validating and checking this information through the back office or operational support areas. The decision of whether Proactive - Spain: Each month all the customers who have asset positions in credit cards, consumer finance or mortgages and liabilities positions in credit cards and consumer finance, are rated according to information on their behavior.
- Equity: For its portfolio position registered as equity, the Group is applying the rating obtained for the customer as a result of their classification in the lending process.
Definitions, methods and data for estimating and validating risk parameters
The estimation of the parameters is based on the uniform definition of default established at Group level. Specifically, for a contract or customer to be considered in a situation of default, the provisions of section 4.1.1 must be met, in line with current regulations.
Specifically, there are two approaches within the Group for considering default and estimating parameters:
- The contract-level approach is applied within the sphere of retail risk. Each customer transaction is dealt with as an independent unit in terms of credit risk. Therefore, non-compliance with credit obligations towards the bank is handled at the transaction level, regardless of the behavior of the customer with respect to other obligations.
- The customer-level approach is applied to the remainder of the portfolio. The significant unit for defining default is the customer’s sum of contracts, which enter a situation of default en masse when the customer defaults.
In addition, to avoid including defaults for small amounts in the estimations, defaulted volumes are to pass through a materiality filter that depends on the type of customer and transaction.
Estimating parameters
In the case of Spain and Mexico, the Group has an RAR information system that reflects exposure to credit risk in the Group’s different portfolios included in advanced internal models.
This information system guarantees the availability of historical data recorded by the Group, which are used to estimate the parameters of Probability of Default (PD), Loss Given Default (LGD) and Credit Conversion Factors (CCF). These are then used to calculate the regulatory capital using the advanced measurement approach, economic capital and expected loss by credit risk. Other sources of information for the Bank may be used in addition, depending on any new needs detected in the estimation process. Internal estimations of the PD, LGD and CCF parameters are made for all the Group’s portfolios.
In the case of low default portfolios (LDP), in which the number of defaults tends to be insufficient for obtaining empirical estimates, use is made of data from external agencies that are merged with the internal information available and expert criteria.
There follows a detail of the estimation methodologies used for the PD, LGD and CCF risk parameters.
a. Probability of default (PD)
The methodology used for estimating the PD in those cases that have a mass of internal data of sufficient size is based on the creation of pools of exposures. The groups proposed with a view to calibration are defined by pooling contracts together seeking to achieve intra-group uniformity in terms of credit quality and differentiation with all the other risk groups. The largest possible number of pools is defined in order to allow a suitable discrimination of risk. The basic metric used for making these groupings is the score, being supplemented by other metrics relevant to PD that are proven to be sufficiently discriminating depending on the portfolio.
Once the pools of exposures have been defined, the average empirical PD recorded for each one is obtained and adjusted to the cycle. This metric provides stable estimates over the course of the economic cycle, referred to as PD-TTC (Through the Cycle). This calculation considers the portfolio’s track record and provides long-term levels of PD.
In low default portfolios (LDPs) the empirical PDs allocated by external credit assessment institutions are used to obtain the PD of internal risk groups.
Finally, in customer-focused portfolios there is a Master Scale, which is simply a standard and uniform rule for credit levels that makes it possible to make comparisons of credit quality in the Group’s different portfolios.
b. Loss given default (LGD)
As a general rule, the method used to estimate LGD in portfolios with a sufficient number of defaults is Workout LGD. Here, the LGD of a contract is obtained as a quotient of the sum of all the financial flows recorded during the recovery process that takes place when a transaction defaults, and the transaction’s exposure at the time of the default.
This estimate is made by considering all the historical data recorded in internal systems. When making the estimates, there are transactions that have already defaulted but for which the recovery process is still ongoing. The loss given default recorded at the time of the estimate is therefore higher than it will ultimately be. The necessary adjustments are made in these cases so as not to distort the estimate.
These estimates are made by defining uniform risk groups in terms of the nature of the operations that determine loss given default. They are made in such a way that there are enough groups for each one to be distinguishable and receive a different estimate.
In keeping with the guidelines set out by the rules, the estimates are made by distinguishing between wholesale and retail type exposures.
There is insufficient historical experience to make a robust estimation in low default portfolios (LDP) using the Workout LGD method, so external sources of information are used, combined with internal data to provide the portfolio with a representative rate of loss given default.
The loss given default rates estimated according to the internal databases the Group holds are conditioned to the moment of the cycle of the data window used, since loss given default varies over the economic cycle. Hence, two concepts can be defined: long-term loss given default, referred to as Long-Run LGD (LRLGD), and loss given default in a period of stress in the cycle, called Downturn LGD (DLGD).
LRLGD is calculated by making an adjustment to capture the difference between the loss given default obtained empirically with the available sample and the average loss given default observed throughout the economic cycle if the observation is complete.
In addition, the LGD observed in a period of stress in the economic cycle (DLGD) is determined.
These estimates are made for those portfolios whose loss given default is noticeably sensitive to the cycle. The different ways in which the recovery cycles can conclude are determined for each portfolio where this LGD in conditions of stress has not yet been observed, and the level these parameters would have in a downturn situation are estimated.
c. Credit conversion factor (CCF)
As with the two preceding parameters, the exposure at the moment of default is another of the necessary inputs for calculating expected loss and regulatory capital. A contract’s exposure usually coincides with its balance. However, this does not hold true in all cases. For example, for those products with explicit limits, such as credit cards or credit lines, the exposure should incorporate the potential increase in the balance that may be recorded up to the time of default.
In observance of regulatory requirements, exposure is calculated as the drawn balance, which is the real risk at any specific moment, plus a percentage (CCF) of the undrawn balance, which is the part that the customer can still use until the available limit is reached. Therefore, the CCF is defined as the percentage of the undrawn balance that is expected to be used before default occurs.
CCF is estimated by using the cohort approach, analyzing how the exposure varies from a pre-established reference date through to the moment of default, obtaining the average performance according to the relevant metrics.
Different approaches are used for wholesale and retail type exposures. The contract approach analyzes the exposure’s evolution until the contract’s moment of breach of contract, whereas the customer approach analyzes the exposure’s evolution through to the moment of breach by the customer.
Once again, in low default portfolios (LDP) there is insufficient historical experience to make a reliable calculation with the Workout LGD method defined. In this case, too, use is made of external sources that are combined with internal data to provide a representative CCF of the portfolio.
4.5.2. Exposure values by category and obligor grade
The following table presents the information on credit risk by method of internal classifications (IRB) by obligor grade for the different categories of exposure. The information shown is balance-sheet volume, off-balance-sheet volume, exposure, EAD, PD-TTC and Downturn LGD and RW (internal estimates approved by the Bank of Spain):
Table 28. Advanced approach. Exposure values by category and obligor grade
2013
(Millions of euros)
| Categories of exposure | Balance on balance sheet reassigned (1) | Balance off balance sheet reassigned (2) | Exposure reassigned (3) = (1+2) | EAD (4) | PD-TTC (%) |
DLGD (%) |
RWA | RW (%) |
|---|---|---|---|---|---|---|---|---|
| Central Governments and Central Banks | 2,707 | 808 | 3,515 | 3,115 | 1,36 | 37,55 | 213 | 6.84% |
| From AAA to AA– | 1,097 | 153 | 1,250 | 1,177 | 0,02 | 31,14 | 37 | 3.14% |
| From A+ to A– | 1,147 | 527 | 1,674 | 1,409 | 0,10 | 42,57 | 7 | 0.52% |
| From BBB+ to BBB– | 337 | 104 | 441 | 389 | 0,17 | 40,02 | 32 | 8.11% |
| From BB+ to BB– | 53 | 22 | 75 | 64 | 0,79 | 21,47 | 46 | 72.47% |
| From B+ to B– | 37 | 0 | 37 | 37 | 6,52 | 42,99 | 55 | 148.16% |
| C | 0 | 0 | 0 | 0 | 21,16 | 40,23 | 0 | 228.57% |
| D | 36 | 2 | 38 | 37 | 100,00 | 46,43 | 36 | 95.42% |
| Institutions | 80,993 | 8,161 | 89,155 | 85,558 | 0,57 | 19,33 | 12,403 | 14.50% |
| From AAA to AA– | 11,242 | 415 | 11,657 | 11,459 | 0,04 | 17,78 | 246 | 2.15% |
| From A+ to A– | 37,307 | 1,464 | 38,771 | 38,189 | 0,08 | 17,43 | 2,346 | 6.14% |
| From BBB+ to BBB– | 24,221 | 6,010 | 30,231 | 27,534 | 0,25 | 23,71 | 6,437 | 23.38% |
| From BB+ to BB– | 6,516 | 215 | 6,731 | 6,640 | 0,79 | 13,65 | 1,731 | 26.06% |
| From B+ to B– | 1,122 | 40 | 1,162 | 1,142 | 3,54 | 13,29 | 501 | 43.88% |
| C | 381 | 2 | 383 | 382 | 21,21 | 44,86 | 975 | 255.32% |
| D | 206 | 14 | 221 | 212 | 100,00 | 42,89 | 167 | 78.94% |
| Corporates | 63,196 | 49,507 | 112,703 | 89,644 | 14,09 | 40,60 | 56,098 | 62.58% |
| Of which: Total exposures assigned to obligor grades or pools of exposures | 52,388 | 47,165 | 99,553 | 77,454 | 14,09 | 40,60 | 44,931 | 58.01% |
| From AAA to AA– | 983 | 2,660 | 3,643 | 2,334 | 0,03 | 39,45 | 251 | 10.77% |
| From A+ to A– | 3,354 | 11,897 | 15,251 | 9,510 | 0,08 | 42,33 | 2,305 | 24.24% |
| From BBB+ to BBB– | 17,547 | 21,872 | 39,419 | 29,335 | 0,22 | 36,98 | 10,085 | 34.38% |
| From BB+ to BB– | 10,812 | 7,512 | 18,324 | 15,002 | 0,73 | 41,00 | 10,044 | 66.95% |
| From B+ to B– | 8,489 | 1,951 | 10,441 | 9,479 | 5,04 | 40,51 | 11,956 | 126.13% |
| C | 1,616 | 394 | 2,010 | 1,808 | 14,70 | 38,31 | 3,205 | 177.26% |
| D | 9,587 | 879 | 10,465 | 9,987 | 100,00 | 49,74 | 7,084 | 70.94% |
| Of which: Specialist finance | 10,808 | 2,341 | 13,149 | 12,190 |
|
|
11,167 | 91.61% |
| Retail | 84,850 | 11,186 | 96,037 | 86,750 | 7,15 | 20,13 | 22,957 | 26.46% |
| Of which: Secured by real estate collateral | 72,446 | 383 | 72,829 | 72,470 | 6,85 | 14,21 | 12,727 | 17.56% |
| From AAA to AA– | 26,246 | 231 | 26,477 | 26,261 | 0,03 | 11,00 | 296 | 1.13% |
| From A+ to A– | 12,570 | 46 | 12,616 | 12,573 | 0,07 | 11,86 | 298 | 2.37% |
| From BBB+ to BBB– | 12,286 | 73 | 12,359 | 12,291 | 0,23 | 15,30 | 896 | 7.29% |
| From BB+ to BB– | 9,877 | 27 | 9,903 | 9,879 | 0,83 | 16,23 | 1,874 | 18.97% |
| From B+ to B– | 4,968 | 4 | 4,972 | 4,968 | 5,68 | 19,85 | 3,503 | 70.50% |
| C | 2,393 | 2 | 2,395 | 2,393 | 18,78 | 21,02 | 2,846 | 118.92% |
| D | 4,106 | – | 4,106 | 4,106 | 100,00 | 22,97 | 3,015 | 73.43% |
| Of which: Qualifying revolving retail | 6,544 | 10,616 | 17,160 | 9,273 | 6,90 | 77,26 | 7,650 | 82.50% |
| From AAA to AA– | 271 | 1,773 | 2,044 | 794 | 0,03 | 41,94 | 9 | 1.14% |
| From A+ to A– | 96 | 344 | 440 | 199 | 0,06 | 42,70 | 5 | 2.34% |
| From BBB+ to BBB– | 367 | 1,019 | 1,386 | 542 | 0,27 | 67,85 | 58 | 10.72% |
| From BB+ to BB– | 1,711 | 3,844 | 5,555 | 2,498 | 1,01 | 79,44 | 819 | 32.80% |
| From B+ to B– | 2,998 | 3,018 | 6,016 | 3,959 | 5,00 | 84,37 | 4,205 | 106.23% |
| C | 928 | 617 | 1,545 | 1,110 | 21,88 | 81,82 | 2,444 | 220.17% |
| D | 172 | 1 | 172 | 172 | 100,00 | 85,11 | 110 | 63.97% |
| Of which: Other retail assets | 5,860 | 187 | 6,048 | 5,006 | 11,98 | 45,27 | 2,580 | 51.53% |
| From AAA to AA– | 895 | – | 896 | 895 | 0,03 | 45,73 | 45 | 5.03% |
| From A+ to A– | 214 | – | 215 | 214 | 0,07 | 59,24 | 24 | 11.42% |
| From BBB+ to BBB– | 628 | 56 | 683 | 656 | 0,22 | 57,48 | 172 | 26.21% |
| From BB+ to BB– | 1,337 | 66 | 1,404 | 417 | 0,87 | 56,17 | 238 | 56.99% |
| From B+ to B– | 2,056 | 48 | 2,104 | 2,086 | 4,85 | 33,52 | 1,574 | 75.44% |
| C | 312 | 16 | 328 | 320 | 23,54 | 51,58 | 383 | 119.92% |
| D | 417 | 1 | 419 | 418 | 100,00 | 60,98 | 144 | 34.41% |
| Equity PD/LGD Method | 7,516 | – | 7,516 | 7,516 | 0,39 | 81,34 | 9,872 | 131.36% |
| From A+ to A– | 238 | – | 238 | 238 | 0,09 | 65,00 | 166 | 69.66% |
| From BBB+ to BBB– | 6,646 | – | 6,646 | 6,646 | 0,19 | 83,28 | 8,254 | 124.19% |
| From BB+ to BB– | 299 | – | 299 | 299 | 0,83 | 69,41 | 572 | 191.60% |
| From B+ to B– | 332 | – | 332 | 332 | 4,32 | 65,00 | 880 | 264.94% |
| TOTAL BY CATEGORY AND OBLIGOR GRADE | 239,262 | 69,662 | 308,925 | 272,582 | 7,13 | 28,51 | 101,543 | 35.83% |
2012
(Millions of euros)
| Categories of exposure | Balance on balance sheet reassigned (1) | Balance off balance sheet reassigned (2) | Exposure reassigned (3) = (1+2) | EAD (4) | PD-TTC (%) |
DLGD (%) |
RWA | RW (%) |
|---|---|---|---|---|---|---|---|---|
| Central Governments and Central Banks | 1,947 | 859 | 2,805 | 2,382 | 125,04 | 40,78 | 210 | 8.82% |
| From AAA to AA– | 379 | 245 | 624 | 507 | 0,01 | 32,78 | 9 | 1.75% |
| From A+ to A– | 1,039 | 346 | 1,385 | 1,213 | 0,10 | 42,93 | 8 | 0.68% |
| From BBB+ to BBB– | 453 | 151 | 604 | 529 | 0,16 | 43,16 | 35 | 6.66% |
| From BB+ to BB– | 54 | 0 | 54 | 54 | 0,99 | 42,41 | 53 | 97.81% |
| From B+ to B– | 2 | 114 | 116 | 59 | 2,56 | 39,99 | 85 | 144.08% |
| C | 0 | 0 | 0 | 0 | 21,22 | 40,00 | 0 | 226.72% |
| D | 20 | 2 | 21 | 20 | 100,00 | 47,63 | 20 | 95.34% |
| Institutions | 71,686 | 5,882 | 77,568 | 75,187 | 0,44 | 25,97 | 14,240 | 18.94% |
| From AAA to AA– | 7,897 | 1,023 | 8,920 | 8,450 | 0,03 | 26,72 | 448 | 5.30% |
| From A+ to A– | 32,868 | 1,269 | 34,136 | 33,722 | 0,07 | 26,39 | 3,983 | 11.81% |
| From BBB+ to BBB– | 25,009 | 3,009 | 28,018 | 26,798 | 0,24 | 26,75 | 7,095 | 26.48% |
| From BB+ to BB– | 4,576 | 544 | 5,119 | 4,859 | 0,87 | 19,38 | 1,798 | 37.00% |
| From B+ to B– | 937 | 25 | 962 | 952 | 3,62 | 14,45 | 460 | 48.29% |
| C | 299 | 12 | 311 | 305 | 21,22 | 21,29 | 362 | 118.43% |
| D | 100 | 1 | 101 | 100 | 100,00 | 54,77 | 95 | 94.44% |
| Corporates | 75,084 | 56,583 | 131,668 | 106,014 | 9,91 | 41,17 | 64,188 | 60.55% |
| Of which: Total exposures assigned to obligor grades or pools of exposures | 64,074 | 53,615 | 117,690 | 93,453 | 9,91 | 41,17 | 53,831 | 57.60% |
| From AAA to AA– | 2,263 | 3,067 | 5,330 | 3,753 | 0,03 | 39,28 | 522 | 13.92% |
| From A+ to A– | 8,111 | 14,473 | 22,584 | 15,784 | 0,08 | 43,16 | 3,742 | 23.70% |
| From BBB+ to BBB– | 20,415 | 25,792 | 46,207 | 35,094 | 0,22 | 37,42 | 11,176 | 31.85% |
| From BB+ to BB– | 11,483 | 6,745 | 18,228 | 15,229 | 0,89 | 41,36 | 11,094 | 72.85% |
| From B+ to B– | 11,949 | 2,796 | 14,745 | 13,393 | 4,88 | 42,37 | 17,328 | 129.38% |
| C | 2,171 | 272 | 2,443 | 2,308 | 21,01 | 31,80 | 3,776 | 163.57% |
| D | 7,683 | 471 | 8,154 | 7,892 | 100,00 | 55,07 | 6,193 | 78.47% |
| Of which: Specialist finance | 11,010 | 2,968 | 13,978 | 12,561 |
|
|
10,357 | 82.45% |
| Retail | 83,895 | 10,159 | 94,054 | 86,653 | 5,41 | 25,41 | 25,779 | 29.73% |
| Of which: Secured by real estate collateral | 70,590 | 380 | 70,970 | 70,630 | 4,72 | 16,10 | 14,874 | 21.06% |
| From AAA to AA– | 23,364 | 180 | 23,544 | 23,382 | 0,03 | 12,41 | 295 | 1.26% |
| From A+ to A– | 15,228 | 85 | 15,312 | 15,237 | 0,08 | 13,33 | 431 | 2.83% |
| From BBB+ to BBB– | 9,991 | 59 | 10,050 | 9,997 | 0,24 | 16,19 | 778 | 7.78% |
| From BB+ to BB– | 10,637 | 38 | 10,675 | 10,641 | 0,85 | 17,65 | 2,254 | 21.18% |
| From B+ to B– | 5,571 | 16 | 5,586 | 5,572 | 4,72 | 22,12 | 4,035 | 72.41% |
| C | 3,600 | 2 | 3,603 | 3,601 | 20,41 | 25,04 | 5,172 | 143.62% |
| D | 2,201 | – | 2,201 | 2,201 | 100,00 | 36,77 | 1,909 | 86.76% |
| Of which: Qualifying revolving retail | 6,742 | 9,674 | 16,415 | 9,427 | 7,41 | 76,33 | 7,477 | 79.31% |
| From AAA to AA– | 285 | 1,724 | 2,009 | 539 | 0,03 | 46,71 | 6 | 1.13% |
| From A+ to A– | 71 | 299 | 370 | 134 | 0,08 | 47,43 | 3 | 2.53% |
| From BBB+ to BBB– | 698 | 2,087 | 2,784 | 1,159 | 0,24 | 73,12 | 149 | 12.89% |
| From BB+ to BB– | 1,854 | 2,872 | 4,727 | 2,687 | 0,96 | 76,76 | 876 | 32.59% |
| From B+ to B– | 2,613 | 2,072 | 4,685 | 3,401 | 4,99 | 80,40 | 3,500 | 102.91% |
| C | 1,002 | 618 | 1,621 | 1,287 | 21,81 | 81,44 | 2,803 | 217.76% |
| D | 219 | 1 | 220 | 219 | 100,00 | 85,41 | 139 | 63.22% |
| Of which: Other retail assets | 6,563 | 105 | 6,668 | 6,596 | 9,97 | 52,05 | 3,400 | 51.54% |
| From AAA to AA– | 883 | 20 | 903 | 886 | 0,03 | 45,60 | 43 | 4.83% |
| From A+ to A– | 353 | 7 | 360 | 357 | 0,07 | 56,49 | 40 | 11.24% |
| From BBB+ to BBB– | 741 | 16 | 757 | 747 | 0,24 | 57,18 | 199 | 26.70% |
| From BB+ to BB– | 1,424 | 36 | 1,460 | 1,433 | 0,98 | 54,42 | 780 | 54.45% |
| From B+ to B– | 2,357 | 25 | 2,381 | 2,368 | 5,11 | 48,36 | 1,765 | 74.52% |
| C | 362 | 2 | 364 | 363 | 21,41 | 52,47 | 408 | 112.37% |
| D | 442 | – | 442 | 442 | 100,00 | 64,54 | 164 | 37.15% |
| Equity PD/LGD Method | 4,798 | – | 4,798 | 4,798 | 0,46 | 80,57 | 6,216 | 129.56% |
| From A+ to A– | 713 | – | 713 | 713 | 0,09 | 65,00 | 500 | 70.04% |
| From BBB+ to BBB– | 3,483 | – | 3,483 | 3,483 | 0,15 | 84,17 | 4,015 | 115.29% |
| From BB+ to BB– | 266 | – | 266 | 266 | 0,62 | 65,00 | 489 | 183.52% |
| From B+ to B– | 335 | – | 335 | 335 | 4,32 | 88,69 | 1,212 | 362.06% |
| TOTAL BY CATEGORY AND OBLIGOR GRADE | 237,409 | 73,483 | 310,892 | 275,034 | 5,66 | 32,73 | 110,633 | 40.22% |
Chart 5. Exposure values by category
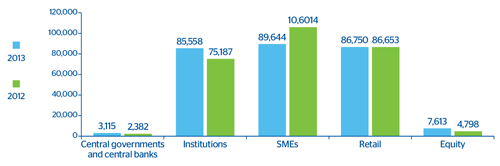
Chart 6. Average weighted PD by EAD
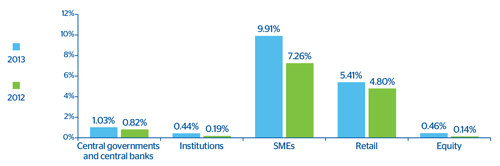
Chart 7. Average weighted DLGD by EAD
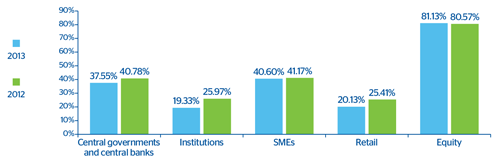
Chart 8. Average weighted RW by EAD
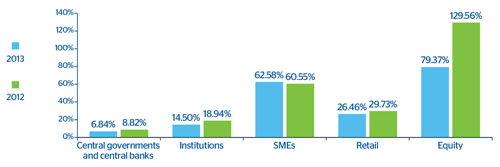
The increased exposure in the institutions segment arises from increased activity in liability repos, and is not reflected in an increase in RWAs in that segment due to the high collateralization of these operations.
In the business segment there is a reduction in exposure caused by a contraction in lending in some of the geographical areas where the Group operates and the aforementioned reclassification to the Institutions segment. In the RWAs of the business segment we can detect an increase in average RW due to the increase in PD as a result of the worsening of the economic cycle.
Exposure in the Retail segment remains stable, with a slight increase due to increased activity in LATAM subsidiaries. RWAs decrease due to the effect of the reduction in LGD in the segment of Retail customers secured by real-estate collateral and other assets.
Lastly, the increase in equity exposures is due to the reclassification of the position in CITIC and the increase in the price of equity securities in the available-for-sale portfolio.
4.5.3. Comparative analysis of the estimates made
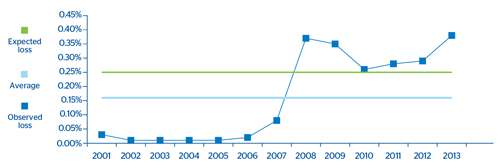
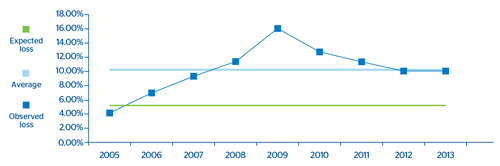
The following charts compare the expected loss adjusted to the cycle calculated according to the Group’s core internal models approved by the Bank of Spain, with the effective loss incurred between 2001 and 2013. They also present the average effective loss between 2001 and 2013 in accordance with the following:
- Estimated expected loss calculated with the internal models calibrated to 2013, and adjusted to the economic cycle (green line), i.e. the annual average expected loss in an economic cycle.
- Effective loss (light blue dotted line) calculated as the ratio of gross additions to NPA over the average observed exposure multiplied by the estimated point in time severity (1).
- Effective average loss (2001-2013), which is the average of effective losses for each year (light blue solid line).
The effective loss is the annual loss incurred. It must be less than the expected loss adjusted to the cycle in the best years of an economic cycle, and greater during years of crisis.
The comparison has been made for the portfolios of Mortgages, Consumer Finance Credit Cards and Autos (retail) and SMEs and Developers, all of them in S&P. In Mexico, the comparison has been made for the Credit Cards portfolio. In the categories of Institutions (Public and Financial Institutions) and Corporate, historical experience shows that there is such a small number of defaulted exposures (Low Default Portfolios) that it is not statistically significant, and hence the comparison is not shown.
The charts show that during the years of biggest economic growth, in general the effective loss was significantly lower than the expected loss adjusted to the cycle calculated using internal models.
The contrary was the case after the start of the crisis This is in line with the major economic slowdown and the financial difficulties of households and companies, above all in the case of companies dedicated to development and construction.
The fact that in some portfolios the average observed loss is greater than the estimated loss is coherent with the fact that the observed time window may be worse than what would be expected in a complete economic cycle. In fact, this window has fewer expansive years (6) than crisis years (7). This is not representative of a complete economic cycle.
Retail Mortgages
Starting in 2007, the effective losses are slightly above the expected loss adjusted to the cycle, as they are losses incurred in crisis years. However, the average of effective losses in this period is notably lower than that adjusted to the cycle. This demonstrates the conservative nature of the estimate.
Chart 9. Comparative analysis of the estimates made: Mortages
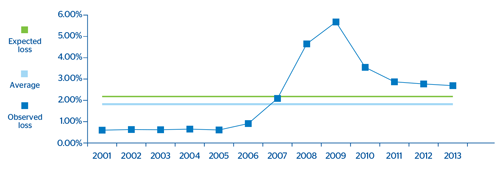
Consumer finance
The chart shows that during the years of biggest economic growth the effective loss was significantly lower than the expected loss adjusted to the cycle calculated using internal models. The contrary was the case starting in 2007. This is in line with the major economic slowdown and the financial difficulties of households.
Chart 10. Comparative analysis of the estimates made: Consumer finance
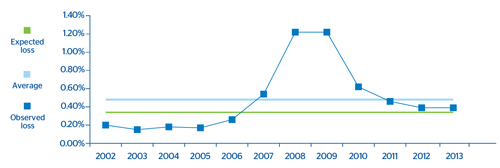
Credit cards
As in the case of Mortgages and Consumer Finance, the observed loss is lower than the Expected Loss adjusted to the cycle calculated using internal models in the good times of the cycle, and higher during its low moments.
Chart 11. Comparative analysis of the estimates made: Credit cards
Automobiles
In this case the expected loss adjusted to the cycle continues to be higher than the average effective losses for the last 13 years, which suggests the conservative nature of the estimate.
Chart 12. Comparative analysis of the estimates made: Automobiles

SMEs and Developers
Once again it can be seen that during the years of biggest economic growth the effective loss is lower than the expected loss adjusted to the cycle calculated using internal models.
The contrary was the case starting in 2007. The great difficulties faced by companies, particularly those engaged in development and construction businesses, are reflected in an observed loss higher than the loss adjusted to the cycle estimated by the internal models.
Chart 13. Comparative analysis of the estimates made: SMEs and Developers
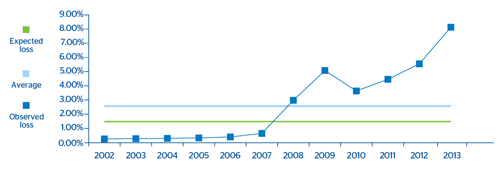
The expected loss adjusted to the cycle is lower than the average effective losses for the last 13 years, which is consistent with the fact that the observed window is worse than what would be expected in a complete economic cycle (more years of crisis than of economic boom).
Mexico Credit Cards
In the case of Bancomer’s credit cards portfolio we can see how the average Expected Loss for the cycle calculated using internal models is below the average observed losses. The reason is the use of an observation window which is unrepresentative of a complete economic cycle (the estimate would be considering comparatively more years of crisis than of economic growth).
Chart 14. Comparative analysis of the estimates made: Mexico Credit Cards
Impairment losses
The table below shows the balance of specific, generic and country risk allowances for losses, by exposure categories, as of December 31, 2013 and 2012.
Table 29. Balance of specific, generic and country risk allowances for losses, by exposure category
(Millions of euros)
|
|
Loan-loss provisions | |
|---|---|---|
| Categories of exposure | 2013 | 2012 |
| Central governments and central banks | 2 | 2 |
| Institutions | 76 | 53 |
| SMEs | 6,717 | 6,284 |
| Retail | 1,566 | 1,501 |
| Of which: Secured by real estate collateral | 676 | 445 |
| Of which: Qualifying revolving retail | 532 | 622 |
| Of which: Other retail assets | 357 | 434 |
| TOTAL | 8,362 | 7,841 |
4.5.4. Weightings of specialized lending exposures
The Solvency Circular stipulates that the consideration of specialized lending companies is to apply to those legal entities with the following characteristics:
- The exposure is to an entity created specifically to finance and/or operate physical assets.
- The contractual arrangements give the lender a substantial degree of control over the assets and income they generate.
- The primary source of repayment of the obligation is the income generated by the assets being financed, rather than the independent capacity of the borrower.
The following table presents the exposures assigned to each one of the risk weightings of the specialized lending exposures as of December 31, 2013 and 2012:
Table 30. Exposures assigned to each one of the risk weightings of specialized lending exposures
(Millions of euros)
|
|
Original exposure (1) | ||
|---|---|---|---|
| Risk weighting | Scale | 2013 | 2012 |
| 1 | 50% | 0 | 0 |
| 70% | 5,536 | 7,346 | |
| 2 | 70% | 0 | 0 |
| 90% | 5,074 | 4,660 | |
| 3 | 115% | 1,071 | 637 |
| 4 | 250% | 908 | 617 |
| 5 | 0% | 560 | 718 |
| TOTAL |
|
13,149 | 13,978 |
4.5.5. Risk weightings of equity exposures
The following table presents the exposures assigned to each one of the risk weightings of equity exposures as of December 31, 2013 and 2012.
The main variations in relation to the original exposure in the period 2012-2013 have taken place in the PD/LGD method for the reasons explained in section 4.5.2 of this report (reclassification of CITIC and increase in the price of the securities in the available-for-sale portfolio).
Table 31. Exposures assigned to each one of the risk weightings of the equity exposures
(Millions of euros)
|
|
Original exposure | |
|---|---|---|
| Risk weighting | 2013 | 2012 |
| Risk weighting, Simple Method | 830 | 947 |
| 190% | 596 | 638 |
| 290% | 140 | 194 |
| 370% | 93 | 116 |
| PD/LGD Method | 7,613 | 4,798 |
| AA | 0 | 0 |
| AA– | 0 | 0 |
| A | 238 | 706 |
| A– | 0 | 8 |
| BBB+ | 3,552 | 3,128 |
| BBB | 1,835 | 135 |
| BBB– | 1,260 | 219 |
| BB+ | 231 | 195 |
| BB | 64 | 66 |
| BB– | 3 | 6 |
| B+ | 15 | 15 |
| B | 317 | 320 |
| B– | 0 | 0 |
| C | 98 | 0 |
| Internal Models Method | 375 | 489 |
| TOTAL | 8,818 | 6,234 |