

5.2.1. Scope of application
For the purposes of calculating own funds, the scope of application of the internal model for market risk extends to BBVA S.A. and BBVA Bancomer Trading Floors.
5.2.2. Features of the models used
The basic measurement model used is value-at-risk (VaR), which provides a forecast with a 99% probability of the maximum loss that can be incurred by trading portfolios in a one-day horizon, stemming from fluctuations in equity prices, interest rates, foreign exchange rates and commodity prices. In addition, for certain positions, other risks also need to be considered, such as credit spread risk, basis risk, volatility and correlation risk. The VaR is calculated by using a historical period of 2 years of observation of the risk factors.
The Bank of Spain has authorized the use of the internal model to calculate the capital risk positions of the trading portfolios of BBVA S.A. (since 2004) and BBVA Bancomer (since 2007). Together, the two account for around 80-90% of market risk in the Group’s trading portfolio. Furthermore, and following guidelines established by Spanish and European regulators, BBVA includes additional metrics to comply with the regulatory requirements. The new market risk measures for the trading portfolio include the calculation of the stressed VaR (to quantify the risk level in extreme historical or market conditions), the quantification of non-performing risks, and of downgrade risks in the rating of some positions held in the portfolio, such as bonds and credit derivatives; they also quantify securitization and correlation portfolio charges, using the standard model.
The market-risk limits model currently in force consists of a system of VaR (Value at Risk) and economic capital limits and VaR sub-limits, as well as stop-loss limits for each of the Group’s business units. The global limits are proposed by the market risk area and approved by the Executive Committee on an annual basis, once they have been submitted to the GRMC and the Board’s Risk Committee.
This limits structure is developed by identifying specific risks by type, trading activity and trading desk. . The control structure in place is supplemented by limits on loss and a system of alert signals to anticipate the effects of adverse situations in terms of risk and/or result.
New monitoring aspects have been added to this limits structure following the new market risk metrics. Specifically, a new limit has been added for IRC and for securitizations and correlation.
Validity tests are performed periodically on the risk measurement models used by the Group. They estimate the maximum loss that could have been incurred in the positions assessed with a certain level of probability (backtesting), as well as measurements of the impact of extreme market events on risk positions (stress testing). Backtesting is performed at the trading desk level as an additional control measure in order to carry out a more specific monitoring of the validity of the measurement models.
Value at Risk (VaR) is the basic variable for managing and controlling the Group’s market risk. This risk metric estimates the maximum loss that may occur in a portfolio’s market positions for a particular time horizon and given confidence level. VaR is calculated in the Group at a 99% confidence level and a one-day time horizon.
As mentioned earlier, both BBVA S.A. and BBVA Bancomer have received approval from the Bank of Spain to use an internal model developed by the BBVA Group to calculate bank capital requirements for market risk. This model estimates the VaR in accordance with the “historical simulation” methodology, which consists of estimating the losses and gains that would have been produced in the current portfolio if the changing market conditions that occurred over a determined period of time were repeated. Based on this information, it infers the maximum foreseeable loss in the current portfolio with a given level of confidence. The model has the advantage of accurately reflecting the historical distribution of the market variables and of not requiring any specific distribution assumption. The historical period used in this model is two years.
VaR figures are estimated following two methodologies:
- VaR without smoothing, which awards equal weight to the daily information for the previous two years. This is currently the official methodology for measuring market risks vis-à-vis limits compliance.
- VaR with smoothing, which weighs more recent market information more heavily. This metric is supplementary to the one above.
VaR with smoothing adapts itself more swiftly to the changes in financial market conditions, whereas VaR without smoothing is, in general, a more stable metric that will tend to exceed VaR with smoothing when the markets show less volatile trends, but be lower when they present upturns in uncertainty.
The following tables show VaR without smoothing by risk factor for the Group:
Chart 16. Trading Book. VaR without smoothing for the Group
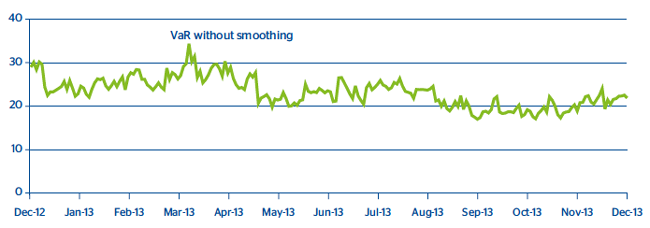
Table 37. Trading Book. VaR without smoothing by risk factors for the Group
(Millions of euros)
| VaR by risk factors | Interest-rate and spread risk | Exchangerate risk | Equity risk | Vega/correlation risk | Diversification effect (1) | Total |
|---|---|---|---|---|---|---|
| 2013 |
|
|
|
|
|
|
| Average VaR for the period |
|
|
|
|
|
23 |
| Maximum VaR for the period | 39 | 4 | 2 | 13 | (24) | 34 |
| Minimum VaR for the period | 19 | 3 | 2 | 11 | (18) | 17 |
| VaR at end of period | 22 | 4 | 3 | 11 | (18) | 22 |
| 2012 |
|
|
|
|
|
|
| Average VaR for the period |
|
|
|
|
|
22 |
| Maximum VaR for the period | 35 | 2 | 3 | 11 | (21) | 31 |
| Minimum VaR for the period | 21 | 3 | 1 | 11 | (21) | 15 |
| VaR at end of period | 35 | 3 | 3 | 9 | (19) | 30 |
| 2013 | ||||||
| Average VaR for the period | 39 | 4 | 2 | 13 | (24) | 34 |
| Maximum VaR for the period | 39 | 4 | 2 | 13 | (24) | 34 |
| Minimum VaR for the period | 19 | 3 | 2 | 11 | (18) | 17 |
| VaR at end of period | 22 | 4 | 3 | 11 | (18) | 22 |
By type of market risk on the trading book, the main risk in both BBVA, S.A. and BBVA Bancomer is interest-rate and spread risk, with a weight of 45% and 60%, respectively. Volatility and correlation has a weight of 45% in BBVA S.A. compared with 12% in BBVA Bancomer, while equity has a weight of 5% in BBVA S.A. and 16% in BBVA Bancomer, and exchange-rate risk 5% in BBVA S.A. and 12% in BBVA Bancomer.
For the purposes of calculating the capital requirements for financial instruments held for trading, the Group has since 2011 incorporated the new Basel 2.5 requirements, which has had an impact in terms of an increase in capital charges.
Specifically, these charges include:
- VaR: In regulatory terms, the charge for VaR Stress is added to the charge for VaR and the sum of both (VaR and VaR Stress) is calculated. This quantifies the loss associated with movements in the risk factors inherent in market operations (interest rate, FX, RV, credit, etc.). Both charges are rescaled by a regulatory multiplier set at three and by the square root of ten.
- Specific Risk: IRC. The specific risk capital for IRC (loss associated with potential events of migration and default in the bond portfolio and credit derivatives) is a charge used exclusively for geographical areas with an approved internal model (BBVA S.A. and Bancomer). The capital charge is determined based on the associated losses (at 99.9% over a time horizon of 1 year under the assumption of constant risk) resulting from the rating migration and/or default status of the asset’s issuer. Also included is the price risk in sovereign positions for the indicated items.
- Specific Risk: Securitizations and Correlation Portfolios. Capital for the securitizations and the correlation portfolio for potential losses associated with the rating level of a given credit structure (rating). Both are calculated using the standardized approach. The perimeter of the correlation portfolios is referred to FTD-type market operations and/or market CDO tranches, and only for positions with an active market and hedging capacity.
Table 38. Trading Book. Market risk. Regulatory capital
2013
(Millions of euros)
|
|
Regulatory capital | ||
|---|---|---|---|
| Type of risk | Item | GM Europe, NY and Asia | GM Bancomer |
| Market Risk BIS II | VaR/CeR | 84.4 | 78.6 |
| Market Risk BIS II.5 | VaR Stress | 105.6 | 154.2 |
|
|
IRC | 97.4 | 95.4 |
|
|
Securitizations | 4.5 | 1.9 |
|
|
Correlation | 12 | 0 |
| Total Market Risk |
|
303.9 | 330.11 |
Stress testing
All the tasks associated with stress, methodologies, scenarios of market variables or reports are undertaken in coordination with the Group’s Risk Areas.
Different stress test exercises are performed on the BBVA Group’s trading portfolios. Both local and global historical scenarios are used, which replicate the behavior of a past extreme event, for example, the collapse of Lehman Brothers or the Tequila crisis. These stress exercises are supplemented with simulated scenarios which aim to generate scenarios that have a significant impact on the different portfolios, but without being restricted to a specific historical scenario. Lastly, for certain portfolios or positions, fixed stress test exercises are also prepared that have a significant impact on the market variables that affect those positions.
Historical scenarios
The base historical stress scenario in the BBVA Group is that of Lehman Brothers, whose sudden collapse in September 2008 had a significant impact on the behavior of financial markets at a global level. The most relevant effects of this historical scenario include:
1. Credit shock: reflected mainly in the increase in credit spreads and downgrades of credit ratings.
2. Increased volatility in most financial markets (giving rise to much variation in the prices of the different assets (currencies, equity, debt).
3. Liquidity shock in the financial systems, reflected in major fluctuations in interbank curves, particularly in the shortest sections of the euro and dollar curves.
Table 39. Trading Book. Impact on earnings in Lehman scenario
(Miles de euros)
| 1-day loss | 2013 | 2012 |
|---|---|---|
| GM Europe, NY and Asia | –22.7 | –9 |
| GM Bancomer | –67.3 | –82 |
| GM Argentina | –5.3 | –1 |
| GM Chile | –5.9 | –8 |
| GM Colombia | –1.7 | –2 |
| GM Peru | –7.3 | –8 |
| GM Venezuela | –2.9 | –4 |
Simulated scenarios
Unlike the historical scenarios, which are fixed and, thus, do not adapt to the composition of portfolio risks at any given time, the scenario used to perform the economic stress exercises is based on the Resampling method. This methodology is based on the use of dynamic scenarios that are recalculated on a regular basis according to what the main risks in the trading portfolios are. A simulation exercise is carried out in a data window wide enough to include different stress periods (data is taken from 1-1-2008 until today) by the re-sampling of historical observations. This generates a distribution of gains and losses that allows an analysis of the most extreme events in the selected historical window. The advantage of this methodology is that the stress period is not pre-established, but rather a function of the portfolio held at any given time; and the large number of simulations (10,000) means that the expected shortfall analysis can include richer information than that available in scenarios included in the VaR calculation.
The main features of this methodology are as follows:
a. The simulations generated follow the data correlation structure.
b. It provides flexibility in terms of including new risk factors.
c. It enables a great deal of variability to be introduced (which is desirable for considering extreme events).
Table 40. Trading Book. Stress resampling
(Millions of euros)
|
|
Stress VaR 95 20 D |
Expected shortfall 95 20 D |
Stress period | Stress VaR 1D 99% Resampling |
|---|---|---|---|---|
| TOTAL | –73.1 | –96.1 | 02/01/2008 - 07/10/2010 | –35.0 |
| GM Europa. NY and Asia | –34.1 | –43.6 | 02/01/2008 - 02/12/2009 | –17.8 |
| GM Bancomer | –39.0 | –52.5 | 09/10/2008 - 07/10/2010 | –17.2 |
Backtesting
The Group’s market risk measurement model needs to have a backtesting or self-validation program that assures that the risk measurements being made are appropriate.
The internal market risk model is validated on a regular basis by backtesting in both BBVA S.A. and Bancomer.
The purpose of backtesting is to validate the quality and accuracy of the internal model used by the BBVA Group to estimate the maximum daily loss for a portfolio, for a 99% confidence level and a time horizon of 250 days, by comparing the Group’s results and the risk measures generated by the model. These tests confirmed that the internal market risk model used by BBVA S.A. and Bancomer is adequate and accurate.
Two types of backtesting were performed in 2013:
1. “Hypothetical” backtesting: the daily VaR is compared with the results obtained without taking into account the intraday results or the changes in the portfolio’s positions. This validates that the market risk metric is appropriate for the end-of-day position.
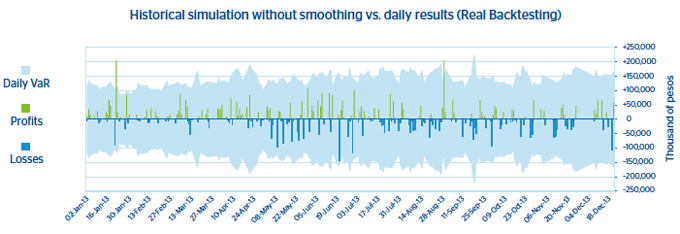
2. “Real” backtesting: the daily VaR is compared with the total results, including intraday operations, but deducting any possible allowances or commissions generated. This type of backtesting incorporates the intraday risk in the portfolios.
In addition, each of these two types of backtesting was performed at risk factor or type of business level, thus providing a more in-depth comparison of results versus risk measures.
Backtesting of the internal model for calculating VaR (Value at Risk) was performed in 2013, comparing the daily results obtained with the daily risk level estimated by the VaR calculation model. At the end of the year, the comparison showed that the model worked properly and remained within the “green” area (0-4 exceptions), and the model was thus considered acceptable, as has been the case every year since the internal model for market risk was approved in the Group.
Backtesting in the case of BBVA, S.A. revealed no exceptions in 2013. Credit spreads for Spanish sovereign and corporate debt have continued to narrow over the year and equity markets have generally shown an upward trend. To sum up, backtesting performed in BBVA, S.A. in 2013, at both aggregate and risk factor level, detected no anomalies in the VaR calculation model.
In the case of Bancomer, portfolio losses were only greater than the daily VaR on one occasion, thus validating the correct operation of the model, in line with the Basel criteria.
Chart 17. Trading Book. Validation of the Market Risk Measurement model for BBVA, S.A.
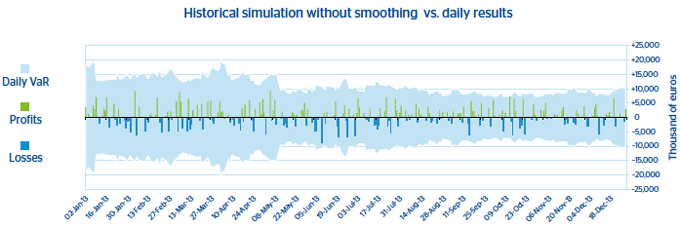
Chart 17. Trading Book. Validation of the Market Risk Measurement model for BBVA, S.A.
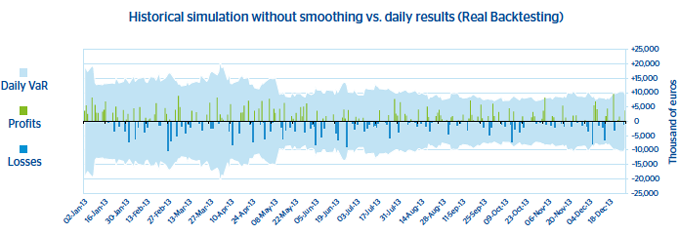
Chart 18. Trading Book. Validation of the Market Risk Measurement model for BBVA Bancomer
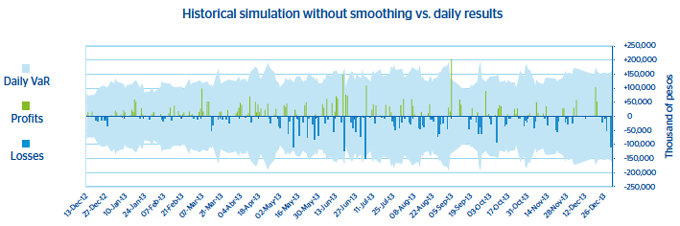
Chart 18. Trading Book. Validation of the Market Risk Measurement model for BBVA Bancomer
5.2.3. Characteristics of the risk management system
The Group has a risk management system that is appropriate for the volume of risks managed, in compliance with the conditions laid out in Rule Ninety-three:
- Integration of the daily risk calculations into the Group’s risk management.
- A Risk unit that is independent of the business units.
- Active participation of management bodies in the risk control process.
- Sufficient human resources to employ the model.
- Existence of written procedures that assure the global precision of the internal model used for calculating VaR.
- Accreditation of the degree of accuracy of the internal model used for calculated VaR.
- Existence of a stress program.
- Periodic internal audits performed on the risk measurement system.
The Group employs a backtesting program that ensures that the risk measurements carried out are appropriate.
The Group uses internal validation procedures for the model that are independent of the model development process.
VaR is calculated at a 99% confidence level and a 1-day time horizon. In order to extrapolate to the regulatory 10-day horizon, the figures are multiplied by the square root of 10. A historical period of 2 years is used for risk factor observation.
The market risks model has a sufficiently large number of risk factors, according to the business volume in the various financial markets.