Non Core Real Estate
Highlights
- Continued positive trend in the Spanish real-estate market, although with a more moderate growth rate.
- Minimum levels of the net real-estate exposure.
- Closing of the sale agreement of the participation in Testa.
- Significant reduction in net losses in the area.
Industry trends
The Spanish real estate market continues to show a growth trend, somewhat more moderated. The macroeconomic context continues to be favorable for residential demand: interest rates remain at minimum levels and the economy is still generating jobs. However, the uncertainty regarding economic policy could affect the decision of households and entrepreneurs of the sector.
- Investment in housing accelerated its growth in the third quarter of 2018, after the slowdown registered in the previous quarter. According to data from the National Quarterly Accounting Office of the INE investment in housing grew by 1.6% between July and September, an evolution that, once again, exceeded the economy as a whole.
- Between January and November, 526,840 homes were sold in Spain, a year-on-year increase of 8.5%, according to information from the General Council of Spanish Notaries (CIEN).
- Housing prices accelerated in the third quarter of 2018 to 7.2% in year-on-year terms (INE figures), exceeding the figures registered in the two previous quarters.
- The interest rate applied to new loan operations remains at 2.3% and the cost of mortgage financing remains at relatively low levels. As a result, new home loans grew by 17.1% in the first eleven months of the year.
- Finally, the evolution of the construction activity continued to be robust, in response to the increase in residential demand. According to data from the Ministry of Public Works, nearly 84,000 new housing construction permits were approved in the first ten months of the year 2018, 23.2% more than in the same period of 2017.
Activity
The net real-estate exposure amounted to €2,498m as of 31-December-2018, which means a very significant reduction in year-on-year terms (-61.1%).
With regards to the loans to developers, in the last three months of 2018 outstanding performing loans to developers for an amount of €60m were transferred from Non Core Real Estate to Banking Activity in Spain, that together with the transfer already made during the first half of 2018 stood at €260m in the year. In addition, the agreement with the Canada Pension Plan Investment Board (CPPIB) for the sale of non-performing and written-off loans to developers for a gross amount of approximately €1 billion was closed in July.
Having received the regulatory authorizations, BBVA closed on October 10, 2018 the operation of the transfer of its real-estate business in Spain to Cerberus Capital Management, L.P. (Cerberus). The closing of this operation implies the sale of 80% of the share capital of Divarian, the joint venture to which the real-estate business had been transferred, however the effective transfer of some real estate owned assets (“REOs”) is subject to the fulfillment of certain conditions and in the meanwhile, BBVA will continue to manage those assets. As of December 31, 43,900 assets with a value 2,828 million euros would have been transferred to Divarian. 17,485 assets with a value of approximately €900m are pending transfer, subject to specific authorizations in process of obtaining them.
As of December 31, 2018 the participation in Divarian which BBVA maintains at 20%, is recorded in Corporate Center.
In addition, on December 21, 2018 BBVA reached an agreement with Blackstone for the sale of its participation of its 25.24% stake in Testa for €478m.
Evolution of Net exposure to real estate
(Millions of Euros)
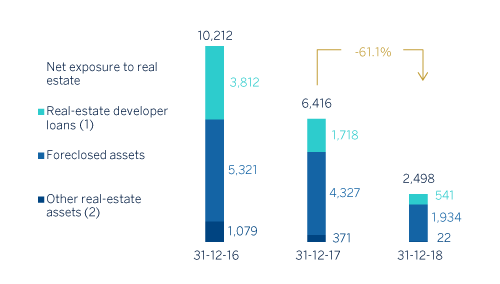
- (1) Compared to Bank of Spain's Transparency scope (Circular 5/2011 dated November 30), real-estate developer loans do not include €2.1Bn (December 2018) mainly related performing loans to developers transferred to the Banking Activity in Spain area.
- (2) Other real-estate assets not originated from foreclosures.
Coverage of real-estate exposure (Millions of Euros as of 31-12-2018)
| Gross Value | Provisions | Net exposure | % Coverage | |
|---|---|---|---|---|
| Real-estate developer loans (1) | 1,006 | 465 | 541 | 46% |
| Performing | 174 | 23 | 150 | 13% |
| Finished properties | 145 | 18 | 127 | 13% |
| Construction in progress | 14 | 3 | 11 | 23% |
| Land | 14 | 1 | 13 | 8% |
| Without collateral and other | 1 | - | - | 46% |
| NPL | 832 | 442 | 390 | 53% |
| Finished properties | 361 | 160 | 201 | 44% |
| Construction in progress | 23 | 11 | 13 | 45% |
| Land | 392 | 237 | 156 | 60% |
| Without collateral and other | 55 | 35 | 21 | 62% |
| Foreclosed assets | 4,310 | 2,376 | 1,934 | 55% |
| Finished properties | 3,037 | 1,501 | 1,536 | 49% |
| Construction in progress | 209 | 131 | 78 | 63% |
| Land | 1,064 | 744 | 320 | 70% |
| Other real-estate assets (2) | 25 | 3 | 22 | 11% |
| Real-estate exposure | 5,341 | 2,843 | 2,498 | 53% |
- (1) Compared to Bank of Spain's Transparency scope (Circular 5/2011 dated November 30), real-estate developer loans do not include €2.1 Bn (December 2018) mainly related performing loans to developers transferred to the Banking activity in Spain area.
- (2) Other real-estate assets not originated from foreclosures.
Total real-estate exposure, including loans to developers, foreclosures and other assets, had a coverage ratio of 53% at the close of December 2018. The coverage ratio of foreclosed assets stood at 55%.
Non-performing loan balances showed a downward trend along the year, thanks to lower NPL entries and the recovery of activity over the quarter. The NPL coverage ratio was maintained at 53%.
Results
At the close of December 2018 this business area posted a cumulative loss in 2018 of €78m, which represents a positive evolution compared to a loss of €490m in the same period the previous year.
Financial statements (Millions of Euros)
| IFRS 9 | IAS 39 | |||||
|---|---|---|---|---|---|---|
| Income statement | 2018 | ∆% | 2017 | |||
| Net interest income | 32 | (55.8) | 71 | |||
| Net fees and commissions | 1 | (56.7) | 3 | |||
| Net trading income | 64 | n.s. | 0 | |||
| Other operating income and expenses | (59) | (35.7) | (91) | |||
| Gross income | 38 | n.s. | (17) | |||
| Operating expenses | (65) | (33.9) | (99) | |||
| Personnel expenses | (39) | (23.3) | (51) | |||
| Other administrative expenses | (22) | (28.1) | (30) | |||
| Depreciation | (5) | (73.3) | (18) | |||
| Operating income | (28) | (76.1) | (116) | |||
| Impairment on financial assets not measured at fair value through profit or loss | (12) | (91.0) | (138) | |||
| Provisions or reversal of provisions and other results | (89) | (77.8) | (403) | |||
| Profit/(loss) before tax | (129) | (80.3) | (656) | |||
| Income tax | 52 | (68.8) | 166 | |||
| Profit/(loss) for the year | (78) | (84.2) | (491) | |||
| Non-controlling interests | (0) | n.s. | 1 | |||
| Net attributable profit | (78) | (84.2) | (490) | |||
| IFRS 9 | IAS 39 | |||||
|---|---|---|---|---|---|---|
| Balance sheet | 31-12-18 | ∆% | 31-12-17 | |||
| Cash, cash balances at central banks and other demand deposits | 14 | 19.8 | 12 | |||
| Financial assets designated at fair value | 1,358 | n.s. | 9 | |||
| of which loans and advances | 1,368 | n.s. | - | |||
| Financial assets at amortized cost | 582 | (83.5) | 3,521 | |||
| of which loans and advances | 582 | (83.5) | 3,521 | |||
| Inter-area positions | - | - | - | |||
| Tangible assets | 30 | n.s. | 0 | |||
| Other assets | 2,179 | (64.7) | 6,172 | |||
| Total assets/liabilities and equity | 4,163 | (57.1) | 9,714 | |||
| Financial liabilities held for trading and designated at fair value through profit or loss | - | - | - | |||
| Deposits from central banks and credit institutions | 36 | n.s. | 0 | |||
| Deposits from customers | 36 | 187.5 | 13 | |||
| Debt certificates | 239 | (69.6) | 785 | |||
| Inter-area positions | 2,691 | (53.4) | 5,775 | |||
| Other liabilities | 205 | n.s. | - | |||
| Economic capital allocated | 956 | (69.6) | 3,141 | |||
| Memorandum item: | ||||||
| Risk-weighted assets | 3,022 | (68.8) | 9,692 | |||