South America
Highlights
- Activity affected by the sale of BBVA Chile.
- In other countries, the activity evolves at a good pace.
- Argentina hyperinflation adjustment impacts in every item of the income statement.
Business activity (1)
(Year-on-year change at constant exchange rates. Data as of 31-12-2018)
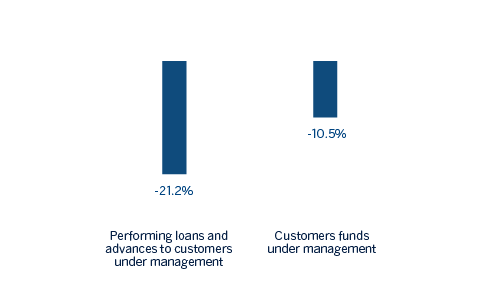
(1) Excluding repos.
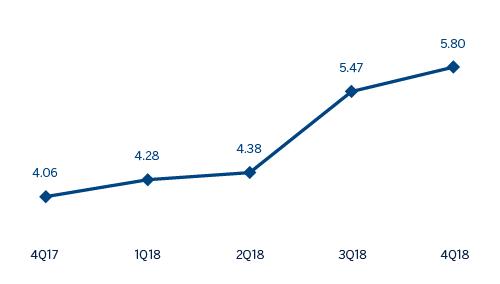
Net interest income/ATAs
(Percentage. Constant exchange rates)
Operating income
(Millions of Euros at constant exchange rates)
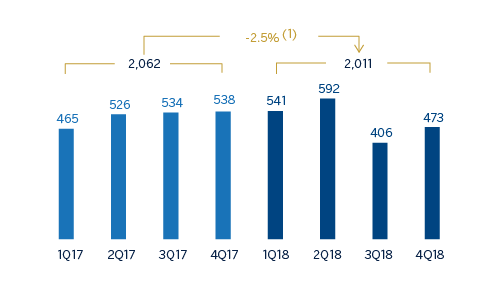
(1)At current exchange rates: -17.7%.
Net attributable profit
(Millions of Euros at constant exchange rates)
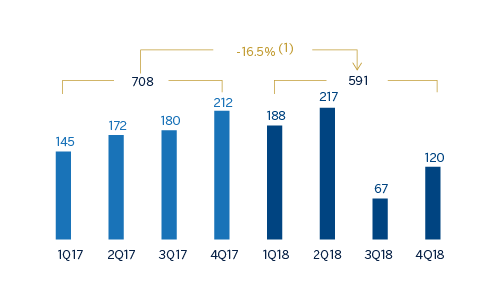
(1) At current exchange rates: -31.3%.
Breakdown of performing loans under management (1)
(31-12-2018)
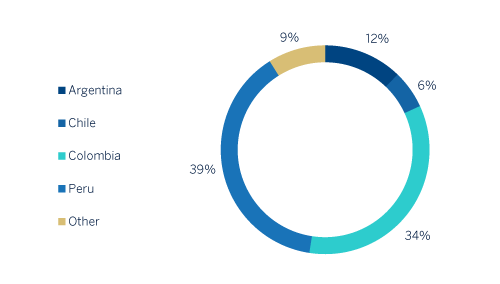
(1) Excluding repos.
Breakdown of customer funds under management (1)
(31-12-2018)
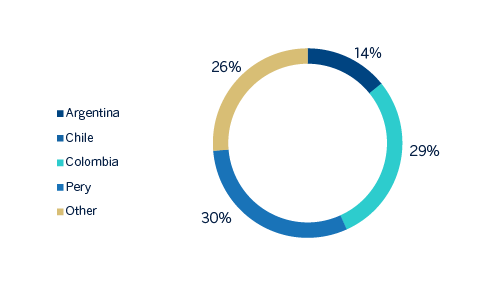
(1) Excluding repos.
Financial statements and relevant business indicators (Millions of Euros and percentage)
| IFRS 9 | IAS 39 | |||||
|---|---|---|---|---|---|---|
| Income statement | 2018 | ∆% | ∆% (1) | 2017 | ||
| Net interest income | 3,009 | (6.0) | 12.8 | 3,200 | ||
| Net fees and commissions | 631 | (11.4) | 10.9 | 713 | ||
| Net trading income | 405 | (15.7) | 5.2 | 480 | ||
| Other operating income and expenses | (344) | n.s. | n.s. | 59 | ||
| Gross income | 3,701 | (16.9) | 1.9 | 4,451 | ||
| Operating expenses | (1,690) | (15.8) | 7.7 | (2,008) | ||
| Personnel expenses | (846) | (18.3) | 5.9 | (1,035) | ||
| Other administrative expenses | (719) | (15.5) | 7.4 | (851) | ||
| Depreciation | (125) | 3.2 | 24.7 | (121) | ||
| Operating income | 2,011 | (17.7) | (2.5) | 2,444 | ||
| Impairment on financial assets not measured at fair value through profit or loss | (638) | (1.9) | 5.2 | (650) | ||
| Provisions or reversal of provisions and other results | (65) | (36.3) | (15.5) | (103) | ||
| Profit/(loss) before tax | 1,307 | (22.7) | (5.1) | 1,691 | ||
| Income tax | (475) | (2.2) | 23.9 | (486) | ||
| Profit/(loss) for the year | 833 | (30.9) | (16.3) | 1,205 | ||
| Non-controlling interests | (241) | (29.9) | (15.9) | (345) | ||
| Net attributable profit | 591 | (31.3) | (16.5) | 861 | ||
| IFRS 9 | IAS 39 | |||||
|---|---|---|---|---|---|---|
| Balance sheets | 31-12-18 | ∆% | ∆%(1) | 31-12-17 | ||
| Cash, cash balances at central banks and other demand deposits | 8,987 | (0.6) | 11.0 | 9,039 | ||
| Financial assets designated at fair value | 5,634 | (51.5) | (47.0) | 11,627 | ||
| of which loans and advances | 129 | n.s. | n.s. | 3 | ||
| Financial assets at amortized cost | 36,649 | (28.4) | (21.3) | 51,207 | ||
| of which loans and advances to customers | 34,469 | (28.6) | (21.6) | 48,272 | ||
| Tangible assets | 813 | 12.1 | 33.3 | 725 | ||
| Other assets | 302 | (85.2) | (83.9) | 2,038 | ||
| Total assets/liabilities and equity | 52,385 | (29.8) | (22.7) | 74,636 | ||
| Financial liabilities held for trading and designated at fair value through profit or loss | 1,357 | (51.9) | (48.4) | 2,823 | ||
| Deposits from central banks and credit institutions | 3,076 | (59.3) | (57.9) | 7,552 | ||
| Deposits from customers | 35,842 | (21.5) | (13.0) | 45,666 | ||
| Debt certificates | 3,206 | (55.5) | (53.0) | 7,209 | ||
| Other liabilities | 6,551 | (23.0) | (10.4) | 8,505 | ||
| Economic capital allocated | 2,355 | (18.3) | (7.5) | 2,881 | ||
| Relevant business indicators | 31-12-18 | ∆% | ∆%(1) | 31-12-17 |
|---|---|---|---|---|
| Performing loans and advances to customers under management (2) | 34,518 | (28.2) | (21.2) | 48,068 |
| Non-performing loans | 1,747 | (7.3) | (3.2) | 1,884 |
| Customer deposits under management (3) | 35,984 | (21.7) | (13.2) | 45,970 |
| Off-balance sheet funds (4) | 11,662 | (4.4) | (1.1) | 12,197 |
| Risk-weighted assets | 42,736 | (23.7) | (14.4) | 55,975 |
| Efficiency ratio (%) | 45.7 | - | - | 45.1 |
| NPL ratio (%) | 4.3 | - | - | 3.4 |
| NPL coverage ratio (%) | 97 | - | - | 89 |
| Cost of risk (%) | 1.44 | - | - | 1.32 |
- (1) Figures at constant exchange rates.
- (2) Excluding repos.
- (3) Excluding repos and including specific marketable debt securities.
- (4) Includes mutual funds, pension funds and other off-balance sheet funds.
South America. Data per country (Millions of Euros)
| IFRS 9 | IAS 39 | IFRS 9 | IAS 39 | |||||
|---|---|---|---|---|---|---|---|---|
| Operating income | Net attributable profit | |||||||
| Country | 2018 | ∆% | ∆% (1) | 2017 | 2018 | ∆% | ∆% (1) | 2017 |
| Argentina | 179 | (65.7) | (20.6) | 522 | (29) | n.s. | n.s. | 219 |
| Chile | 289 | (31.2) | (28.9) | 421 | 137 | (27.1) | (24.7) | 188 |
| Colombia | 645 | 0.3 | 4.8 | 644 | 229 | 11.6 | 16.6 | 206 |
| Peru | 736 | 1.3 | 6.7 | 726 | 195 | 8.4 | 14.3 | 180 |
| Other countries (2) | 161 | 23.0 | 29.7 | 131 | 59 | (13.6) | (8.2) | 68 |
| Total | 2,011 | (17.7) | (2.5) | 2,444 | 591 | (31.3) | (16.5) | 861 |
- (1) Figures at constant exchange rates.
- (2) Venezuela, Paraguay, Uruguay and Bolivia. Additionally, it includes eliminations and other charges.
South America. Relevant business indicators per country (Millions of Euros)
| Argentina | Chile | Colombia | Peru | |||||
|---|---|---|---|---|---|---|---|---|
| 31-12-18 | 31-12-17 | 31-12-18 | 31-12-17 | 31-12-18 | 31-12-17 | 31-12-18 | 31-12-17 | |
| Performing loans and advances to customers under management (1)(2) | 4,221 | 2,982 | 2,045 | 13,542 | 11,835 | 11,385 | 13,351 | 13,021 |
| Non-performing loans and guarantees given (1) | 87 | 24 | 58 | 390 | 768 | 643 | 709 | 648 |
| Customer deposits under management (1)(3) | 5,986 | 3,531 | 10 | 8,975 | 12,543 | 11,702 | 12,843 | 12,263 |
| Off-balance sheet funds (1)(4) | 783 | 654 | - | 1,201 | 1,287 | 1,070 | 1,666 | 1,589 |
| Risk-weighted assets | 8,036 | 9,364 | 2,243 | 14,398 | 12,672 | 12,299 | 15,760 | 14,879 |
| Efficiency ratio (%) | 73.0 | 56.1 | 42.1 | 45.2 | 36.3 | 36.0 | 35.4 | 35.6 |
| NPL ratio (%) | 2.0 | 0.8 | 2.8 | 2.6 | 6.0 | 5.3 | 4.0 | 3.8 |
| NPL coverage ratio (%) | 111 | 198 | 93 | 60 | 100 | 88 | 93 | 100 |
| Cost of risk (%) | 1.60 | 0.61 | 0.81 | 0.76 | 2.16 | 2.59 | 0.98 | 1.14 |
- (1) Figures at constant exchange rates.
- (2) Excluding repos.
- (3) Excluding repos and including specific marketable debt securities.
- (4) Includes mutual funds, pension funds and other off-balance-sheet funds.
Macro and industry trends
The activity of the South American economies has exhibited, in general, a positive performance in the third quarter of 2018, mainly in the Andean countries, supported by a relatively expansive monetary policy. In contrast, economic activity in Argentina contracted once again, although significantly less than in the second quarter, in an environment in which stabilization signs are beginning to appear after the financial tensions that were previously present, and in which restrictive economic policies continue to be maintained. In the rest of the countries in the region, consumption continues to recover, supported by relatively low levels of inflation, and also investment, driven by the increase in domestic demand and the recovery of confidence.
Inflation in the region remains generally under control, at levels close to the objectives of the respective central banks. In this sense, an end to the lax monetary policy phase could be coming, and gradual increases in interest rates by the monetary authorities could begin in the coming months. As with the case of economic activity, the situation in Argentina contrasts with that of the other countries in the region. Despite recent signs of moderation, inflation remains high, in a context in which the restrictive tone of monetary policy is implemented through the nominal stability of monetary aggregates.
Regarding the banking systems within BBVA's regional footprint, the macroeconomic backdrop and low levels of banking penetration in these countries in aggregate terms (obviously with differences between countries) led to strong results in the main indicators of profitability and solvency, while non-performing loans remained under control. In addition, there has been sustained growth in lending and deposits.
Activity
On 6-July-2018, after obtaining all required authorizations, BBVA completed the sale to The Bank of Nova Scotia of its direct and indirect stake in Banco Bilbao Vizcaya Argentaria, Chile (BBVA Chile) as well as in other companies of its group in Chile whose operations are complementary to the banking business (particularly, BBVA Seguros Vida, S.A.). The impacts of this transaction were reflected in the financial statements of the BBVA Group for the third quarter of 2018. In addition, as it was announced to the market through relevant event on December 19, 2018 BBVA has decided to initiate a strategic review of alternatives for its automobile financing business in Chile mainly carried out by the company Forum Servicios Financieros, S.A. (“Forum”). Despite Forum being a highly attractive business, BBVA´s sale of its banking business in Chile, advises the initiation of this review process.
Unless expressly stated otherwise, all the comments below on rates of change, for both activity and earnings, will be provided at constant exchange rates, and will be impacted by the divestment in BBVA Chile. These rates, together with changes at current exchange rates, can be found in the attached tables of financial statements and relevant business indicators.
The most relevant aspects related to the area’s activity in 2018 were:
- Lending (performing loans under management) in South America was 21.2% below the same period the previous year. Excluding BBVA Chile from the comparison, loans to customers grew by 8.6% since 31-12-2017. By country, the most significant increase was in Argentina (up 41.6% year-on-year) together with the improvement in lending in Colombia and Peru. By portfolios, excluding BBVA Chile from the comparison, performance was especially positive in the mortgage, consumer and business banking segments.
- Regarding asset quality of the portfolio, the NPL ratio, as of 31-December-2018 stood at 4.3%, in line with the previous quarter, while the NPL coverage ratio decreased to 97% (101% as of 30-September-2018).
- Customer funds decreased by 13.2%, although on a comparable basis, i.e. excluding BBVA Chile from the comparison, they grew by 10.7%. Off-balance-sheet funds, on a comparable basis, increased by 10.1% year-on-year. By country there was a positive trend in Argentina, Colombia and to a lesser extent in Peru, with a total customer funds increase of +61.8, +8.3 and +4.7%, respectively.
Results
South America generated a net attributable profit of €591m, which represents year-on-year variation of -16.5% (-31.3% at current exchange rates). This evolution is affected by the negative impact of accounting for hyperinflation in Argentina in the net attributable profit of the area (€-266m) as well as by the change in the perimeter originated from the sale of BBVA Chile. Excluding these two impacts, the most recurrent income (net interest income and commissions) and NTI increased by 11.7% in year-on-year terms, which offsets the increase of the impairment losses on financial assets (up 5.2% compared to the close of 2017). As a result, the cumulative cost of risk at the close of December stood at 1.44%.
By country, the trends in 2018 were as follows:
- In Argentina, there was year-on-year growth in gross income of 29.2%. This increase was based both on the performance of recurring revenue (boosted by higher volumes of business) and the positive performance of NTI (mainly due to exchange rates). The aforementioned in combination with the increase in impairment losses on financial assets and the negative effect of hyperinflation adjustment posted a net attributable profit of -€29m.
- In Colombia, the increase in earnings was based on the good performance of net interest income (due to a positive performance in activity and customer spreads) and higher net fees and commissions, which boosted gross income (up 5.3%). The aforementioned, together with the reduction of impairment losses on financial assets, this led to a year-on-year increase of 16.6% in the net attributable profit.
- In Peru, net attributable profit increased by 14.3% year-on-year, leveraged by the good performance of net interest income (increase in lending), higher net fees and commissions and a good performance of the impairment losses on financial assets.