The United States
Highlights
- Lending growth supported by business financing and retail segments.
- Good performance of net interest income and provisions.
- Improvement in efficiency.
- Net attributable profit positively affected by the tax reform at the end of 2017.
Business activity (1)
(Year-on-year change at constant exchange rate. Data as of 31-12-2018)
(1) Excluding repos.
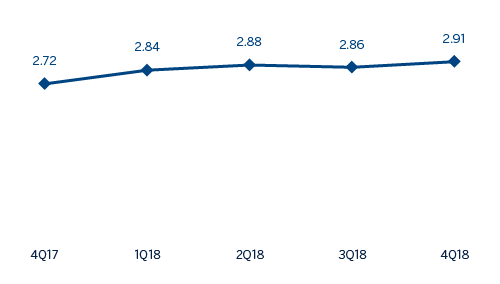
Net interest income/ATAs
(Percentage. Constant exchange rate)
Operating income
(Millions of Euros at constant exchange rate)
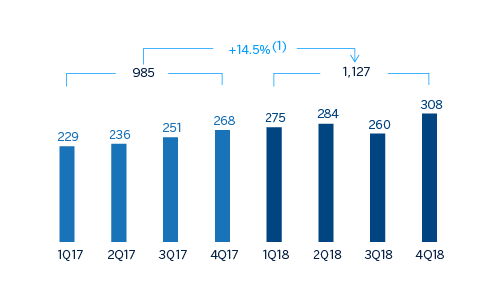
(1) At current exchange rate: +10.0%.
Net attributable profit
(Millions of Euros at constant exchange rate)
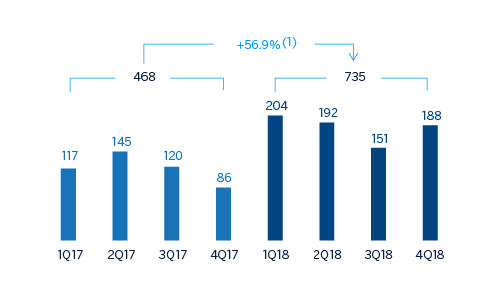
(1) At current exchange rate: +51.3%.
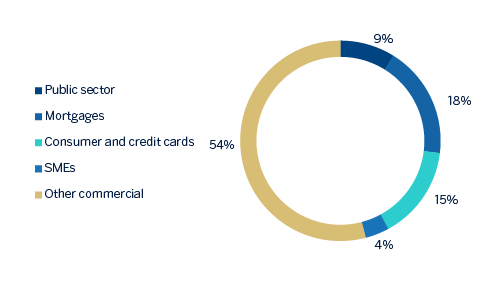
Breakdown of performing loans under management (1)
(31-12-2018)
Breakdown of customer funds under management (1)
(31-12-2018)

(1) Excluding repos.
(1) Excluding repos.
Financial statements and relevant business indicators (Millions of Euros and percentage)
| IFRS 9 | IAS 39 | ||||
|---|---|---|---|---|---|
| Income statement | 2018 | ∆% | ∆%(1) | 2017 | |
| Net interest income | 2,276 | 7.4 | 12.1 | 2,119 | |
| Net fees and commissions | 596 | (7.5) | (3.8) | 644 | |
| Net trading income | 109 | (1.9) | 0.9 | 111 | |
| Other operating income and expenses | 9 | n.s. | 256.4 | 2 | |
| Gross income | 2,989 | 3.9 | 8.3 | 2,876 | |
| Operating expenses | (1,862) | 0.6 | 4.9 | (1,851) | |
| Personnel expenses | (1,051) | (1.6) | 2.7 | (1,067) | |
| Other administrative expenses | (633) | 6.0 | 10.5 | (598) | |
| Depreciation | (178) | (4.6) | (0.4) | (187) | |
| Operating income | 1,127 | 10.0 | 14.5 | 1,025 | |
| Impairment on financial assets not measured at fair value through profit or loss | (225) | (6.8) | (2.6) | (241) | |
| Provisions or reversal of provisions and other results | 16 | n.s. | n.s. | (36) | |
| Profit/(loss) before tax | 919 | 22.9 | 27.6 | 748 | |
| Income tax | (184) | (29.8) | (26.9) | (262) | |
| Profit/(loss) for the year | 735 | 51.3 | 56.9 | 486 | |
| Non-controlling interests | - | - | - | - | |
| Net attributable profit | 735 | 51.3 | 56.9 | 486 | |
| IFRS 9 | IAS 39 | ||||
|---|---|---|---|---|---|
| Balance sheets | 31-12-18 | ∆% | ∆%(1) | 31-12-17 | |
| Cash, cash balances at central banks and other demand deposits | 4,835 | (32.3) | (35.3) | 7,138 | |
| Financial assets designated at fair value | 10,481 | (5.3) | (9.6) | 11,068 | |
| of which loans and advances | 156 | 179.2 | n.s. | 56 | |
| Financial assets at amortized cost | 63,539 | 16.1 | 10.9 | 54,705 | |
| of which loans and advances to customers | 60,808 | 13.2 | 8.1 | 53,718 | |
| Inter-area positions | - | - | - | - | |
| Tangible assets | 668 | 1.5 | (3.1) | 658 | |
| Other assets | 2,534 | 14.8 | 9.6 | 2,207 | |
| Total assets/liabilities and equity | 82,057 | 8.3 | 3.4 | 75,775 | |
| Financial liabilities held for trading and designated at fair value through profit or loss | 234 | 68.2 | 60.6 | 139 | |
| Deposits from central banks and credit institutions | 3,370 | (5.9) | (10.1) | 3,580 | |
| Deposits from customers | 63,891 | 5.1 | 0.3 | 60,806 | |
| Debt certificates | 3,599 | 78.4 | 70.3 | 2,017 | |
| Inter-area positions | 2,528 | 127.8 | 117.5 | 1,110 | |
| Other liabilities | 5,395 | (0.7) | (5.2) | 5,431 | |
| Economic capital allocated | 3,040 | 12.9 | 7.8 | 2,693 | |
| Relevant business indicators | 31-12-18 | ∆% | ∆%(1) | 31-12-17 |
|---|---|---|---|---|
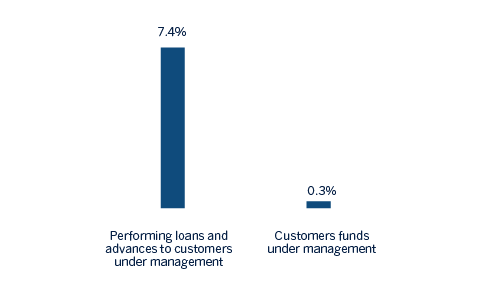
| Performing loans and advances to customers under management (2) | 60,784 | 12.5 | 7.4 | 54,036 |
| Non-performing loans | 802 | 15.1 | 9.9 | 696 |
| Customer deposits under management (2) | 63,888 | 5.1 | 0.3 | 60,806 |
| Off-balance sheet funds (3) | - | - | - | - |
| Risk-weighted assets | 64,146 | 9.3 | 4.4 | 58,688 |
| Efficiency ratio (%) | 62.3 | - | - | 64.4 |
| NPL ratio (%) | 1.3 | - | - | 1.2 |
| NPL coverage ratio (%) | 85 | - | - | 104 |
| Cost of risk (%) | 0.39 | - | - | 0.43 |
- (1) Figures at constant exchange rate.
- (2) Excluding repos.
- (3) Includes mutual funds, pension funds and other off-balance sheet funds.
Macro and industry trends
According to the latest available information from the Bureau of Economic Analysis (BEA), in the third quarter of 2018, annualized US GDP growth moderated from 4.2% to 3.4% as a result of the moderation of non-residential investment and the drop in exports after the strong rebound in the previous quarter. Furthermore, private consumption remains robust, supported by the dynamism of the labor market and the growth in wages, as well as public spending, driven by a more expansive fiscal policy. According to the most recent indicators growth could reach approximately 2.9% during 2018. Despite the strength of domestic demand and an unemployment rate below 4% last year, core inflation (PCE) remained relatively stable at approximately 2% in 2018, while the fall of prices of energy products was reflected in a strong moderation of headline inflation to 1.9% in November from rates close to 3% in the middle of the year. The Fed continued with the normalization process, with four increases of 25 basis points each in 2018 (up to the 2.25%-2.50% range).
The persistence of the expansive cycle in the country, together with the resurgence of uncertainty and financial volatility, associated with a combination of factors (among them, the fear of an escalating protectionism and a greater perception of risk on the vulnerability of emerging markets) have substantially revalued the dollar since the second quarter of 2018, which appreciated by around 7% during the year, with December closing data of the effective exchange rate weighted by the importance of its main trading partners.
The general situation of the country's banking system continued to be favorable. According to the latest available data from the Fed through November 2018, the total volume of bank credit in the system increased by 5.0% over the same month of the previous year, with a particularly positive performance in commercial loans (up 17.0% year-on-year), while real estate loans (including the mortgage loans) stayed flattish in the last twelve months. On the other hand, deposits remained basically at the same level as the prior year (down 0.6%). Lastly, non-performing loans continued their downward trend, with an NPL ratio of 1.58% at the end of the third quarter of 2018.
Activity
Unless expressly stated otherwise, all the comments below on rates of change, for both activity and earnings, will be given at constant exchange rate. These rates, together with changes at current exchange rate, can be seen in the attached tables of financial statements and relevant business indicators.
The most relevant aspects related to the area’s activity in 2018 were:
- Lending activity in the area (performing loans under management) showed an increase by 7.4% year-on-year.
- By portfolio, higher interest rates continued affecting negatively the mortgages and loans to developers (construction real estate). By contrast, the consumer and credit card loans, which have higher margins and are therefore more profitable, increased by 28.2% year-on-year. Both other commercial (up 7.0%) and corporates also performed well (up 12.3%).
- Regarding the risk indicators, slight rebound of the NPL ratio in the quarter, which stood at 1.3% from 1.1% registered as of 30-September-2018, due to the deterioration of certain singular clients. On the other hand, the NPL coverage ratio closed at 85%.
- Customer deposits under management closed in line with the figure of December 2017 (+0.3%), affected by the deposit-gathering campaigns, with an increase the time deposits (+2.2%) and a decrease in the demand deposits (-4.0%).
Results
The United States generated a cumulative net attributable profit of €735m during 2018, 56.9% higher than the one registered twelve months earlier, due mainly to the increase in net interest income, lower provisions and lower tax expenses. Also worth noting are the following:
- Net interest income continued to perform positively, with the cumulative figure up by 12.1% year-on-year and 2.9% over the last quarter of 2018. This was due partly to the Fed's interest-rate hikes, but also the measures adopted by BBVA Compass to improve loan yields and contain the increase in the cost of deposits (improved deposit mix and wholesale funding).
- Net fees and commissions declined by 3.8% year-on-year, due to a lower contribution from markets, investment banking and money transfers.
- Operating expenses grew by 4.9% year-on-year, mainly due to greater activity related to the growth of consumer loans. This increase is lower than that shown by the gross margin (+8.3%), as a result, the efficiency ratio improved.
- Impairment losses on financial assets fell by 2.6% in the last twelve months, due to the lower provisioning requirements in those portfolios affected by the 2017 hurricanes. As a result, the cumulative cost of risk through 31-December-2018 declined to 0.39%.
- Lastly, income tax declined as a result of a reduction in the effective tax rate following the tax reform approved at the end of 2017, which in addition generated a one-off charge in the amount of €78m due to the valuation of deferred tax assets.