Mexico
Highlights
- Good performance of the lending activity, with growth in all segments.
- Expenses continue to grow below the rate of gross income.
- Double-digit year-on-year growth in net attributable profit.
- Good asset quality indicators.
Business activity (1)
(Year-on-year change at constant exchange rate. Data as of 31-12-2018)
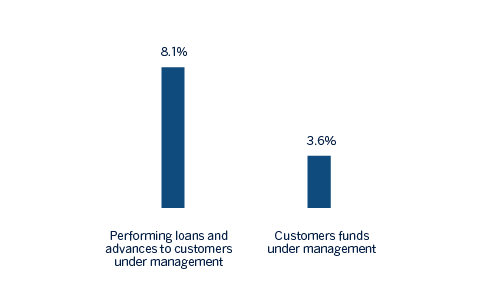
(1) Excluding repos.
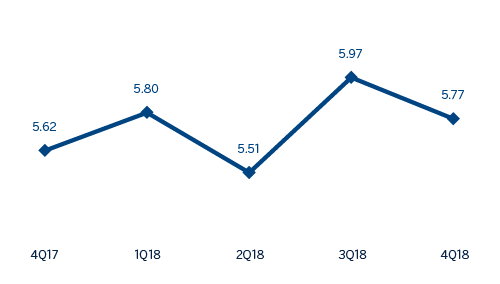
Net interest income/ATAs
(Percentage. Constant exchange rate)
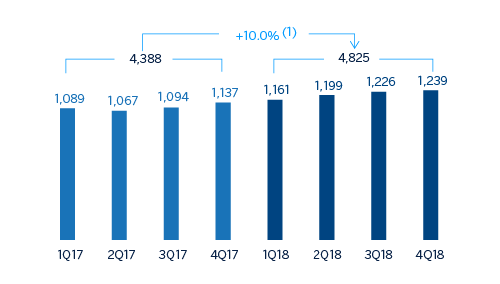
Operating income
(Millions of Euros at constant exchange rate)
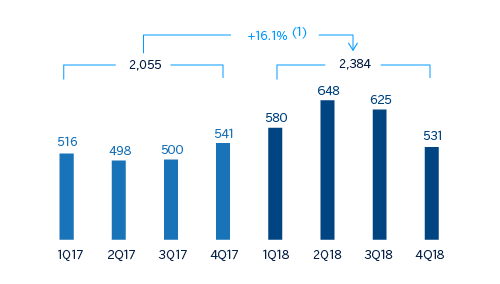
Net attributable profit
(Millions of Euros at constant exchange rate)
(1) At current exchange rate: +3.3%.
(1) At current exchange rate: +9.0%.
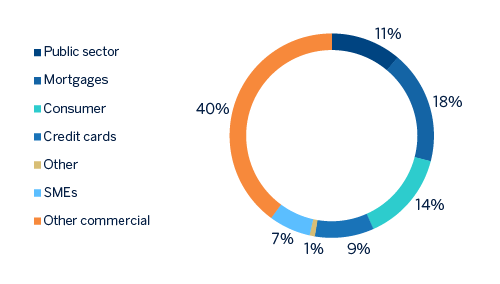
Breakdown of performing loans under management (1)
(31-12-2018)
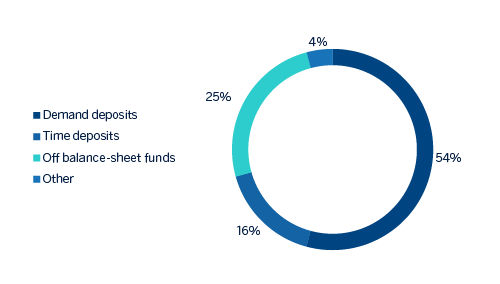
Breakdown of customer funds under management (1)
(31-12-2018)
(1) Excluding repos.
(1) Excluding repos.
Financial statements and relevant business indicators (Millions of Euros and percentage)
| IFRS 9 | IAS 39 | ||||
|---|---|---|---|---|---|
| Income statement | 2018 | ∆% | ∆%(1) | 2017 | |
| Net interest income | 5,568 | 1.7 | 8.2 | 5,476 | |
| Net fees and commissions | 1,205 | (1.2) | 5.1 | 1,219 | |
| Net trading income | 223 | (10.4) | (4.6) | 249 | |
| Other operating income and expenses | 197 | 11.2 | 18.3 | 177 | |
| Gross income | 7,193 | 1.0 | 7.5 | 7,122 | |
| Operating expenses | (2,368) | (3.4) | 2.8 | (2,452) | |
| Personnel expenses | (1,024) | (2.6) | 3.7 | (1,051) | |
| Other administrative expenses | (1,091) | (4.7) | 1.5 | (1,145) | |
| Depreciation | (253) | (1.3) | 5.1 | (256) | |
| Operating income | 4,825 | 3.3 | 10.0 | 4,671 | |
| Impairment on financial assets not measured at fair value through profit or loss | (1,555) | (5.8) | 0.2 | (1,651) | |
| Provisions or reversal of provisions and other results | 24 | n.s. | n.s. | (35) | |
| Profit/(loss) before tax | 3,294 | 10.4 | 17.5 | 2,984 | |
| Income tax | (909) | 14.0 | 21.4 | (797) | |
| Profit/(loss) for the year | 2,385 | 9.0 | 16.1 | 2,187 | |
| Non-controlling interests | (0) | 9.1 | 16.1 | (0) | |
| Net attributable profit | 2,384 | 9.0 | 16.1 | 2,187 | |
| IFRS 9 | IAS 39 | ||||
|---|---|---|---|---|---|
| Balance sheets | 31-12-18 | ∆% | ∆%(1) | 31-12-17 | |
| Cash, cash balances at central banks and other demand deposits | 8,274 | (6.3) | (11.0) | 8,833 | |
| Financial assets designated at fair value | 26,022 | (9.1) | (13.6) | 28,627 | |
| of which loans and advances | 72 | (95.4) | (95.6) | 1.558 | |
| Financial assets at amortized cost | 57,709 | 21.0 | 15.0 | 47,691 | |
| of which loans and advances to customers | 51,101 | 11.7 | 6.1 | 45,768 | |
| Tangible assets | 1,788 | 2.2 | (2.8) | 1,749 | |
| Other assets | 2,663 | (62.8) | (64.7) | 7,160 | |
| Total assets/liabilities and equity | 96,455 | 2.5 | (2.5) | 94,061 | |
| Financial liabilities held for trading and designated at fair value through profit or loss | 18,028 | 91.7 | 82.2 | 9,405 | |
| Deposits from central banks and credit institutions | 683 | (88.3) | (88.9) | 5.853 | |
| Deposits from customers | 50,530 | 1.1 | (3.9) | 49,964 | |
| Debt certificates | 8,566 | 17.1 | 11.4 | 7,312 | |
| Other liabilities | 14,508 | (17.7) | (21.8) | 17,627 | |
| Economic capital allocated | 4,140 | 6.2 | 0.9 | 3,901 | |
| Relevant business indicators | 31-12-18 | ∆% | ∆%(1) | 31-12-17 |
|---|---|---|---|---|
| Performing loans and advances to customers under management (2) | 51,387 | 13.7 | 8.1 | 45,196 |
| Non-performing loans | 1,138 | 1.3 | (3.7) | 1,124 |
| Customer deposits under management (2) | 49,740 | 10.3 | 4.9 | 45,093 |
| Off-balance sheet funds (3) | 20,647 | 6.0 | 0.8 | 19,472 |
| Risk-weighted assets | 53,359 | 18.7 | 12.9 | 44,941 |
| Efficiency ratio (%) | 32.9 | - | - | 34.4 |
| NPL ratio (%) | 2.1 | - | - | 2.3 |
| NPL coverage ratio (%) | 154 | - | - | 123 |
| Cost of risk (%) | 3.07 | - | - | 3.24 |
(1) Figures at constant exchange rate.
(2) Excluding repos.
(3) Includes mutual funds, pension funds and other off-balance sheet funds.
Macro and industry trends
The quarterly GDP growth in Mexico was 0.8% in the third quarter of 2018, measured in figures adjusted by seasonality. This expansion, after a growth by 1.1% in the first quarter and a slight contraction of 0.1% in the second quarter, is mainly explained by the expansion of services and the manufacturing sector. On the demand side, the main contribution to growth in the third quarter has been from consumption. While private investment has shown new signs of weakness. The trade agreement reached by Mexico, the United States and Canada, as well as the reduction in uncertainty regarding the economic policy of the administration of Andrés Manuel López Obrador, who assumed the presidency of the country on December 1, could help to maintain in the following periods the dynamism observed in the third quarter.
With respect to inflation, the increase observed in recent months seems to be transitory, since it is mainly due to the increase in energy prices, while core inflation remains relatively stable. This, together with contained inflation pressures, suggests that additional interest rate hikes by Banxico might not be necessary for the remainder of the year.
For yet another quarter, the Mexican banking system showed excellent levels of solvency and asset quality. According to the latest available information from the Mexican National Banking and Securities Commission (CNBV) in November 2018, activity remained as strong as in previous quarters, with year-on-year growth in the volume of lending and deposits (demand and time deposits) at 10.6% and 8.4%, respectively. Both the NPL ratio (2.2%) and NPL coverage ratio (150%) were stable. Finally, solvency in the system is at a comfortable level, with a capital adequacy ratio of 15.65% as of the end of October 2018.
Activity
Unless expressly stated otherwise, all the comments below on rates of change, for both activity and earnings, will be given at constant exchange rate. These rates, together with changes at current exchange rate, can be seen in the attached tables of financial statements and relevant business indicators.
The most relevant aspects related to the area’s activity year in 2018 were:
- Year-on-year increase in lending (performing loans and advances to customers under management) of 8.1%. BBVA maintains its leading position in the country, with a market share of 22.6% in outstanding performing loans, according to local figures from the CNBV at the end of November 2018.
- By portfolio: the wholesale portfolio, which represents 51.8% of total lending, increased by 9.4% in year-on-year terms, driven mainly by medium-sized companies and the corporates segment. As for the retail portfolio, it increased by 6.7% (including SMEs), which was heavily supported by consumer loans (payroll, personal and auto), which rose by 8.7%.
- With respect to the asset quality indicators, the NPL ratio closed at 2.1% from the 2.3% registered twelve months earlier. The NPL coverage ratio closed at 154%.
- Total customer funds customer deposits under management, mutual funds and other off-balance sheet funds) showed a year-on-year increase of 3.6%, with remarkable growth in demand deposits (+7.6%), in time deposits (+4.0%) and mutual funds (+2.6%).
- A profitable funding mix: low-cost accounts represent 77% of total customer deposits under management.
Results
BBVA in Mexico posted a net attributable profit of €2,384m, a year-on-year increase of 16.1%. The main highlights in the evolution of income statement in Mexico is summarized below:
- Positive performance of net interest income, which showed a year-on-year growth of +8.2%, highly aligned with lending activity (+8.1%).
- Good performance of net fees and commissions, which showed an increase of 5.1% as a result of increased activity in mutual funds, as well as a higher volume of transactions with on-line banking and credit card customers.
- NTI registered a decrease (-4.6%) due to the unfavorable performance of the Global Markets unit during 2018.
- The other income/expenses line registered year-on-year growth of 18.3%, mainly due to the positive performance of the insurance activity.
- Operating expenses continued to grow at a very controlled pace (up +2.8% year-on-year) and below the area's gross income growth (+7.5%). As a result, the efficiency ratio has continued to improve and stood at 32.9% as of December 31, 2018.
- Adequate risk management has been reflected in the change in the impairment losses on financial assets line item, which remains at the same level as 2017 (+0.2% year-on-year), despite the loan growth during the year, mainly explained by a change in the mix of the loan portfolio. As a result, the cumulative cost of risk in the area closed at 3.07% versus 3.24% as of December 2017.
- The positive evolution in the other gains (losses) line, that included the extraordinary income from the sale of BBVA Bancomer's stake in a real-estate development and the capital gain from the sale of a corporate building by Bancomer.