
Mexico
Highlights
- Lending growth boosted by the retail portfolio.
- Favourable performance of customer funds especially in time deposits and off-balance sheet funds.
- Positive performance of net interest income growing above activity.
- Good asset quality indicators.
Business activity (1)
(Year-on-year change at constant exchange rate. Data as of 30-06-19)
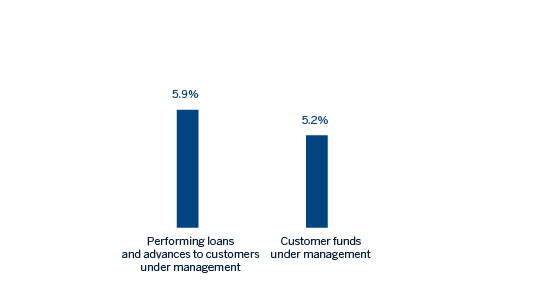
(1) Excluding repos.
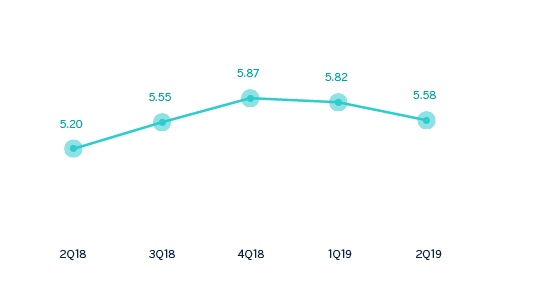
Net interest income/ATAs
(Percentage. Constant exchange rate)
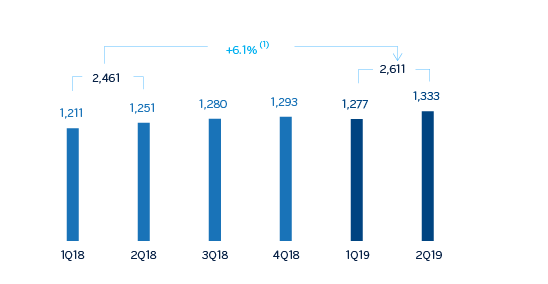
Operating income
(Millions of euros at constant exchange rate)
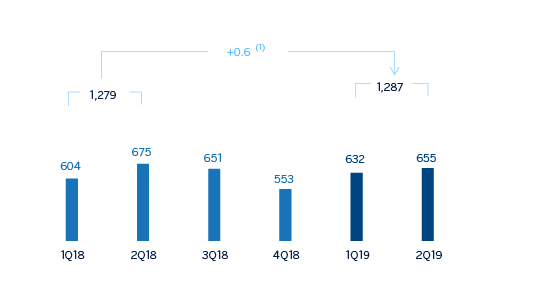
Net attributable profit
(Millions of euros at constant exchange rate)
(1) At current exchange rate: +13.1%.
(1) At current exchange rate: +7.2%.
Financial statements and relevant business indicators (Millions of euros and percentage)
| Income statement | 1H19 | ∆% | ∆% (1) | 1H18 |
|---|---|---|---|---|
| Net interest income | 3,042 | 14.9 | 7.8 | 2,648 |
| Net fees and commissions | 621 | 5.5 | (1.0) | 589 |
| Net trading income | 135 | (6.0) | (11.8) | 144 |
| Other operating income and expenses | 102 | 21.6 | 14.0 | 84 |
| Gross income | 3,901 | 12.6 | 5.6 | 3,465 |
| Operating expenses | (1,290) | 11.6 | 4.7 | (1,156) |
| Personnel expenses | (548) | 9.9 | 3.1 | (498) |
| Other administrative expenses | (570) | 6.4 | (0.2) | (536) |
| Depreciation | (172) | 41.3 | 32.5 | (122) |
| Operating income | 2,611 | 13.1 | 6.1 | 2,309 |
| Impairment on financial assets not measured at fair value through profit or loss | (818) | 15.5 | 8.4 | (708) |
| Provisions or reversal of provisions and other results | (10) | n.s. | n.s. | 54 |
| Profit/(loss) before tax | 1,783 | 7.8 | 1.1 | 1,654 |
| Income tax | (496) | 9.2 | 2.5 | (454) |
| Profit/(loss) for the year | 1,287 | 7.2 | 0.6 | 1,200 |
| Non-controlling interests | (0) | 12.1 | 5.1 | (0) |
| Net attributable profit | 1,287 | 7.2 | 0.6 | 1,200 |
| Balance sheets | 30-06-19 | ∆% | ∆% (1) | 31-12-18 |
|---|---|---|---|---|
| Cash, cash balances at central banks and other demand deposits | 10,051 | 21.5 | 17.9 | 8,274 |
| Financial assets designated at fair value | 28,405 | 9.2 | 5.9 | 26,022 |
| Of which loans and advances | 1,276 | n.s. | n.s. | 72 |
| Financial assets at amortized cost | 61,510 | 6.6 | 3.4 | 57,709 |
| Of which loans and advances to customers | 54,432 | 6.5 | 3.3 | 51,101 |
| Tangible assets | 2,020 | 13.0 | 9.6 | 1,788 |
| Other assets | 3,379 | (7.1) | (9.9) | 3,639 |
| Total assets/liabilities and equity | 105,366 | 8.1 | 4.9 | 97,432 |
| Financial liabilities held for trading and designated at fair value through profit or loss | 20,682 | 14.7 | 11.3 | 18,028 |
| Deposits from central banks and credit institutions | 1,868 | 173.4 | 165.2 | 683 |
| Deposits from customers | 52,960 | 4.8 | 1.7 | 50,530 |
| Debt certificates | 9,512 | 11.0 | 7.7 | 8,566 |
| Other liabilities | 16,287 | 5.2 | 2.0 | 15,485 |
| Economic capital allocated | 4,058 | (2.0) | (4.9) | 4,140 |
| Relevant business indicators | 30-06-19 | ∆% | ∆% (1) | 31-12-18 |
|---|---|---|---|---|
| Performing loans and advances to customers under management (2) | 55,046 | 7.1 | 3.9 | 51,387 |
| Non-performing loans | 1,289 | 13.3 | 9.9 | 1,138 |
| Customer deposits under management (2) | 52,679 | 5.9 | 2.7 | 49,740 |
| Off-balance sheet funds (3) | 23,419 | 13.4 | 10.0 | 20,647 |
| Risk-weighted assets | 55,919 | 5.2 | 2.0 | 53,177 |
| Efficiency ratio (%) | 33.1 | 33.3 | ||
| NPL ratio (%) | 2.2 | 2.1 | ||
| NPL coverage ratio (%) | 148 | 154 | ||
| Cost of risk (%) | 2.98 | 3.07 |
(1) Figures at constant exchange rate.
(2) Excluding repos.
(3) Includes mutual funds, pension funds and other off-balance sheet funds.
Activity
Unless expressly stated otherwise, all the comments below on rates of change, for both activity and results, will be given at constant exchange rates. These rates, together with changes at current exchange rates, can be found in the attached tables of financial statements and relevant business indicators. In addition, the quarterly variations are from the quarter ending with respect to the previous quarter.
The most relevant aspects related to the area's activity during the first half of 2019 were:
- Lending activity (performing loans under management) increased by 3.9% during the first half of the year (5.9% year-on-year). That allows BBVA to maintain its leading position in Mexico, with a market share of 22.2% in performing loans, according to local figures as of the end of May 2019 released by the National Banking and Securities Commission (CNBV).
- The wholesale portfolio, which represents 50% of total lending, grew by 0.5% in the first six months of the year, supported by 4.3% growth in corporate loans. Year-on-year growth was 1.9%, due to the strong lending activity to corporates and the public sector. Meanwhile, the retail portfolio (including SMEs) continues to perform strongly over the first six months of 2019 (up 4.8%), driven by consumer lending (payroll and personal loans) and mortgages. Noteworthy is the 8.3% growth in consumer loans resulting from the Bank's strategy to increase penetration among its customer base.
- Asset quality indicators as of June 30, 2019 remained similar to levels seen at the end of 2018: the NPL ratio closed at 2.2%, and coverage ratio stood at 148%.
- Total customer funds (customer deposits under management, mutual funds and other off-balance sheet funds) showed an increase of 4.9% in the first six months of the year, despite the highly competitive market. This is mainly explained by an increase of 5.8% in time deposits and 11.0% in mutual funds over the period. The year-on-year growth of total customer funds was 5.2%, driven by growth in both demand and time deposits. The funding mix remains unchanged from the end of December 2018, with demand deposits which represents 76% of total customer deposits under management, despite the transfer of demand deposits to time deposits and mutual funds. There was also a strong performance from off-balance sheet funds (up 10.0% compared to December 2018) and, in particular, mutual funds (up 11.0%).
Results
BBVA in Mexico showed a net attributable profit of €1,287m in the first six months of 2019, up 0.6% year-on-year. Net attributable profit was higher in the second quarter of the year (up 3.7% compared to the previous quarter). The most relevant aspects of the income statement evolution for the first half of 2019 are summarized below:
- Positive performance of net interest income, which showed a year-on-year growth of 7.8%, driven by higher income from the retail portfolio and low financing costs.
- Net fees and commissions registered a slight decrease of 1.0% year-on-year, with the comparison being affected by lower activity levels in corporate segments versus those registered in the same period of the previous year.
- NTI fell by 11.8%, mainly due to lower income from Global Markets and exchange rate transactions, which decreased compared to the previous year.
- The heading other operating income and expenses registered a year-on-year decrease of 14.0%, resulting from higher earnings in the insurance business.
- Gross income rgrew by 5.6% year-on-year. This growth is higher than the increase in operating expenses (up 4.7%) which, despite being strongly influenced by the effect of doubling the contribution to the Foundation, remain subject to a strict cost control policy. As a result, the efficiency ratio improved in the first half of 2019, standing at 33.1%.
- Impairment on financial assets grew by 8.4%, primarily due to one-off customers in the corporate portfolio and the impact due to the macroeconomic scenario adjustments. The cost of risk stood at 2.98%, improving slightly from the cumulative cost of risk of 3.07% in 2018.
- In the heading provisions (net) and other gains (losses), the comparison was negative due to extraordinary income in the first half of 2018 from the sale of holdings in real estate developments by BBVA in Mexico.