
Spain
Highlights
- Favorable trend of activity, especially in high profitable segments.
- Net Interest income affected by lower ALCO contribution and the impact of IFRS 16.
- The positive trend in operating expenses continues.
- Positive impact of the sale of NPL and write-off portfolios on loan loss provisions and risk indicators.
Business activity (1)
(Year-on-year change. Data as of 30-06-19)

(1) Excluding repos.
Net interest income/ATAs
(Percentage)

Operating income (Millions of euros)

Net attributable profit (Millions of euros)
Financial statements and relevant business indicators (Millions of euros and percentage)
| Income statement | 1H19 | ∆% | 1H18 |
|---|---|---|---|
| Net interest income | 1,808 | (2.4) | 1,852 |
| Net fees and commissions | 846 | (0.6) | 851 |
| Net trading income | 92 | (67.4) | 282 |
| Other operating income and expenses | 72 | 91.7 | 38 |
| Of which insurance activities (1) | 258 | 9.4 | 235 |
| Gross income | 2.818 | (6.8) | 3.023 |
| Operating expenses | (1,628) | (3.5) | (1,687) |
| Personnel expenses | (942) | (0.8) | (950) |
| Other administrative expenses | (447) | (23.5) | (584) |
| Depreciation | (239) | 56.5 | (152) |
| Operating income | 1.190 | (10.9) | 1.336 |
| Impairment on financial assets not measured at fair value through profit or loss | 25 | n.s. | (213) |
| Provisions or reversal of provisions and other results | (188) | 181.9 | (67) |
| Profit/(loss) before tax | 1.027 | (2.8) | 1.056 |
| Income tax | (292) | (5.5) | (309) |
| Profit/(loss) for the year | 735 | (1.7) | 748 |
| Non-controlling interests | (1) | (17.0) | (2) |
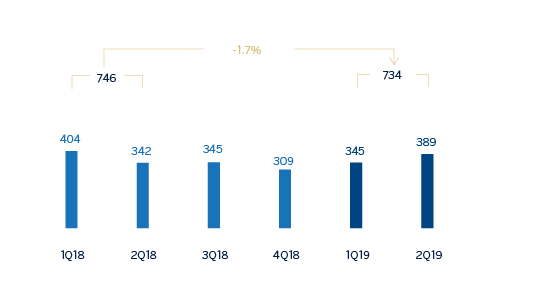
| Net attributable profit | 734 | (1.7) | 746 |
- (1) Includes premiums received net of estimated technical insurance reserves.
| Balance sheets | 30-06-19 | ∆% | 31-12-18 |
|---|---|---|---|
| Cash, cash balances at central banks and other demand deposits | 12,157 | (57.4) | 28,545 |
| Financial assets designated at fair value | 127,397 | 18.7 | 107,320 |
| Of which: Loans and advances | 37,564 | 24.3 | 30,222 |
| Financial assets at amortized cost | 200,008 | 2.3 | 195,467 |
| Of which: Loans and advances to customers | 171,081 | 0.4 | 170,438 |
| Inter-area positions | 18,794 | 34.0 | 14,026 |
| Tangible assets | 3,484 | 169.3 | 1,294 |
| Other assets | 7,142 | (13.4) | 8,249 |
| Total assets/liabilities and equity | 368,982 | 4.0 | 354,901 |
| Financial liabilities held for trading and designated at fair value through profit or loss | 80,487 | 13.3 | 71,033 |
| Deposits from central banks and credit institutions | 47,280 | 3.0 | 45,914 |
| Deposits from customers | 180,434 | (1.6) | 183,414 |
| Debt certificates | 32,861 | 4.8 | 31,352 |
| Inter-area positions | - | - | - |
| Other liabilities | 19,099 | 31.5 | 14,519 |
| Economic capital allocated | 8,822 | 1.8 | 8,670 |
| Relevant business indicators | 30-06-19 | ∆% | 31-12-18 |
|---|---|---|---|
| Performing loans and advances to customers under management (1) | 167,541 | 0.7 | 166,396 |
| Non-performing loans | 9,096 | (9.7) | 10,073 |
| Customer deposits under management (1) | 180,434 | (1.4) | 182,984 |
| Off-balance sheet funds (2) | 64,370 | 2.9 | 62,559 |
| Risk-weighted assets | 107,486 | 3.2 | 104,113 |
| Efficiency ratio (%) | 57.8 | 55.9 | |
| NPL ratio (%) | 4.6 | 5.1 | |
| NPL coverage ratio (%) | 58 | 57 | |
| Cost of risk (%) | (0.03) | 0.21 |
- (1) Excluding repos.
- (2) Includes mutual funds, pension funds and other off-balance-sheet funds.
Activity
The most relevant aspects related to the area's activity during the first half of 2019 were:
- As of June 30, 2019 lending (performing loans under management) increased 0.7% compared to the end of 2018 (up 0.8% year-on-year), supported by the positive performance of consumer loans and credit cards (up 9.2% in the first half of 2019, and up 18.2% year-on-year) as well as retail and medium-sized enterprises (up 3.5% in the first half of the year, and up 6.0% year-on-year), which more than offset the reduction in mortgage loans (down 1.6% in the first half of the year, and down 3.4% year-on-year).
- In terms of asset quality, NPL balances decreased in the quarter, with a positive impact on the NPL ratio which stood at 4.6% as of June 30, 2019 (5.1% as of December 31, 2018), mainly explained by the sale of non-performing real estate developer loans in the second quarter and, in general, due to a lower level of non-performing mortgage loans. The coverage ratio stood at 58%, above the closing of 2018.
- Customer deposits under management registered a slight reduction compared to December 2018, with growth in demand deposits of 3.6% in the first half of the year (up 9.2% year-on-year) and a reduction in time deposits (down 19.2% in the first half of the year, and down 19.4% year-on-year). However, total deposits remained stable over the first six months of 2019, and increased by 2.7% in the last twelve months. Demand deposits now account for more than 80% of total customer deposits.
- Off-balance sheet funds performed well (up 2.9% since December 31, 2018 and up 0.8% year-on-year), especially in mutual funds, supported by the positive evolution of the market in the first half of the year.
Results
Net attributable profit of BBVA in Spain stood at €734m, in the first half of 2019 slightly below the figure registered in the same period of the previous year (down 1.7%).
The main highlights of the area's income statement are:
- Net interest income decreased by 2.4% year-on-year, affected by the lower contribution from the ALCO portfolios and the effect of IFRS 16 implementation.
- Net fees and commissions remained virtually flat year-on-year (down 0.6%).
- Lower contribution from NTI (down 67.4% compared to the first half of 2018), due to uneven market performance in the first six months of the year and lower portfolio sales.
- Other operating income and expenses showed a year-on-year growth (up 91.7%) driven by the strong performance of net earnings from the insurance business, although the quarter-on-quarter comparison is negatively affected by the contribution to the SRF in the second quarter of 2019.
- The favorable performance of impairment losses on financial assets continues as a result of the positive impact of the aforementioned sale of non-performing and write-offs from real estate developer loans, and the lower reserve requirements, primarily in real estate developer loan portfolios.
- Finally, provisions (net) and other gains (losses) showed a year-on-year increase due to the positive valuation of assets in the former Non Core Real Estate area in the first half of last year.