
Turkey
Highlights
- Positive trend in activity.
- Good performance of net interest income, favored by the income from inflation-linked bonds.
- Operating expenses growth below the inflation rate.
- Positive evolution of the recurring revenue items offset by higher loan-loss provisions on financial assets.
Business activity (1)
(Year-on-year change at constant exchange rate. Data as of 30-06-19)
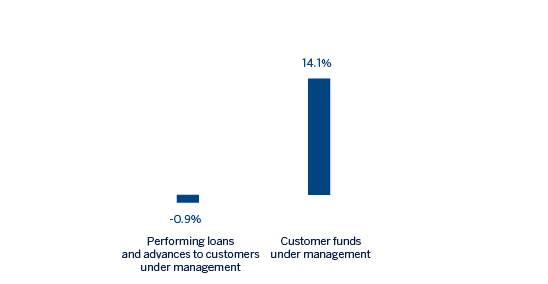
(1) Excluding repos.
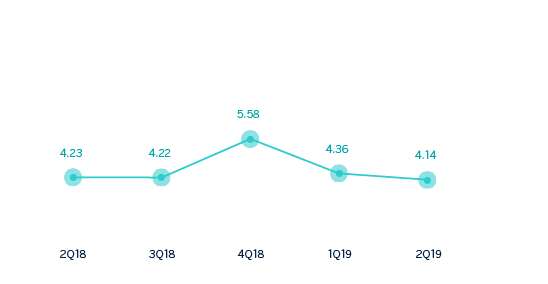
Net interest income/ATAs
(Percentage. Constant exchange rate)
Operating income
(Millions of euros at constant exchange rate)

(1) At current exchange rate: -13.0%.
Net attributable profit
(Millions of euros at constant exchange rate)
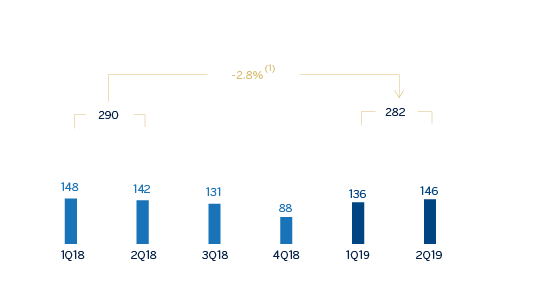
(1) At current exchange rate: -24.2%.
Financial statements and relevant business indicators (Millions of euros and percentage)
| Income statement | 1H19 | ∆% | ∆% (1) | 1H18 |
|---|---|---|---|---|
| Net interest income | 1,353 | (10.4) | 15.0 | 1,510 |
| Net fees and commissions | 360 | (2.9) | 24.5 | 371 |
| Net trading income | (65) | n.s. | n.s. | 4 |
| Other operating income and expenses | 30 | (24.1) | (2.6) | 39 |
| Gross income | 1,677 | (12.8) | 11.9 | 1,924 |
| Operating expenses | (594) | (12.5) | 12.2 | (679) |
| Personnel expenses | (335) | (5.9) | 20.7 | (356) |
| Other administrative expenses | (173) | (29.4) | (9.4) | (244) |
| Depreciation | (86) | 9.8 | 40.9 | (78) |
| Operating income | 1,084 | (13.0) | 11.7 | 1,245 |
| Impaiment on financial assets not measured at fair value through profit or loss | (337) | 6.8 | 37.1 | (315) |
| Provisions or reversal of provisions and other results | (21) | n.s. | n.s. | 34 |
| Profit/(loss) before tax | 726 | (24.7) | (3.5) | 964 |
| Income tax | (153) | (27.2) | (6.6) | (210) |
| Profit/(loss) for the year | 573 | (24.1) | (2.6) | 754 |
| Non-controlling interests | (291) | (23.9) | (2.4) | (383) |
| Net attributable profit | 282 | (24.2) | (2.8) | 372 |
| Balance sheets | 30-06-19 | ∆% | ∆% (1) | 31-12-18 |
|---|---|---|---|---|
| Cash. cash balances at central banks and other demand deposits | 7,687 | (2.1) | 6.1 | 7,853 |
| Financial assets designated at fair value | 5,257 | (4.5) | 3.5 | 5,506 |
| Of which loans and advances | 414 | 1.0 | 9.4 | 410 |
| Financial assets at amortized cost | 49,119 | (2.4) | 5.8 | 50,315 |
| Of which loans and advances to customers | 39,286 | (5.3) | 2.6 | 41,478 |
| Tangible assets | 1,129 | 6.5 | 15.4 | 1,059 |
| Other assets | 1,449 | (4.4) | 3.6 | 1,517 |
| Total assets/liabilities and equity | 64,641 | (2.4) | 5.7 | 66,250 |
| Financial liabilities held for trading and designated at fair value through profit or loss | 2,275 | 22.9 | 33.2 | 1,852 |
| Deposits from central banks and credit institutions | 5,459 | (18.9) | (12.2) | 6,734 |
| Deposits from customers | 39,456 | (1.1) | 7.1 | 39,905 |
| Debt certificates | 5,799 | (2.8) | 5.4 | 5,964 |
| Other liabilities | 9,051 | (2.3) | 5.8 | 9,267 |
| Economic capital allocated | 2,601 | 2.8 | 11.4 | 2,529 |
| Relevant business indicators | 30-06-19 | ∆% | ∆% (1) | 31-12-18 |
|---|---|---|---|---|
| Performing loans and advances to customers under management (2) | 38,542 | (6.0) | 1.9 | 40,996 |
| Non-performing loans | 3,254 | 13.1 | 22.6 | 2,876 |
| Customer deposits under management (2) | 39,452 | (1.1) | 7.2 | 39,897 |
| Off-balance sheet funds (3) | 2,983 | 3.1 | 11.7 | 2,894 |
| Risk-weighted assets | 57,551 | 1.9 | 10.4 | 56,486 |
| Efficiency ratio (%) | 35.4 | 32.0 | ||
| NPL ratio (%) | 6.3 | 5.3 | ||
| NPL coverage ratio (%) | 75 | 81 | ||
| Cost of risk (%) | 1.57 | 2.44 |
(1) Figures at constant exchange rate.
(2) Excluding repos.
(3) Includes mutual funds, pension funds and other off-balance-sheet funds.
Activity
Unless expressly stated and communicated otherwise, rates of changes explained ahead, both for activity and for income, will be presented at constant exchange rates. These rates, together with changes at current exchange rates, can be observed in the attached tables of the financial statements and relevant business indicators. In addition, the quarterly variations are from the quarter ending with respect to the previous quarter.
The most relevant aspects related to the area’s activity year-to-date as of June 30, 2019 were:
- Lending activity (performing loans under management) increased slightly by 1.9% year-to-date (down 0.9% year-on-year) mainly driven by currency depreciation impact and continued contraction of foreign-currency loans (in U.S. dollar terms). Turkish Lira loans reduced in the second quarter by -4.8%, after experiencing a notable growth in the first quarter.
- Despite contracting in the second quarter, Turkish Lira commercial loans grew year to date thanks to a strong performance in the first quarter supported by the Credit Guarantee Fund (CGF) utilization and short term corporate loans. Additionally, a downward trend in the consumer loans continued mainly driven by mortgage and auto loans. On the other hand, credit cards showed a solid performance during the quarter.
- In terms of asset quality, the NPL ratio increased to 6.3% mainly due to some specific customers in the wholesale portfolio. The NPL coverage ratio stood at 75%.
- Customer deposits (61% of total liabilities in the area as of June 30, 2019) remained the main source of funding for the balance sheet and increased by 7.2% on a year to date basis, yet it remained stable during the quarter. It is worth mentioning the good performance of demand deposits, which increased by 21.5% year to date and 5.6% in the quarter.
Results
Turkey generated a net attributable profit of €282m in the first half of 2019, representing a 2.8% decrease in year-on-year terms (up 6.9% in the second quarter of 2019). The most significant aspects of the year-on-year evolution in the income statement are the following:
- Positive performance of net interest income (up 15.0%) mainly thanks to the significant income from inflation-linked bonds and, to a lesser extent good ALM portfolio management despite the increase in cost of funding.
- Income from net fees and commissions grew by 24.5%. This significant increase was mainly driven by the positive performance in payment systems and backed by money transfers and non-cash loans.
- Decrease in NTI due to the unfavorable market conditions which was not offset by the strong performance of the asset and liabilities management and derivative gains.
- Gross income grew 11.9% in the first half of 2019 compared to the same period of 2018, thanks to increased core banking revenues and the aforementioned high contribution from inflation-linked bonds.
- Operating expenses increased by 12.2%, significantly below the average inflation rate during the last 12 months (19.9%). As a result of strict cost-control discipline, the efficiency ratio remained at low levels (35.4%).
- Impairment losses on financial assets rose by 37.1% on a year on year basis due to some negative impacts from wholesale portfolio and higher macro scenario adjustments. As a result, the cumulative cost of risk of the area stood at 1.57%.